By InvestMacro | COT | Data Tables | COT Leaders | Downloads | COT Newsletter
Here are the latest charts and statistics for the Commitment of Traders (COT) data published by the Commodities Futures Trading Commission (CFTC).
The latest COT data is updated through Tuesday June 7th and shows a quick view of how large traders (for-profit speculators and commercial entities) were positioned in the futures markets.
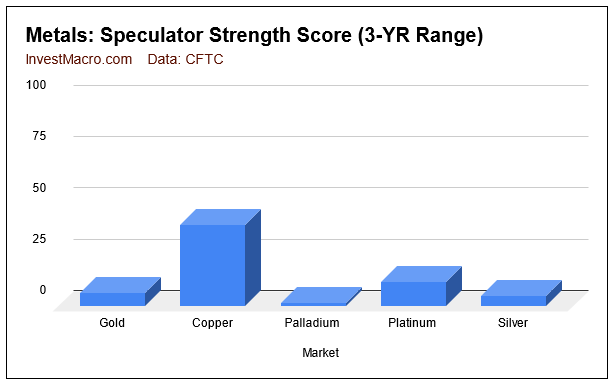
COT metals market speculator bets were mostly rising this week as five out of the six metals markets we cover had higher positioning this week while only one market had lower contracts.
Leading the gains for the precious metals markets was Copper (14,311 contracts) and Platinum (3,570 contracts) with Silver (3,407 contracts) and Gold (2,679 contracts) also showing a positive week. Meanwhile, the only market with declines in speculator bets this week was Palladium with a fall of -328 contracts.
Free Reports:
| Jun-07-2022 | OI | OI-Index | Spec-Net | Spec-Index | Com-Net | COM-Index | Smalls-Net | Smalls-Index |
|---|---|---|---|---|---|---|---|---|
| WTI Crude | 1,790,618 | 10 | 328,256 | 8 | -369,033 | 93 | 40,777 | 72 |
| Gold | 494,130 | 12 | 175,268 | 7 | -199,886 | 95 | 24,618 | 18 |
| Silver | 148,294 | 15 | 17,404 | 5 | -27,990 | 94 | 10,586 | 10 |
| Copper | 194,187 | 22 | -3,714 | 40 | 879 | 60 | 2,835 | 42 |
| Palladium | 7,035 | 3 | -3,461 | 2 | 3,581 | 97 | -120 | 37 |
| Platinum | 65,295 | 31 | 5,933 | 12 | -9,742 | 92 | 3,809 | 15 |
| Natural Gas | 1,127,731 | 10 | -114,342 | 44 | 66,419 | 52 | 47,923 | 93 |
| Brent | 169,802 | 16 | -36,098 | 51 | 34,208 | 50 | 1,890 | 35 |
| Heating Oil | 261,651 | 20 | 4,886 | 50 | -24,428 | 45 | 19,542 | 66 |
| Soybeans | 760,444 | 35 | 176,644 | 68 | -148,390 | 39 | -28,254 | 23 |
| Corn | 1,557,167 | 31 | 391,264 | 80 | -337,137 | 24 | -54,127 | 12 |
| Coffee | 222,583 | 15 | 48,767 | 81 | -51,363 | 23 | 2,596 | 16 |
| Sugar | 849,814 | 12 | 195,403 | 77 | -234,496 | 24 | 39,093 | 56 |
| Wheat | 333,705 | 12 | 23,881 | 50 | -19,863 | 31 | -4,018 | 90 |
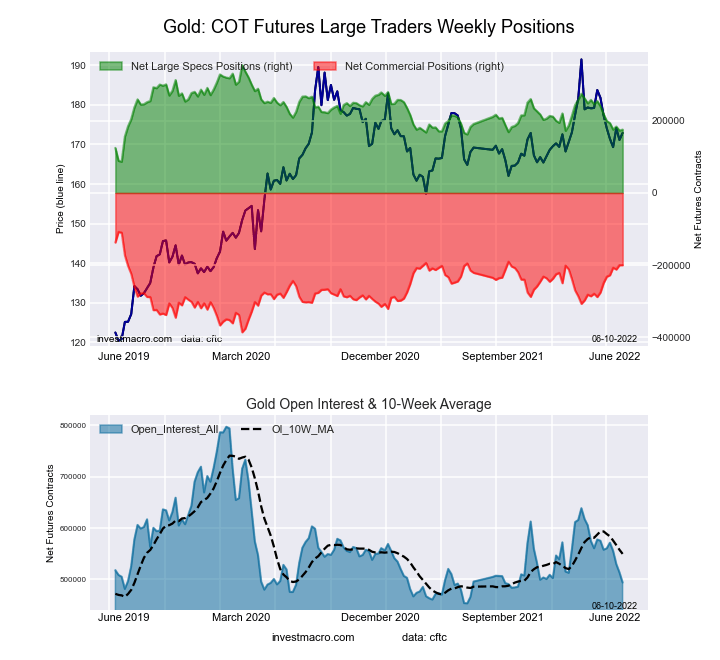
This week’s current strength score (the trader positioning range over the past three years, measured from 0 to 100) shows the speculators are currently Bearish-Extreme with a score of 6.8 percent. The commercials are Bullish-Extreme with a score of 95.0 percent and the small traders (not shown in chart) are Bearish-Extreme with a score of 18.0 percent.
| Gold Futures Statistics | SPECULATORS | COMMERCIALS | SMALL TRADERS |
| – Percent of Open Interest Longs: | 54.7 | 23.7 | 8.9 |
| – Percent of Open Interest Shorts: | 19.2 | 64.1 | 3.9 |
| – Net Position: | 175,268 | -199,886 | 24,618 |
| – Gross Longs: | 270,356 | 116,965 | 44,090 |
| – Gross Shorts: | 95,088 | 316,851 | 19,472 |
| – Long to Short Ratio: | 2.8 to 1 | 0.4 to 1 | 2.3 to 1 |
| NET POSITION TREND: | |||
| – Strength Index Score (3 Year Range Pct): | 6.8 | 95.0 | 18.0 |
| – Strength Index Reading (3 Year Range): | Bearish-Extreme | Bullish-Extreme | Bearish-Extreme |
| NET POSITION MOVEMENT INDEX: | |||
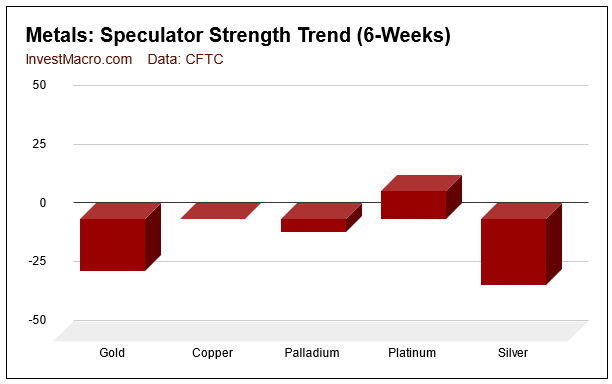
| – 6-Week Change in Strength Index: | -22.3 | 25.3 | -23.5 |
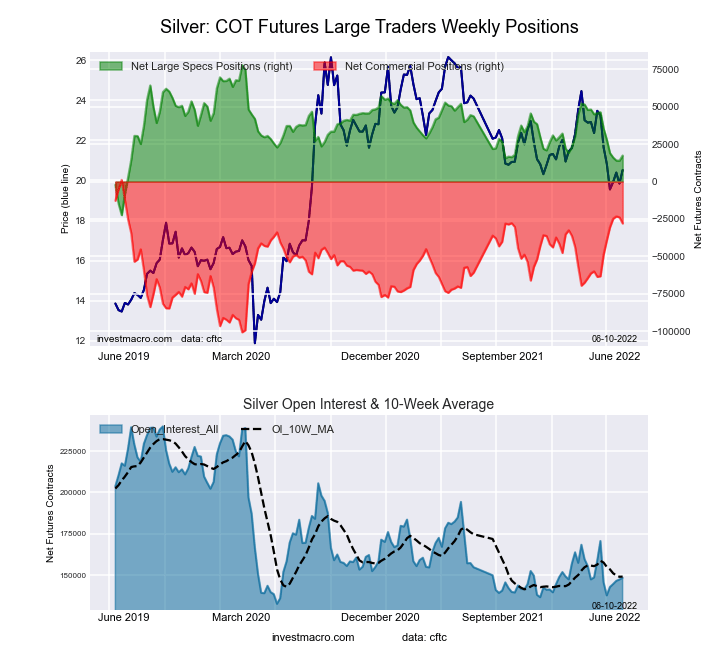
This week’s current strength score (the trader positioning range over the past three years, measured from 0 to 100) shows the speculators are currently Bearish-Extreme with a score of 5.3 percent. The commercials are Bullish-Extreme with a score of 93.9 percent and the small traders (not shown in chart) are Bearish-Extreme with a score of 10.2 percent.
| Silver Futures Statistics | SPECULATORS | COMMERCIALS | SMALL TRADERS |
| – Percent of Open Interest Longs: | 37.0 | 36.9 | 16.9 |
| – Percent of Open Interest Shorts: | 25.3 | 55.8 | 9.8 |
| – Net Position: | 17,404 | -27,990 | 10,586 |
| – Gross Longs: | 54,899 | 54,707 | 25,089 |
| – Gross Shorts: | 37,495 | 82,697 | 14,503 |
| – Long to Short Ratio: | 1.5 to 1 | 0.7 to 1 | 1.7 to 1 |
| NET POSITION TREND: | |||
| – Strength Index Score (3 Year Range Pct): | 5.3 | 93.9 | 10.2 |
| – Strength Index Reading (3 Year Range): | Bearish-Extreme | Bullish-Extreme | Bearish-Extreme |
| NET POSITION MOVEMENT INDEX: | |||
| – 6-Week Change in Strength Index: | -28.2 | 26.8 | -15.3 |
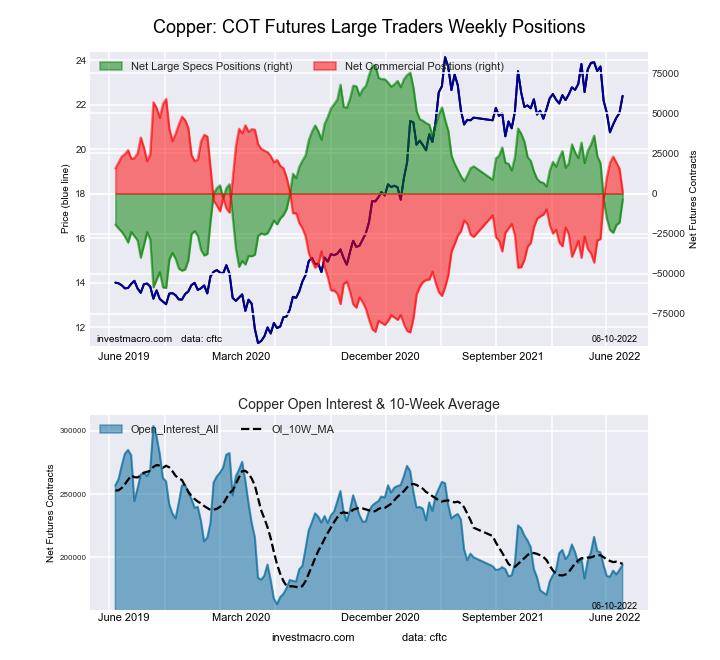
This week’s current strength score (the trader positioning range over the past three years, measured from 0 to 100) shows the speculators are currently Bearish with a score of 39.7 percent. The commercials are Bullish with a score of 60.1 percent and the small traders (not shown in chart) are Bearish with a score of 41.7 percent.
| Copper Futures Statistics | SPECULATORS | COMMERCIALS | SMALL TRADERS |
| – Percent of Open Interest Longs: | 30.0 | 51.7 | 8.6 |
| – Percent of Open Interest Shorts: | 31.9 | 51.3 | 7.1 |
| – Net Position: | -3,714 | 879 | 2,835 |
| – Gross Longs: | 58,232 | 100,449 | 16,646 |
| – Gross Shorts: | 61,946 | 99,570 | 13,811 |
| – Long to Short Ratio: | 0.9 to 1 | 1.0 to 1 | 1.2 to 1 |
| NET POSITION TREND: | |||
| – Strength Index Score (3 Year Range Pct): | 39.7 | 60.1 | 41.7 |
| – Strength Index Reading (3 Year Range): | Bearish | Bullish | Bearish |
| NET POSITION MOVEMENT INDEX: | |||
| – 6-Week Change in Strength Index: | 0.1 | 2.8 | -23.7 |
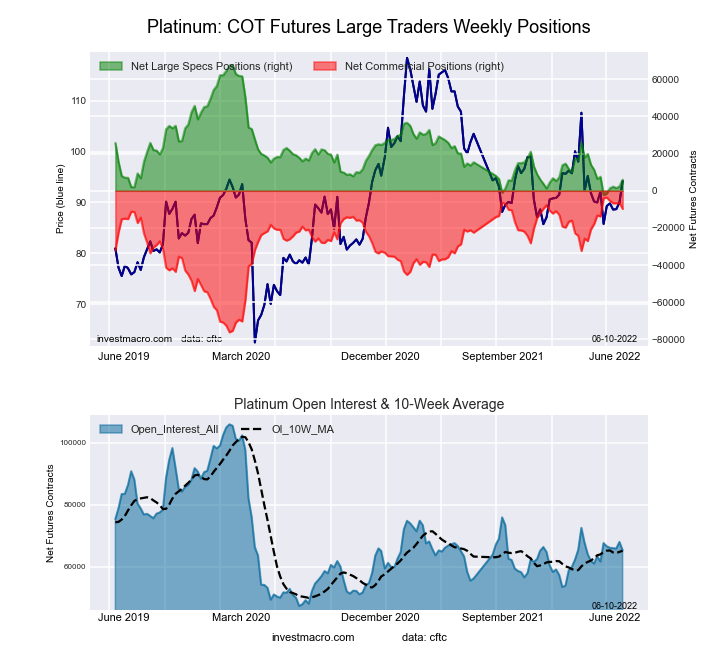
This week’s current strength score (the trader positioning range over the past three years, measured from 0 to 100) shows the speculators are currently Bearish-Extreme with a score of 11.9 percent. The commercials are Bullish-Extreme with a score of 91.6 percent and the small traders (not shown in chart) are Bearish-Extreme with a score of 15.1 percent.
| Platinum Futures Statistics | SPECULATORS | COMMERCIALS | SMALL TRADERS |
| – Percent of Open Interest Longs: | 41.4 | 41.1 | 11.5 |
| – Percent of Open Interest Shorts: | 32.3 | 56.0 | 5.6 |
| – Net Position: | 5,933 | -9,742 | 3,809 |
| – Gross Longs: | 27,004 | 26,823 | 7,479 |
| – Gross Shorts: | 21,071 | 36,565 | 3,670 |
| – Long to Short Ratio: | 1.3 to 1 | 0.7 to 1 | 2.0 to 1 |
| NET POSITION TREND: | |||
| – Strength Index Score (3 Year Range Pct): | 11.9 | 91.6 | 15.1 |
| – Strength Index Reading (3 Year Range): | Bearish-Extreme | Bullish-Extreme | Bearish-Extreme |
| NET POSITION MOVEMENT INDEX: | |||
| – 6-Week Change in Strength Index: | 11.9 | -7.9 | -35.4 |
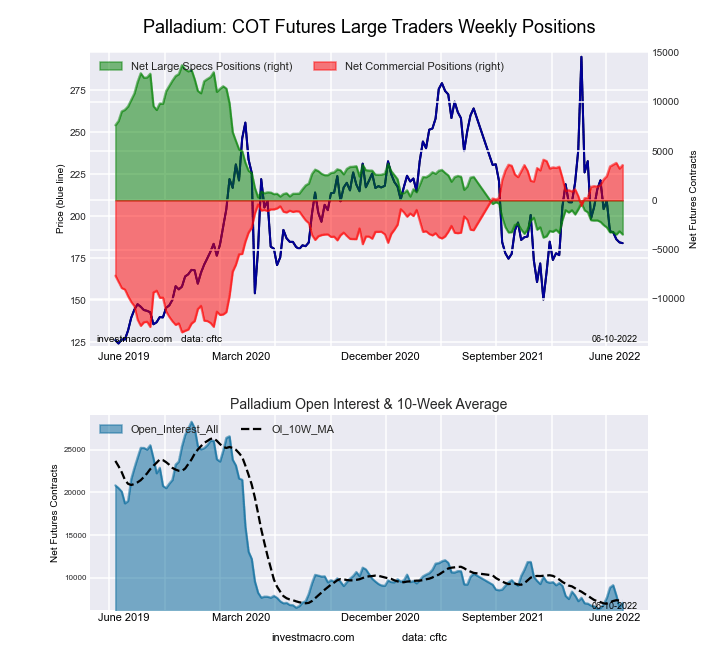
This week’s current strength score (the trader positioning range over the past three years, measured from 0 to 100) shows the speculators are currently Bearish-Extreme with a score of 1.8 percent. The commercials are Bullish-Extreme with a score of 96.9 percent and the small traders (not shown in chart) are Bearish with a score of 36.9 percent.
| Palladium Futures Statistics | SPECULATORS | COMMERCIALS | SMALL TRADERS |
| – Percent of Open Interest Longs: | 13.4 | 70.9 | 15.2 |
| – Percent of Open Interest Shorts: | 62.6 | 20.0 | 16.9 |
| – Net Position: | -3,461 | 3,581 | -120 |
| – Gross Longs: | 943 | 4,985 | 1,072 |
| – Gross Shorts: | 4,404 | 1,404 | 1,192 |
| – Long to Short Ratio: | 0.2 to 1 | 3.6 to 1 | 0.9 to 1 |
| NET POSITION TREND: | |||
| – Strength Index Score (3 Year Range Pct): | 1.8 | 96.9 | 36.9 |
| – Strength Index Reading (3 Year Range): | Bearish-Extreme | Bullish-Extreme | Bearish |
| NET POSITION MOVEMENT INDEX: | |||
| – 6-Week Change in Strength Index: | -5.5 | 8.3 | -29.3 |
Article By InvestMacro – Receive our weekly COT Reports by Email
*COT Report: The COT data, released weekly to the public each Friday, is updated through the most recent Tuesday (data is 3 days old) and shows a quick view of how large speculators or non-commercials (for-profit traders) were positioned in the futures markets.
The CFTC categorizes trader positions according to commercial hedgers (traders who use futures contracts for hedging as part of the business), non-commercials (large traders who speculate to realize trading profits) and nonreportable traders (usually small traders/speculators) as well as their open interest (contracts open in the market at time of reporting).See CFTC criteria here.
By Analytical Department RoboForex GBP/USD fell to 1.3437 on Tuesday as investors assessed the appointment…
By JustMarkets The US stock indices ended Friday’s session in the red. By the end…
By Analytical Department RoboForex USD/JPY opens the week at 162.36 on Monday. The Japanese yen…
By InvestMacro Here are the latest charts and statistics for the Commitment of Traders (COT)…
By InvestMacro The latest update for the weekly Commitment of Traders (COT) report was released…
By InvestMacro Here are the latest charts and statistics for the Commitment of Traders (COT)…
This website uses cookies.