By InvestMacro | COT | Data Tables | COT Leaders | Downloads | COT Newsletter
Here are the latest charts and statistics for the Commitment of Traders (COT) data published by the Commodities Futures Trading Commission (CFTC).
The latest COT data is updated through Tuesday June 7th and shows a quick view of how large traders (for-profit speculators and commercial entities) were positioned in the futures markets.
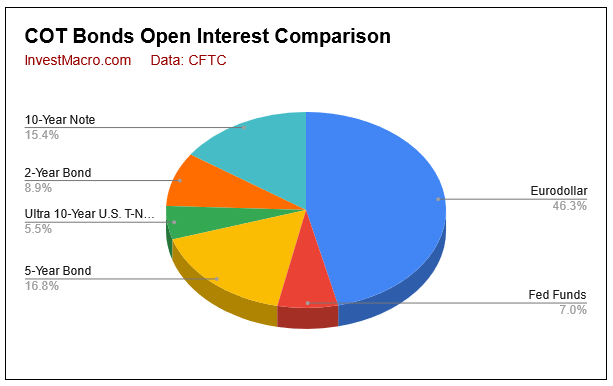
Bond market speculator bets were mostly on the lower side this week as only three out of the eight bond markets we cover had higher positioning this week while five markets had lower contracts.
Leading the gains for the COT bonds markets was the Eurodollar (208,714 contracts) and the Fed Funds (29,026 contracts) with the Ultra 10-Year Bond (29,533 contracts) also showing a positive week.
Free Reports:
Meanwhile, leading the declines in speculator bets this week were the 2-Year Bond (-42,371 contracts) and the 10-Year Bond (-27,280 contracts) with the Long US Bond (-14,798 contracts), Ultra US Bond (-5,695 contracts) and the 5-Year Bond (-4,759 contracts) also registering lower bets on the week.
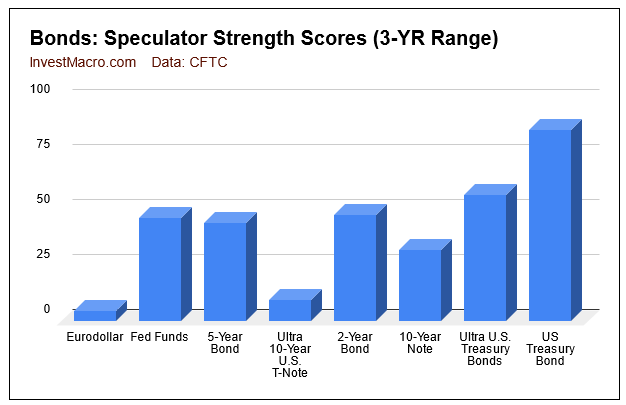
Strength scores (3-Year range of Speculator positions, from 0 to 100 where above 80 is extreme bullish and below 20 is extreme bearish) show that the Ultra US Treasury Bond and the US Treasury Bond are above their midpoint levels for the past 3 years while all the other markets are below the 50 percent level. The US Treasury Bond is actually in an extreme-bullish level currently while the Eurodollar and the Ultra 10-Year Note are both in extreme-bearish levels at the moment.
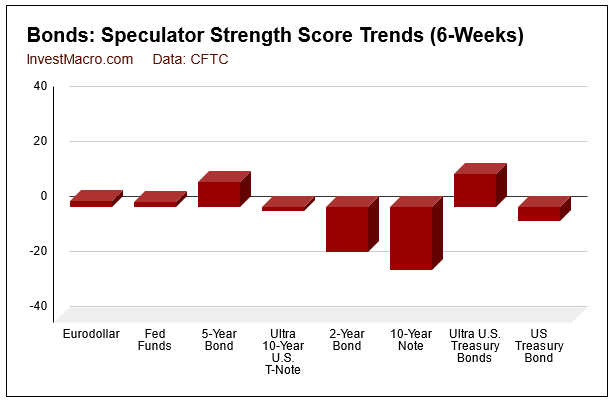
Strength score trends (or move index, that calculate the 6-week changes in strength scores) shows that the 5-Year Bond and the Ultra US Treasury Bond have had the highest rising scores over the past six weeks. On the downside, the 10-Year Bond and the 2-Year Bond have shown the largest downward trends.
| Jun-07-2022 | OI | OI-Index | Spec-Net | Spec-Index | Com-Net | COM-Index | Smalls-Net | Smalls-Index |
|---|---|---|---|---|---|---|---|---|
| Eurodollar | 10,409,834 | 32 | -2,646,502 | 4 | 3,023,490 | 95 | -376,988 | 21 |
| FedFunds | 1,568,823 | 44 | 54,233 | 46 | -47,932 | 54 | -6,301 | 44 |
| 2-Year | 2,002,134 | 10 | -170,489 | 48 | 225,040 | 69 | -54,551 | 26 |
| Long T-Bond | 1,193,131 | 48 | 4,963 | 86 | -5,633 | 18 | 670 | 53 |
| 10-Year | 3,469,948 | 28 | -266,187 | 32 | 426,524 | 73 | -160,337 | 42 |
| 5-Year | 3,784,732 | 39 | -222,547 | 44 | 409,463 | 63 | -186,916 | 30 |
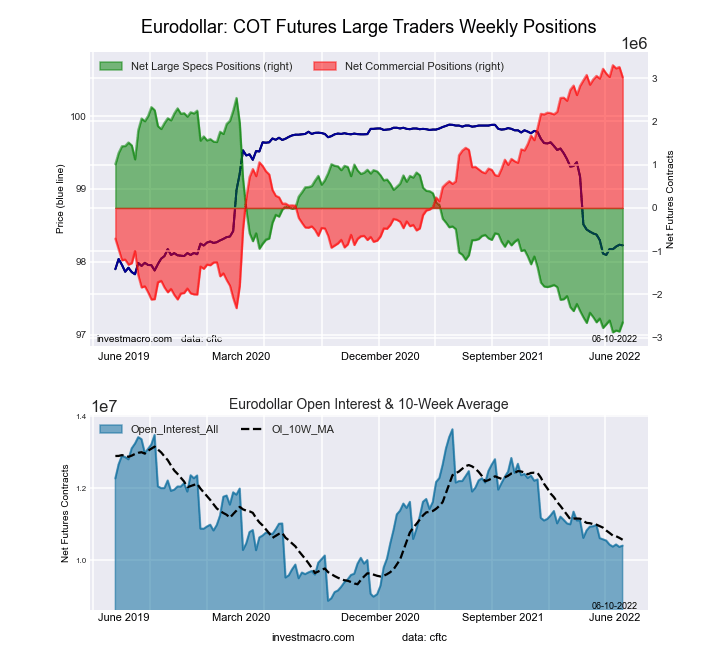
This week’s current strength score (the trader positioning range over the past three years, measured from 0 to 100) shows the speculators are currently Bearish-Extreme with a score of 4.2 percent. The commercials are Bullish-Extreme with a score of 95.1 percent and the small traders (not shown in chart) are Bearish with a score of 21.5 percent.
| 3-Month Eurodollars Statistics | SPECULATORS | COMMERCIALS | SMALL TRADERS |
| – Percent of Open Interest Longs: | 3.5 | 74.1 | 3.7 |
| – Percent of Open Interest Shorts: | 29.0 | 45.0 | 7.4 |
| – Net Position: | -2,646,502 | 3,023,490 | -376,988 |
| – Gross Longs: | 367,476 | 7,712,618 | 389,949 |
| – Gross Shorts: | 3,013,978 | 4,689,128 | 766,937 |
| – Long to Short Ratio: | 0.1 to 1 | 1.6 to 1 | 0.5 to 1 |
| NET POSITION TREND: | |||
| – Strength Index Score (3 Year Range Pct): | 4.2 | 95.1 | 21.5 |
| – Strength Index Reading (3 Year Range): | Bearish-Extreme | Bullish-Extreme | Bearish |
| NET POSITION MOVEMENT INDEX: | |||
| – 6-Week Change in Strength Index: | 2.3 | -3.5 | 14.9 |
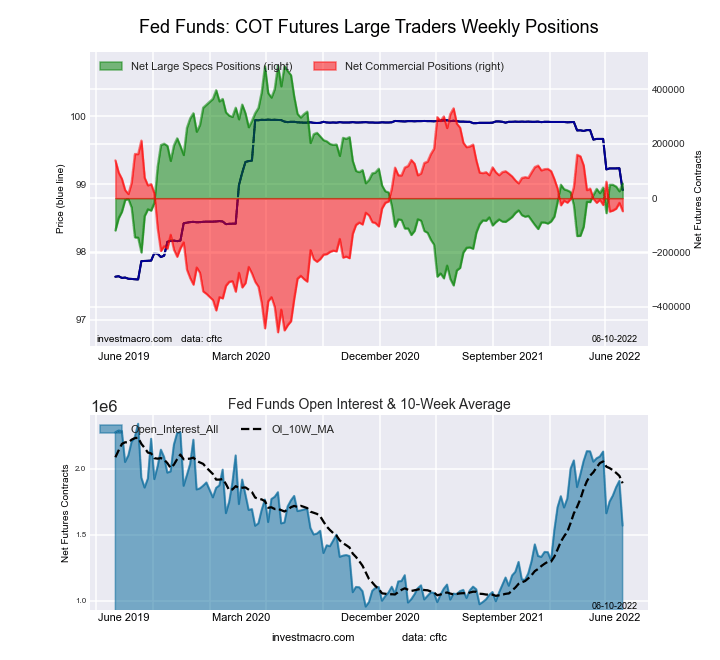
This week’s current strength score (the trader positioning range over the past three years, measured from 0 to 100) shows the speculators are currently Bearish with a score of 46.3 percent. The commercials are Bullish with a score of 54.1 percent and the small traders (not shown in chart) are Bearish with a score of 43.7 percent.
| 30-Day Federal Funds Statistics | SPECULATORS | COMMERCIALS | SMALL TRADERS |
| – Percent of Open Interest Longs: | 9.6 | 74.5 | 2.6 |
| – Percent of Open Interest Shorts: | 6.1 | 77.5 | 3.0 |
| – Net Position: | 54,233 | -47,932 | -6,301 |
| – Gross Longs: | 149,853 | 1,168,089 | 40,470 |
| – Gross Shorts: | 95,620 | 1,216,021 | 46,771 |
| – Long to Short Ratio: | 1.6 to 1 | 1.0 to 1 | 0.9 to 1 |
| NET POSITION TREND: | |||
| – Strength Index Score (3 Year Range Pct): | 46.3 | 54.1 | 43.7 |
| – Strength Index Reading (3 Year Range): | Bearish | Bullish | Bearish |
| NET POSITION MOVEMENT INDEX: | |||
| – 6-Week Change in Strength Index: | 1.9 | -2.8 | 19.2 |
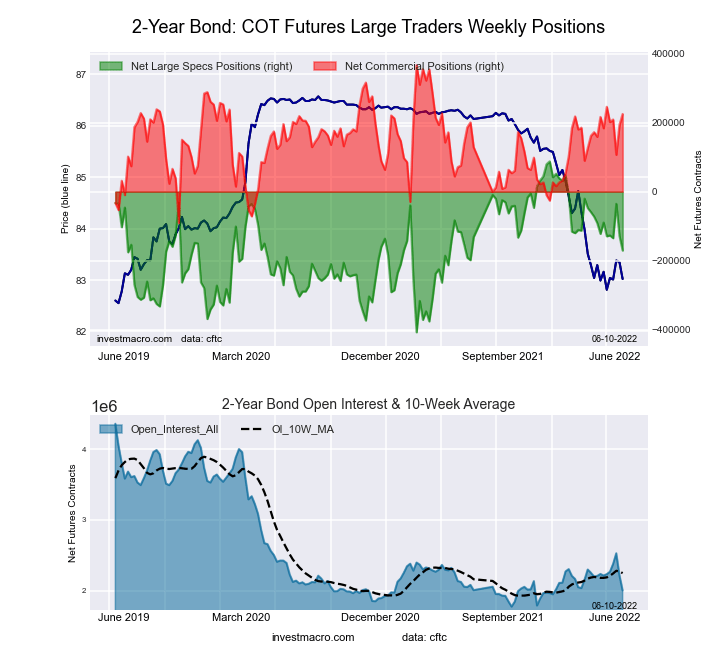
This week’s current strength score (the trader positioning range over the past three years, measured from 0 to 100) shows the speculators are currently Bearish with a score of 47.8 percent. The commercials are Bullish with a score of 69.1 percent and the small traders (not shown in chart) are Bearish with a score of 25.8 percent.
| 2-Year Treasury Note Statistics | SPECULATORS | COMMERCIALS | SMALL TRADERS |
| – Percent of Open Interest Longs: | 10.0 | 79.8 | 7.2 |
| – Percent of Open Interest Shorts: | 18.5 | 68.6 | 9.9 |
| – Net Position: | -170,489 | 225,040 | -54,551 |
| – Gross Longs: | 200,307 | 1,598,627 | 143,536 |
| – Gross Shorts: | 370,796 | 1,373,587 | 198,087 |
| – Long to Short Ratio: | 0.5 to 1 | 1.2 to 1 | 0.7 to 1 |
| NET POSITION TREND: | |||
| – Strength Index Score (3 Year Range Pct): | 47.8 | 69.1 | 25.8 |
| – Strength Index Reading (3 Year Range): | Bearish | Bullish | Bearish |
| NET POSITION MOVEMENT INDEX: | |||
| – 6-Week Change in Strength Index: | -16.4 | 9.0 | 16.5 |
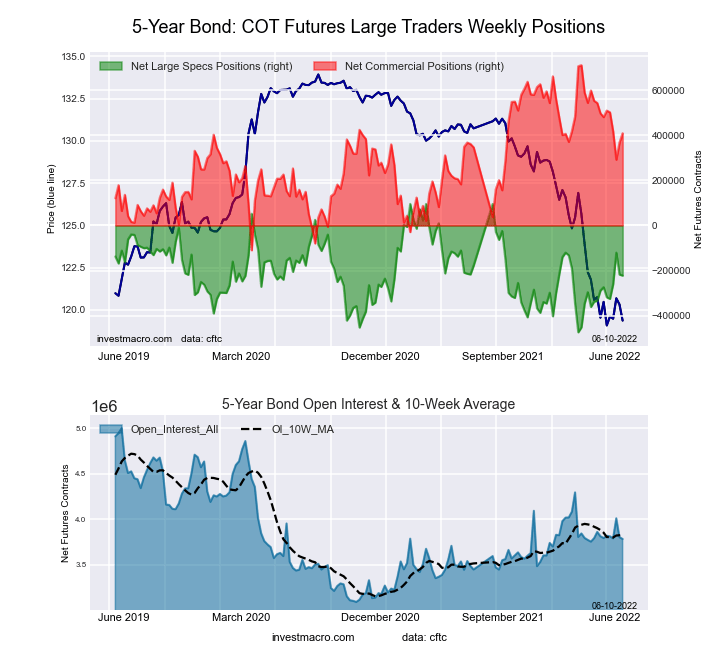
This week’s current strength score (the trader positioning range over the past three years, measured from 0 to 100) shows the speculators are currently Bearish with a score of 44.2 percent. The commercials are Bullish with a score of 63.2 percent and the small traders (not shown in chart) are Bearish with a score of 29.7 percent.
| 5-Year Treasury Note Statistics | SPECULATORS | COMMERCIALS | SMALL TRADERS |
| – Percent of Open Interest Longs: | 9.5 | 80.9 | 7.5 |
| – Percent of Open Interest Shorts: | 15.4 | 70.1 | 12.4 |
| – Net Position: | -222,547 | 409,463 | -186,916 |
| – Gross Longs: | 359,715 | 3,061,190 | 283,380 |
| – Gross Shorts: | 582,262 | 2,651,727 | 470,296 |
| – Long to Short Ratio: | 0.6 to 1 | 1.2 to 1 | 0.6 to 1 |
| NET POSITION TREND: | |||
| – Strength Index Score (3 Year Range Pct): | 44.2 | 63.2 | 29.7 |
| – Strength Index Reading (3 Year Range): | Bearish | Bullish | Bearish |
| NET POSITION MOVEMENT INDEX: | |||
| – 6-Week Change in Strength Index: | 9.1 | -8.7 | 5.5 |
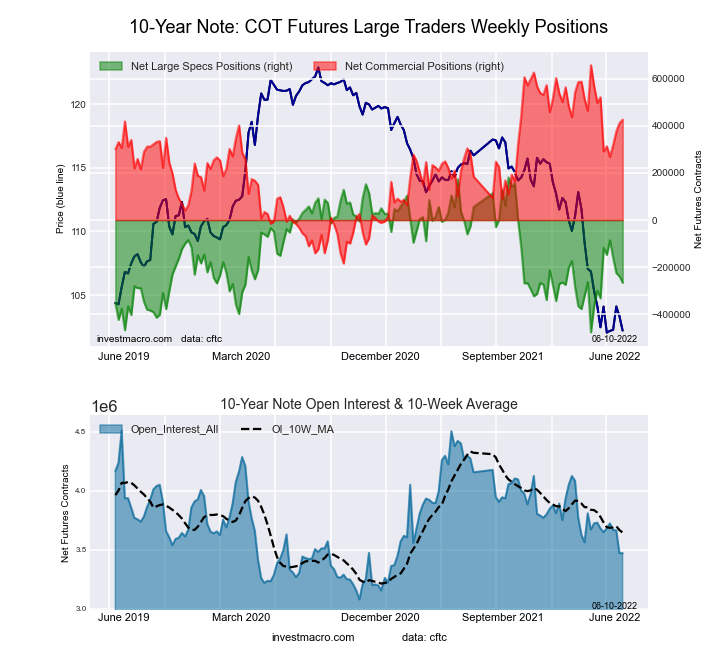
This week’s current strength score (the trader positioning range over the past three years, measured from 0 to 100) shows the speculators are currently Bearish with a score of 32.0 percent. The commercials are Bullish with a score of 72.6 percent and the small traders (not shown in chart) are Bearish with a score of 41.7 percent.
| 10-Year Treasury Note Statistics | SPECULATORS | COMMERCIALS | SMALL TRADERS |
| – Percent of Open Interest Longs: | 5.6 | 81.0 | 8.9 |
| – Percent of Open Interest Shorts: | 13.3 | 68.7 | 13.5 |
| – Net Position: | -266,187 | 426,524 | -160,337 |
| – Gross Longs: | 195,120 | 2,810,360 | 307,456 |
| – Gross Shorts: | 461,307 | 2,383,836 | 467,793 |
| – Long to Short Ratio: | 0.4 to 1 | 1.2 to 1 | 0.7 to 1 |
| NET POSITION TREND: | |||
| – Strength Index Score (3 Year Range Pct): | 32.0 | 72.6 | 41.7 |
| – Strength Index Reading (3 Year Range): | Bearish | Bullish | Bearish |
| NET POSITION MOVEMENT INDEX: | |||
| – 6-Week Change in Strength Index: | -22.6 | 16.1 | 3.1 |
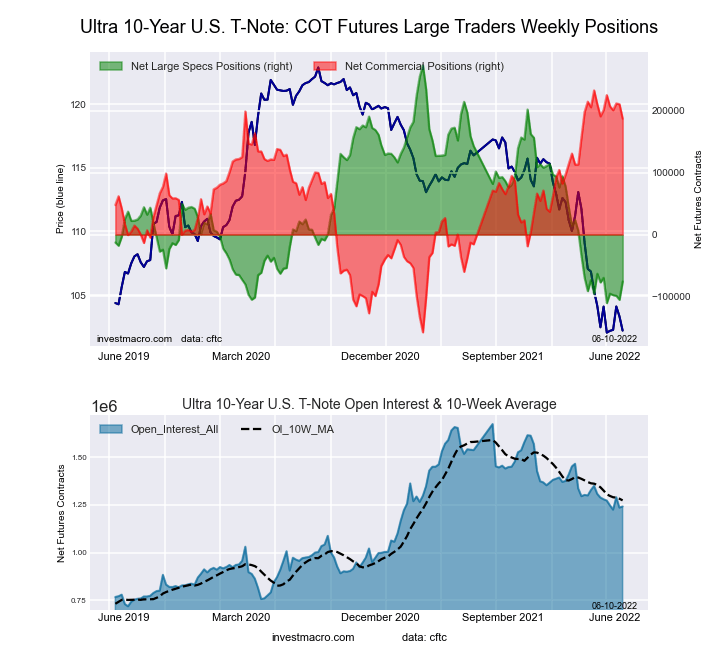
This week’s current strength score (the trader positioning range over the past three years, measured from 0 to 100) shows the speculators are currently Bearish-Extreme with a score of 9.1 percent. The commercials are Bullish-Extreme with a score of 88.3 percent and the small traders (not shown in chart) are Bearish with a score of 48.9 percent.
| Ultra 10-Year Notes Statistics | SPECULATORS | COMMERCIALS | SMALL TRADERS |
| – Percent of Open Interest Longs: | 5.5 | 81.8 | 11.1 |
| – Percent of Open Interest Shorts: | 11.6 | 66.7 | 20.0 |
| – Net Position: | -75,834 | 187,134 | -111,300 |
| – Gross Longs: | 67,884 | 1,015,640 | 137,608 |
| – Gross Shorts: | 143,718 | 828,506 | 248,908 |
| – Long to Short Ratio: | 0.5 to 1 | 1.2 to 1 | 0.6 to 1 |
| NET POSITION TREND: | |||
| – Strength Index Score (3 Year Range Pct): | 9.1 | 88.3 | 48.9 |
| – Strength Index Reading (3 Year Range): | Bearish-Extreme | Bullish-Extreme | Bearish |
| NET POSITION MOVEMENT INDEX: | |||
| – 6-Week Change in Strength Index: | -1.5 | -3.6 | 12.2 |
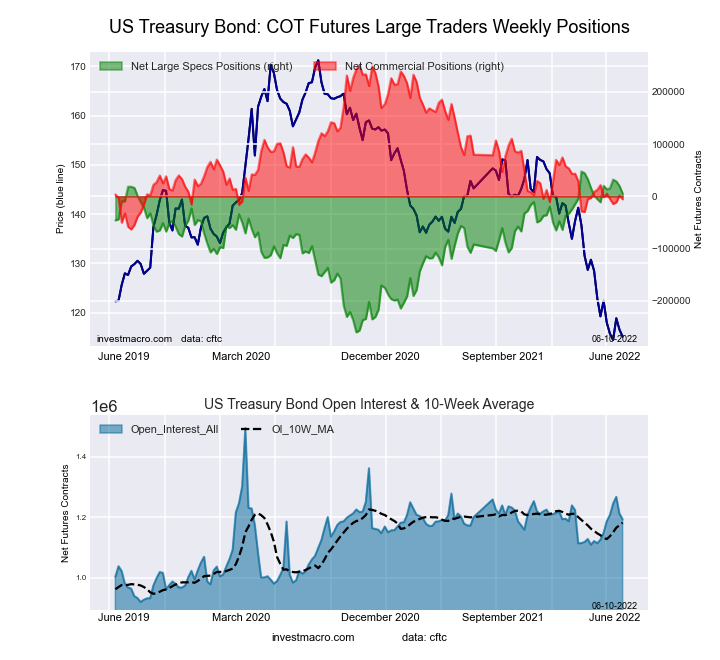
This week’s current strength score (the trader positioning range over the past three years, measured from 0 to 100) shows the speculators are currently Bullish-Extreme with a score of 86.2 percent. The commercials are Bearish-Extreme with a score of 18.3 percent and the small traders (not shown in chart) are Bullish with a score of 53.1 percent.
| US Treasury Bonds Statistics | SPECULATORS | COMMERCIALS | SMALL TRADERS |
| – Percent of Open Interest Longs: | 9.5 | 74.8 | 14.1 |
| – Percent of Open Interest Shorts: | 9.0 | 75.2 | 14.0 |
| – Net Position: | 4,963 | -5,633 | 670 |
| – Gross Longs: | 112,838 | 892,073 | 168,164 |
| – Gross Shorts: | 107,875 | 897,706 | 167,494 |
| – Long to Short Ratio: | 1.0 to 1 | 1.0 to 1 | 1.0 to 1 |
| NET POSITION TREND: | |||
| – Strength Index Score (3 Year Range Pct): | 86.2 | 18.3 | 53.1 |
| – Strength Index Reading (3 Year Range): | Bullish-Extreme | Bearish-Extreme | Bullish |
| NET POSITION MOVEMENT INDEX: | |||
| – 6-Week Change in Strength Index: | -4.9 | -1.2 | 15.1 |
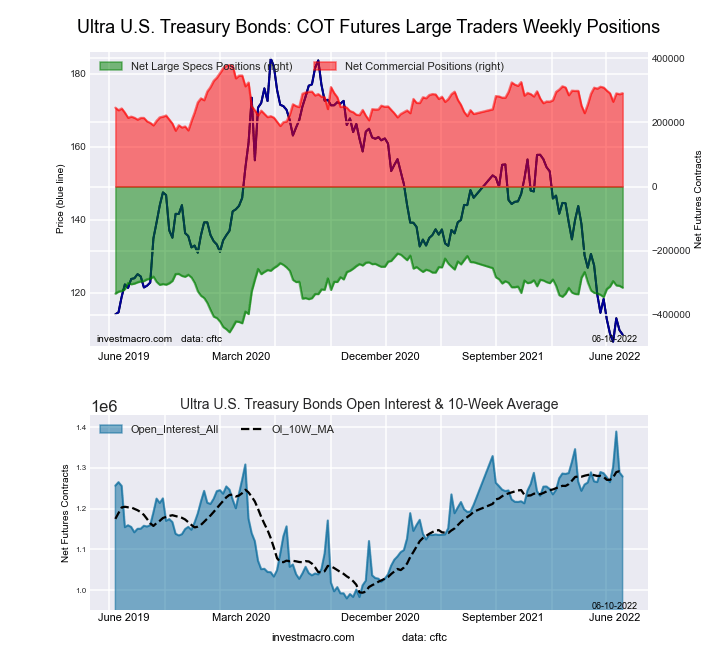
This week’s current strength score (the trader positioning range over the past three years, measured from 0 to 100) shows the speculators are currently Bullish with a score of 56.7 percent. The commercials are Bullish with a score of 57.2 percent and the small traders (not shown in chart) are Bearish with a score of 45.6 percent.
| Ultra US Treasury Bonds Statistics | SPECULATORS | COMMERCIALS | SMALL TRADERS |
| – Percent of Open Interest Longs: | 3.4 | 83.5 | 11.7 |
| – Percent of Open Interest Shorts: | 28.0 | 60.7 | 9.8 |
| – Net Position: | -314,973 | 290,771 | 24,202 |
| – Gross Longs: | 42,957 | 1,067,607 | 149,154 |
| – Gross Shorts: | 357,930 | 776,836 | 124,952 |
| – Long to Short Ratio: | 0.1 to 1 | 1.4 to 1 | 1.2 to 1 |
| NET POSITION TREND: | |||
| – Strength Index Score (3 Year Range Pct): | 56.7 | 57.2 | 45.6 |
| – Strength Index Reading (3 Year Range): | Bullish | Bullish | Bearish |
| NET POSITION MOVEMENT INDEX: | |||
| – 6-Week Change in Strength Index: | 11.9 | -8.7 | -8.2 |
Article By InvestMacro – Receive our weekly COT Reports by Email
*COT Report: The COT data, released weekly to the public each Friday, is updated through the most recent Tuesday (data is 3 days old) and shows a quick view of how large speculators or non-commercials (for-profit traders) were positioned in the futures markets.
The CFTC categorizes trader positions according to commercial hedgers (traders who use futures contracts for hedging as part of the business), non-commercials (large traders who speculate to realize trading profits) and nonreportable traders (usually small traders/speculators) as well as their open interest (contracts open in the market at time of reporting).See CFTC criteria here.
By JustMarkets The US stock indices started the week on a downbeat note. By the…
By Analytical Department RoboForex GBP/USD fell to 1.3437 on Tuesday as investors assessed the appointment…
By JustMarkets The US stock indices ended Friday’s session in the red. By the end…
By Analytical Department RoboForex USD/JPY opens the week at 162.36 on Monday. The Japanese yen…
By InvestMacro Here are the latest charts and statistics for the Commitment of Traders (COT)…
By InvestMacro The latest update for the weekly Commitment of Traders (COT) report was released…
This website uses cookies.