By InvestMacro | COT | Data Tables | COT Leaders | Downloads | COT Newsletter
Here are the latest charts and statistics for the Commitment of Traders (COT) data published by the Commodities Futures Trading Commission (CFTC).
The latest COT data is updated through Tuesday May 10th and shows a quick view of how large traders (for-profit speculators and commercial entities) were positioned in the futures markets.
Soft commodities speculator bets cooled off this week with nine out of the eleven markets we cover showing a decrease in their positioning. Soft commodities markets have been red hot this year with the war in Ukraine causing food disruptions, general production problems, food protectionism and, of course, with inflation rising throughout the world.
Overall, the soft commodities that saw higher bets this week were just Soybean Oil (3,305 contracts) and Wheat (1,674 contracts).
Meanwhile, the soft commodities that saw lower speculator bets on the week were Corn (-30,957 contracts), Sugar (-14,407 contracts), Coffee (-8,142 contracts), Soybeans (-15,794 contracts), Soybean Meal (-15,429 contracts), Live Cattle (-7,233 contracts), Lean Hogs (-5,671 contracts), Cotton (-1,674 contracts) and Cocoa (-15,513 contracts).
Free Reports:
| May-10-2022 | OI | OI-Index | Spec-Net | Spec-Index | Com-Net | COM-Index | Smalls-Net | Smalls-Index |
|---|---|---|---|---|---|---|---|---|
| WTI Crude | 1,736,594 | 0 | 310,803 | 2 | -354,479 | 98 | 43,676 | 77 |
| Gold | 571,447 | 34 | 193,315 | 40 | -227,756 | 57 | 34,441 | 57 |
| Silver | 142,752 | 9 | 19,082 | 41 | -30,519 | 69 | 11,437 | 9 |
| Copper | 184,502 | 15 | -22,626 | 26 | 19,249 | 73 | 3,377 | 45 |
| Palladium | 8,832 | 11 | -3,245 | 3 | 3,434 | 96 | -189 | 33 |
| Platinum | 66,064 | 32 | 1,363 | 5 | -5,373 | 98 | 4,010 | 18 |
| Natural Gas | 1,108,451 | 6 | -112,529 | 45 | 64,006 | 51 | 48,523 | 100 |
| Brent | 173,911 | 19 | -31,215 | 59 | 30,562 | 44 | 653 | 18 |
| Heating Oil | 349,618 | 31 | 6,455 | 52 | -32,434 | 37 | 25,979 | 88 |
| Soybeans | 694,454 | 20 | 174,608 | 72 | -147,698 | 33 | -26,910 | 26 |
| Corn | 1,510,783 | 23 | 470,908 | 90 | -415,345 | 13 | -55,563 | 11 |
| Coffee | 212,659 | 5 | 32,555 | 69 | -33,559 | 37 | 1,004 | 0 |
| Sugar | 797,453 | 0 | 187,185 | 75 | -220,611 | 26 | 33,426 | 49 |
| Wheat | 308,326 | 0 | 21,686 | 48 | -17,779 | 34 | -3,907 | 92 |
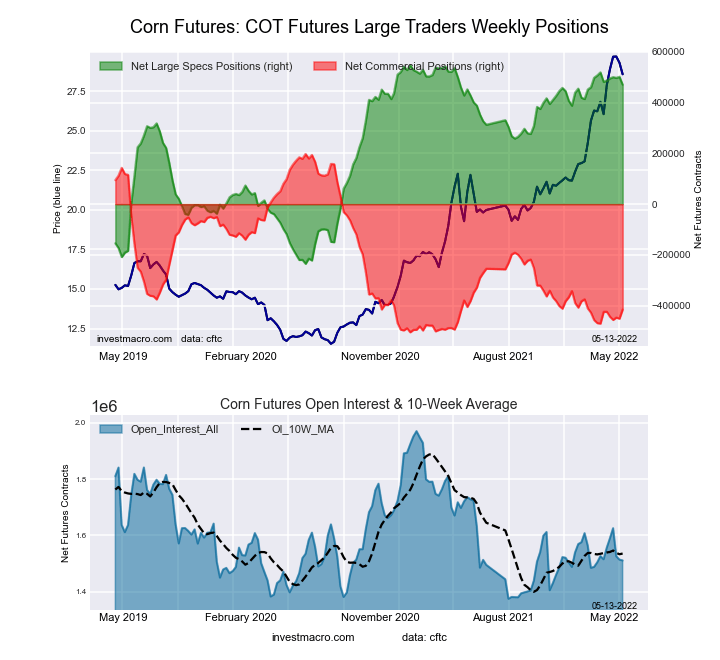
This week’s current strength score (the trader positioning range over the past three years, measured from 0 to 100) shows the speculators are currently Bullish-Extreme with a score of 90.2 percent. The commercials are Bearish-Extreme with a score of 12.8 percent and the small traders (not shown in chart) are Bearish-Extreme with a score of 11.1 percent.
| CORN Futures Statistics | SPECULATORS | COMMERCIALS | SMALL TRADERS |
| – Percent of Open Interest Longs: | 37.9 | 42.7 | 8.9 |
| – Percent of Open Interest Shorts: | 6.8 | 70.2 | 12.6 |
| – Net Position: | 470,908 | -415,345 | -55,563 |
| – Gross Longs: | 573,327 | 644,830 | 134,903 |
| – Gross Shorts: | 102,419 | 1,060,175 | 190,466 |
| – Long to Short Ratio: | 5.6 to 1 | 0.6 to 1 | 0.7 to 1 |
| NET POSITION TREND: | |||
| – Strength Index Score (3 Year Range Pct): | 90.2 | 12.8 | 11.1 |
| – Strength Index Reading (3 Year Range): | Bullish-Extreme | Bearish-Extreme | Bearish-Extreme |
| NET POSITION MOVEMENT INDEX: | |||
| – 6-Week Change in Strength Index: | -1.4 | 1.3 | 1.1 |
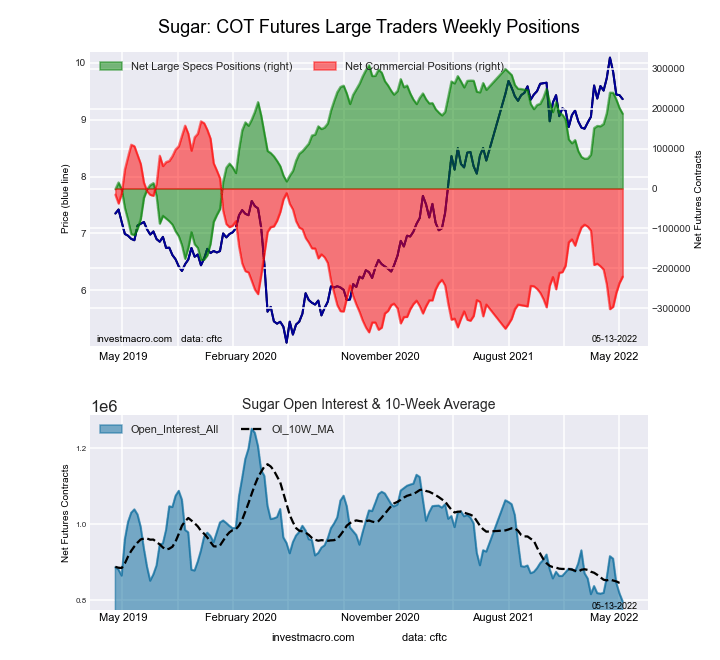
This week’s current strength score (the trader positioning range over the past three years, measured from 0 to 100) shows the speculators are currently Bullish with a score of 75.1 percent. The commercials are Bearish with a score of 26.3 percent and the small traders (not shown in chart) are Bearish with a score of 49.2 percent.
| SUGAR Futures Statistics | SPECULATORS | COMMERCIALS | SMALL TRADERS |
| – Percent of Open Interest Longs: | 31.5 | 45.8 | 10.8 |
| – Percent of Open Interest Shorts: | 8.0 | 73.5 | 6.6 |
| – Net Position: | 187,185 | -220,611 | 33,426 |
| – Gross Longs: | 251,330 | 365,263 | 86,129 |
| – Gross Shorts: | 64,145 | 585,874 | 52,703 |
| – Long to Short Ratio: | 3.9 to 1 | 0.6 to 1 | 1.6 to 1 |
| NET POSITION TREND: | |||
| – Strength Index Score (3 Year Range Pct): | 75.1 | 26.3 | 49.2 |
| – Strength Index Reading (3 Year Range): | Bullish | Bearish | Bearish |
| NET POSITION MOVEMENT INDEX: | |||
| – 6-Week Change in Strength Index: | 5.3 | -3.4 | -9.6 |
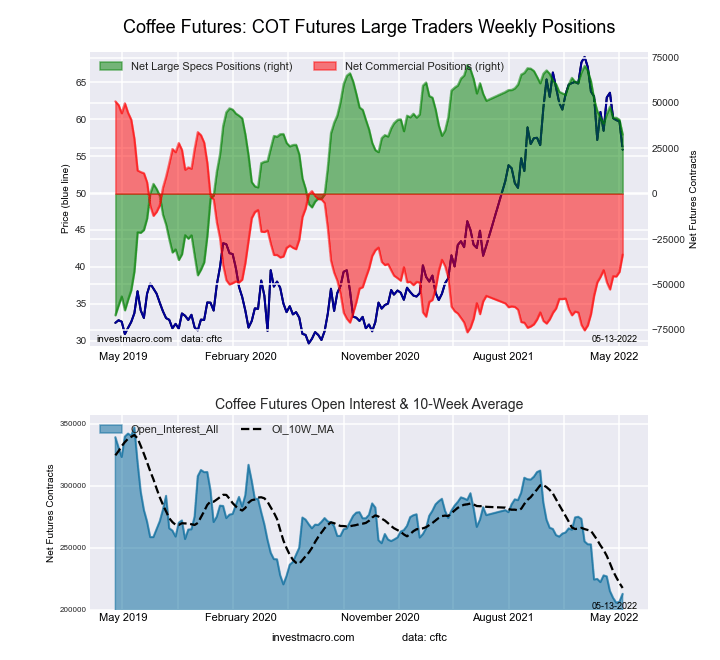
This week’s current strength score (the trader positioning range over the past three years, measured from 0 to 100) shows the speculators are currently Bullish with a score of 69.2 percent. The commercials are Bearish with a score of 36.5 percent and the small traders (not shown in chart) are Bearish-Extreme with a score of 0.0 percent.
| COFFEE Futures Statistics | SPECULATORS | COMMERCIALS | SMALL TRADERS |
| – Percent of Open Interest Longs: | 23.8 | 56.1 | 3.6 |
| – Percent of Open Interest Shorts: | 8.5 | 71.9 | 3.1 |
| – Net Position: | 32,555 | -33,559 | 1,004 |
| – Gross Longs: | 50,564 | 119,399 | 7,690 |
| – Gross Shorts: | 18,009 | 152,958 | 6,686 |
| – Long to Short Ratio: | 2.8 to 1 | 0.8 to 1 | 1.2 to 1 |
| NET POSITION TREND: | |||
| – Strength Index Score (3 Year Range Pct): | 69.2 | 36.5 | 0.0 |
| – Strength Index Reading (3 Year Range): | Bullish | Bearish | Bearish-Extreme |
| NET POSITION MOVEMENT INDEX: | |||
| – 6-Week Change in Strength Index: | -4.9 | 7.3 | -20.9 |
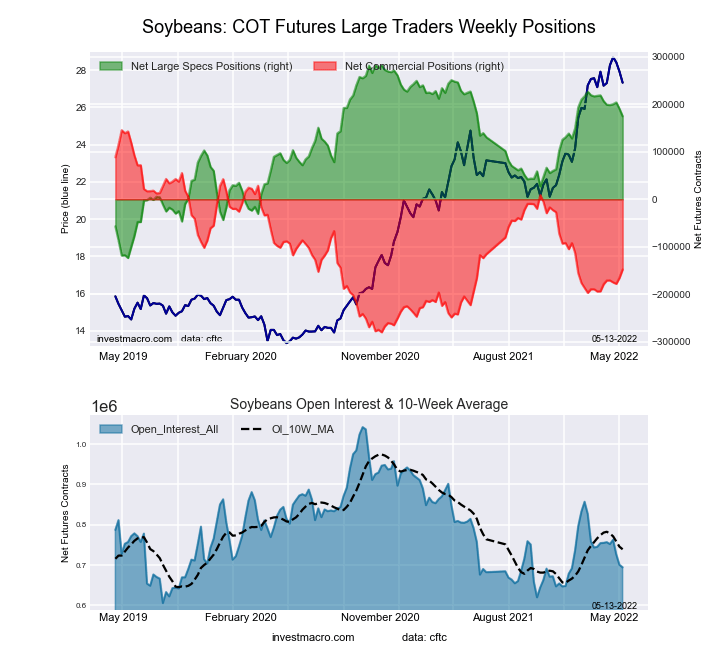
This week’s current strength score (the trader positioning range over the past three years, measured from 0 to 100) shows the speculators are currently Bullish with a score of 71.9 percent. The commercials are Bearish with a score of 33.1 percent and the small traders (not shown in chart) are Bearish with a score of 25.6 percent.
| SOYBEANS Futures Statistics | SPECULATORS | COMMERCIALS | SMALL TRADERS |
| – Percent of Open Interest Longs: | 32.4 | 48.2 | 7.1 |
| – Percent of Open Interest Shorts: | 7.3 | 69.5 | 11.0 |
| – Net Position: | 174,608 | -147,698 | -26,910 |
| – Gross Longs: | 225,260 | 334,792 | 49,376 |
| – Gross Shorts: | 50,652 | 482,490 | 76,286 |
| – Long to Short Ratio: | 4.4 to 1 | 0.7 to 1 | 0.6 to 1 |
| NET POSITION TREND: | |||
| – Strength Index Score (3 Year Range Pct): | 71.9 | 33.1 | 25.6 |
| – Strength Index Reading (3 Year Range): | Bullish | Bearish | Bearish |
| NET POSITION MOVEMENT INDEX: | |||
| – 6-Week Change in Strength Index: | -8.3 | 7.8 | 1.3 |
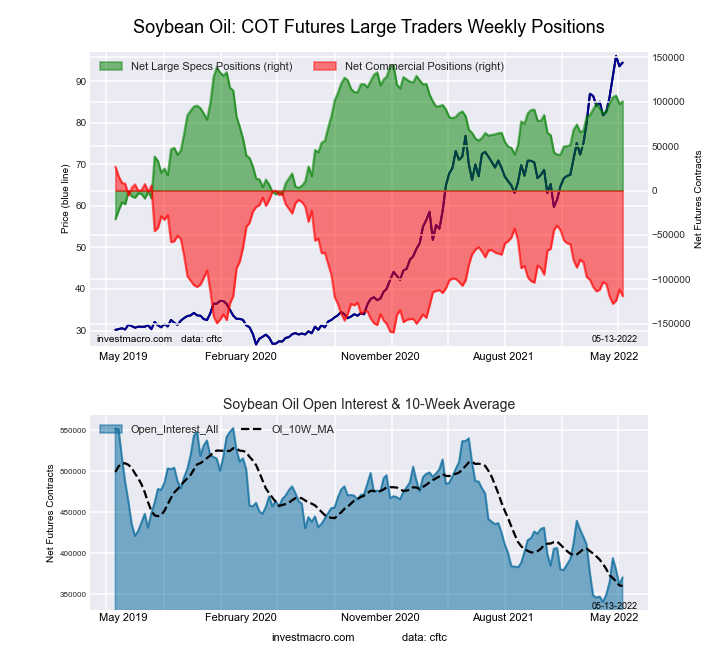
This week’s current strength score (the trader positioning range over the past three years, measured from 0 to 100) shows the speculators are currently Bullish with a score of 76.6 percent. The commercials are Bearish with a score of 21.8 percent and the small traders (not shown in chart) are Bullish-Extreme with a score of 81.5 percent.
| SOYBEAN OIL Futures Statistics | SPECULATORS | COMMERCIALS | SMALL TRADERS |
| – Percent of Open Interest Longs: | 32.0 | 45.8 | 9.9 |
| – Percent of Open Interest Shorts: | 4.8 | 77.9 | 5.0 |
| – Net Position: | 100,596 | -118,831 | 18,235 |
| – Gross Longs: | 118,463 | 169,761 | 36,820 |
| – Gross Shorts: | 17,867 | 288,592 | 18,585 |
| – Long to Short Ratio: | 6.6 to 1 | 0.6 to 1 | 2.0 to 1 |
| NET POSITION TREND: | |||
| – Strength Index Score (3 Year Range Pct): | 76.6 | 21.8 | 81.5 |
| – Strength Index Reading (3 Year Range): | Bullish | Bearish | Bullish-Extreme |
| NET POSITION MOVEMENT INDEX: | |||
| – 6-Week Change in Strength Index: | 7.7 | -8.6 | 10.0 |
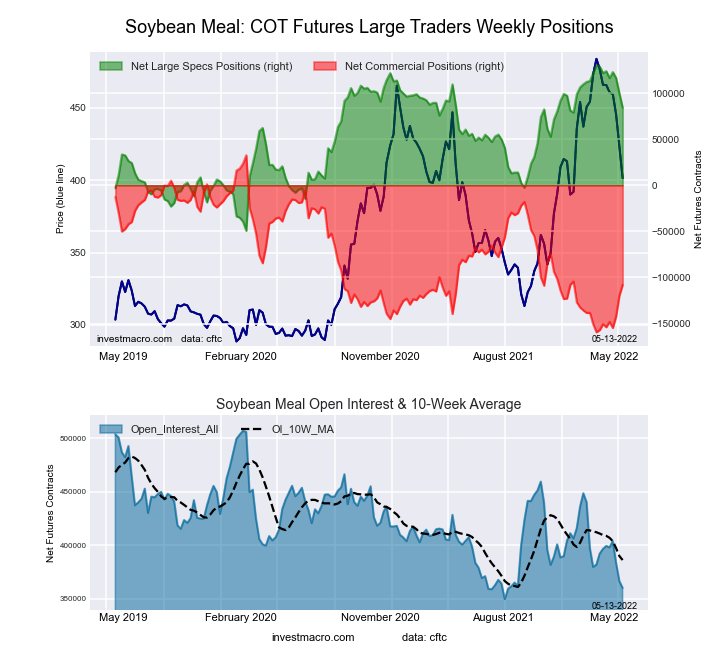
This week’s current strength score (the trader positioning range over the past three years, measured from 0 to 100) shows the speculators are currently Bullish with a score of 74.3 percent. The commercials are Bearish with a score of 26.8 percent and the small traders (not shown in chart) are Bullish with a score of 57.5 percent.
| SOYBEAN MEAL Futures Statistics | SPECULATORS | COMMERCIALS | SMALL TRADERS |
| – Percent of Open Interest Longs: | 30.7 | 47.1 | 12.5 |
| – Percent of Open Interest Shorts: | 7.4 | 77.1 | 5.9 |
| – Net Position: | 84,132 | -108,059 | 23,927 |
| – Gross Longs: | 110,648 | 169,583 | 45,065 |
| – Gross Shorts: | 26,516 | 277,642 | 21,138 |
| – Long to Short Ratio: | 4.2 to 1 | 0.6 to 1 | 2.1 to 1 |
| NET POSITION TREND: | |||
| – Strength Index Score (3 Year Range Pct): | 74.3 | 26.8 | 57.5 |
| – Strength Index Reading (3 Year Range): | Bullish | Bearish | Bullish |
| NET POSITION MOVEMENT INDEX: | |||
| – 6-Week Change in Strength Index: | -21.0 | 22.2 | -25.5 |
The LIVE CATTLE large speculator standing this week totaled a net position of 39,803 contracts in the data reported through Tuesday. This was a weekly fall of -7,233 contracts from the previous week which had a total of 47,036 net contracts.
This week’s current strength score (the trader positioning range over the past three years, measured from 0 to 100) shows the speculators are currently Bearish with a score of 26.5 percent. The commercials are Bullish with a score of 66.7 percent and the small traders (not shown in chart) are Bullish with a score of 67.9 percent.
| LIVE CATTLE Futures Statistics | SPECULATORS | COMMERCIALS | SMALL TRADERS |
| – Percent of Open Interest Longs: | 36.0 | 38.1 | 10.8 |
| – Percent of Open Interest Shorts: | 23.1 | 49.7 | 12.1 |
| – Net Position: | 39,803 | -35,783 | -4,020 |
| – Gross Longs: | 111,188 | 117,509 | 33,291 |
| – Gross Shorts: | 71,385 | 153,292 | 37,311 |
| – Long to Short Ratio: | 1.6 to 1 | 0.8 to 1 | 0.9 to 1 |
| NET POSITION TREND: | |||
| – Strength Index Score (3 Year Range Pct): | 26.5 | 66.7 | 67.9 |
| – Strength Index Reading (3 Year Range): | Bearish | Bullish | Bullish |
| NET POSITION MOVEMENT INDEX: | |||
| – 6-Week Change in Strength Index: | -14.7 | 8.4 | 22.1 |
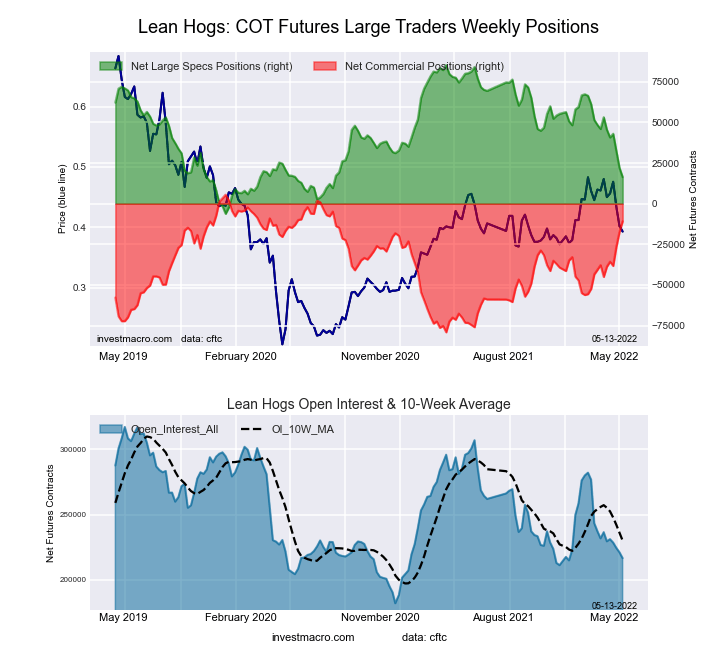
This week’s current strength score (the trader positioning range over the past three years, measured from 0 to 100) shows the speculators are currently Bearish with a score of 24.6 percent. The commercials are Bullish-Extreme with a score of 80.7 percent and the small traders (not shown in chart) are Bullish with a score of 67.8 percent.
| LEAN HOGS Futures Statistics | SPECULATORS | COMMERCIALS | SMALL TRADERS |
| – Percent of Open Interest Longs: | 30.7 | 38.0 | 10.2 |
| – Percent of Open Interest Shorts: | 23.1 | 43.0 | 12.8 |
| – Net Position: | 16,360 | -10,817 | -5,543 |
| – Gross Longs: | 66,483 | 82,353 | 22,102 |
| – Gross Shorts: | 50,123 | 93,170 | 27,645 |
| – Long to Short Ratio: | 1.3 to 1 | 0.9 to 1 | 0.8 to 1 |
| NET POSITION TREND: | |||
| – Strength Index Score (3 Year Range Pct): | 24.6 | 80.7 | 67.8 |
| – Strength Index Reading (3 Year Range): | Bearish | Bullish-Extreme | Bullish |
| NET POSITION MOVEMENT INDEX: | |||
| – 6-Week Change in Strength Index: | -40.1 | 40.4 | 13.7 |
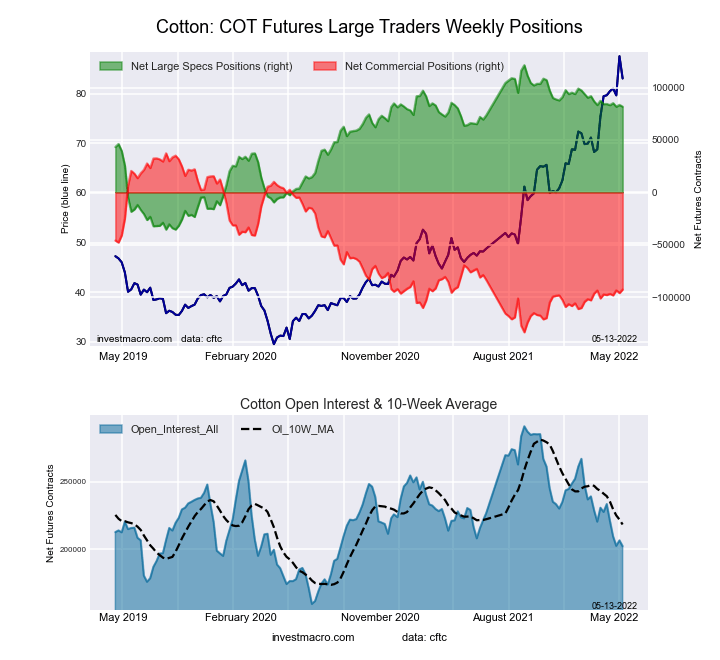
This week’s current strength score (the trader positioning range over the past three years, measured from 0 to 100) shows the speculators are currently Bullish with a score of 74.8 percent. The commercials are Bearish with a score of 23.9 percent and the small traders (not shown in chart) are Bullish-Extreme with a score of 81.2 percent.
| COTTON Futures Statistics | SPECULATORS | COMMERCIALS | SMALL TRADERS |
| – Percent of Open Interest Longs: | 46.8 | 33.8 | 8.5 |
| – Percent of Open Interest Shorts: | 6.3 | 79.6 | 3.1 |
| – Net Position: | 81,759 | -92,603 | 10,844 |
| – Gross Longs: | 94,579 | 68,251 | 17,191 |
| – Gross Shorts: | 12,820 | 160,854 | 6,347 |
| – Long to Short Ratio: | 7.4 to 1 | 0.4 to 1 | 2.7 to 1 |
| NET POSITION TREND: | |||
| – Strength Index Score (3 Year Range Pct): | 74.8 | 23.9 | 81.2 |
| – Strength Index Reading (3 Year Range): | Bullish | Bearish | Bullish-Extreme |
| NET POSITION MOVEMENT INDEX: | |||
| – 6-Week Change in Strength Index: | -1.5 | 2.7 | -14.1 |
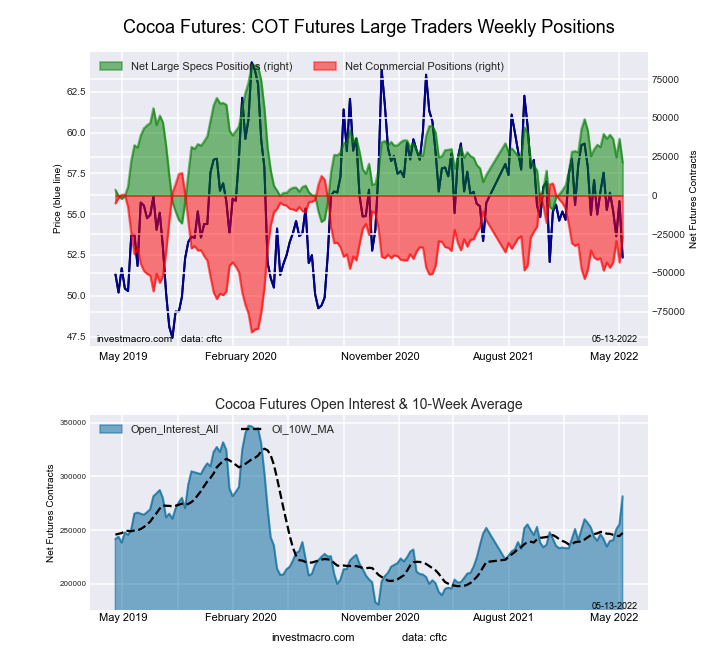
This week’s current strength score (the trader positioning range over the past three years, measured from 0 to 100) shows the speculators are currently Bearish with a score of 38.3 percent. The commercials are Bullish with a score of 59.9 percent and the small traders (not shown in chart) are Bullish with a score of 53.8 percent.
| COCOA Futures Statistics | SPECULATORS | COMMERCIALS | SMALL TRADERS |
| – Percent of Open Interest Longs: | 31.0 | 44.1 | 6.1 |
| – Percent of Open Interest Shorts: | 23.5 | 53.6 | 4.0 |
| – Net Position: | 21,046 | -26,770 | 5,724 |
| – Gross Longs: | 87,140 | 124,216 | 17,042 |
| – Gross Shorts: | 66,094 | 150,986 | 11,318 |
| – Long to Short Ratio: | 1.3 to 1 | 0.8 to 1 | 1.5 to 1 |
| NET POSITION TREND: | |||
| – Strength Index Score (3 Year Range Pct): | 38.3 | 59.9 | 53.8 |
| – Strength Index Reading (3 Year Range): | Bearish | Bullish | Bullish |
| NET POSITION MOVEMENT INDEX: | |||
| – 6-Week Change in Strength Index: | -18.3 | 21.1 | -30.6 |
The WHEAT large speculator standing this week totaled a net position of 21,686 contracts in the data reported through Tuesday. This was a weekly gain of 1,674 contracts from the previous week which had a total of 20,012 net contracts.
This week’s current strength score (the trader positioning range over the past three years, measured from 0 to 100) shows the speculators are currently Bearish with a score of 48.3 percent. The commercials are Bearish with a score of 34.4 percent and the small traders (not shown in chart) are Bullish-Extreme with a score of 92.3 percent.
| WHEAT Futures Statistics | SPECULATORS | COMMERCIALS | SMALL TRADERS |
| – Percent of Open Interest Longs: | 36.2 | 39.1 | 9.7 |
| – Percent of Open Interest Shorts: | 29.1 | 44.9 | 10.9 |
| – Net Position: | 21,686 | -17,779 | -3,907 |
| – Gross Longs: | 111,546 | 120,631 | 29,835 |
| – Gross Shorts: | 89,860 | 138,410 | 33,742 |
| – Long to Short Ratio: | 1.2 to 1 | 0.9 to 1 | 0.9 to 1 |
| NET POSITION TREND: | |||
| – Strength Index Score (3 Year Range Pct): | 48.3 | 34.4 | 92.3 |
| – Strength Index Reading (3 Year Range): | Bearish | Bearish | Bullish-Extreme |
| NET POSITION MOVEMENT INDEX: | |||
| – 6-Week Change in Strength Index: | 10.4 | -11.9 | 1.2 |
Article By InvestMacro – Receive our weekly COT Reports by Email
*COT Report: The COT data, released weekly to the public each Friday, is updated through the most recent Tuesday (data is 3 days old) and shows a quick view of how large speculators or non-commercials (for-profit traders) were positioned in the futures markets.
The CFTC categorizes trader positions according to commercial hedgers (traders who use futures contracts for hedging as part of the business), non-commercials (large traders who speculate to realize trading profits) and nonreportable traders (usually small traders/speculators) as well as their open interest (contracts open in the market at time of reporting).See CFTC criteria here.
By JustMarkets The US stock indices ended Friday’s session in the red. By the end…
By Analytical Department RoboForex USD/JPY opens the week at 162.36 on Monday. The Japanese yen…
By InvestMacro Here are the latest charts and statistics for the Commitment of Traders (COT)…
By InvestMacro The latest update for the weekly Commitment of Traders (COT) report was released…
By InvestMacro Here are the latest charts and statistics for the Commitment of Traders (COT)…
By InvestMacro Here are the latest charts and statistics for the Commitment of Traders (COT)…
This website uses cookies.