By InvestMacro | COT | Data Tables | COT Leaders | Downloads | COT Newsletter
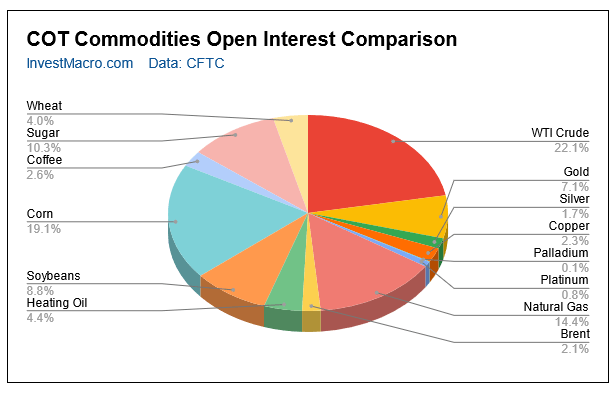
Here are the latest charts and statistics for the Commitment of Traders (COT) data published by the Commodities Futures Trading Commission (CFTC).
The latest COT data is updated through Tuesday May 3rd 2022 and shows a quick view of how large traders (for-profit speculators and commercial entities) were positioned in the futures markets.
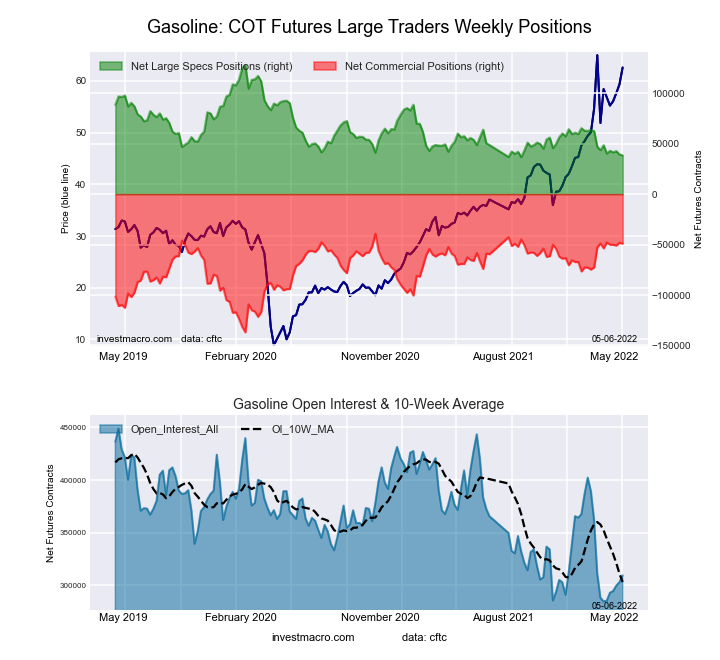
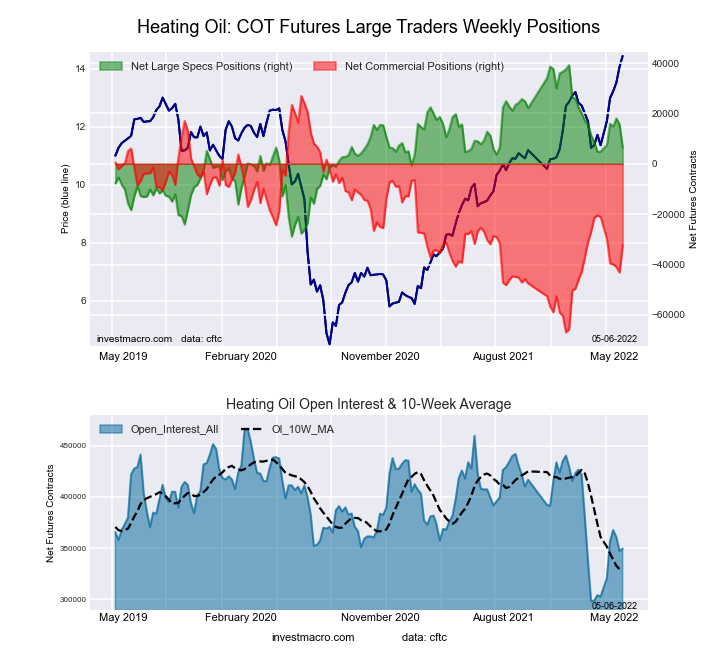
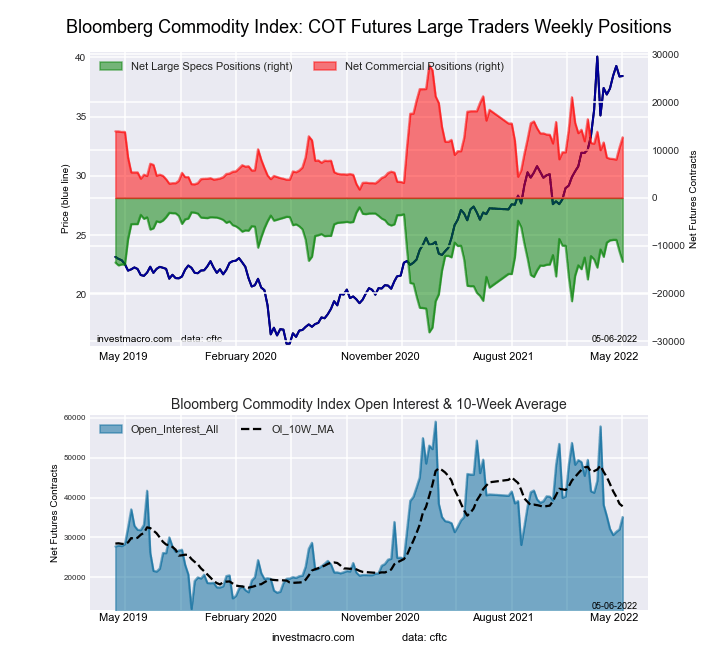
The markets with higher speculator bets this week were WTI Crude Oil (5,638 contracts) and Brent Crude Oil (11,213 contracts) while the markets with lower speculator bets this week were Natural Gas (-326 contracts), Heating Oil (-9,228 contracts), Gasoline (-860 contracts) and the Bloomberg Commodity Index (-2,138 contracts).
| May-03-2022 | OI | OI-Index | Spec-Net | Spec-Index | Com-Net | COM-Index | Smalls-Net | Smalls-Index |
|---|---|---|---|---|---|---|---|---|
| WTI Crude | 1,751,564 | 2 | 321,701 | 6 | -366,213 | 94 | 44,512 | 78 |
| Gold | 560,441 | 31 | 199,168 | 42 | -231,852 | 55 | 32,684 | 57 |
| Silver | 137,692 | 5 | 28,068 | 50 | -39,317 | 60 | 11,249 | 8 |
| Copper | 185,255 | 16 | -15,623 | 31 | 10,080 | 66 | 5,543 | 57 |
| Palladium | 7,638 | 6 | -2,752 | 6 | 2,455 | 90 | 297 | 61 |
| Platinum | 66,545 | 33 | -1,541 | 1 | -3,667 | 100 | 5,208 | 35 |
| Natural Gas | 1,138,319 | 12 | -117,706 | 43 | 72,861 | 54 | 44,845 | 92 |
| Brent | 168,128 | 14 | -27,318 | 65 | 26,014 | 37 | 1,304 | 27 |
| Heating Oil | 349,618 | 31 | 6,455 | 52 | -32,434 | 37 | 25,979 | 88 |
| Soybeans | 700,856 | 22 | 190,402 | 77 | -165,353 | 27 | -25,049 | 29 |
| Corn | 1,513,880 | 23 | 501,865 | 94 | -451,210 | 8 | -50,655 | 14 |
| Coffee | 206,337 | 1 | 40,697 | 77 | -43,007 | 28 | 2,310 | 5 |
| Sugar | 818,627 | 1 | 201,592 | 78 | -236,394 | 23 | 34,802 | 51 |
| Wheat | 319,233 | 0 | 20,012 | 60 | -14,225 | 30 | -5,787 | 82 |
Free Reports:
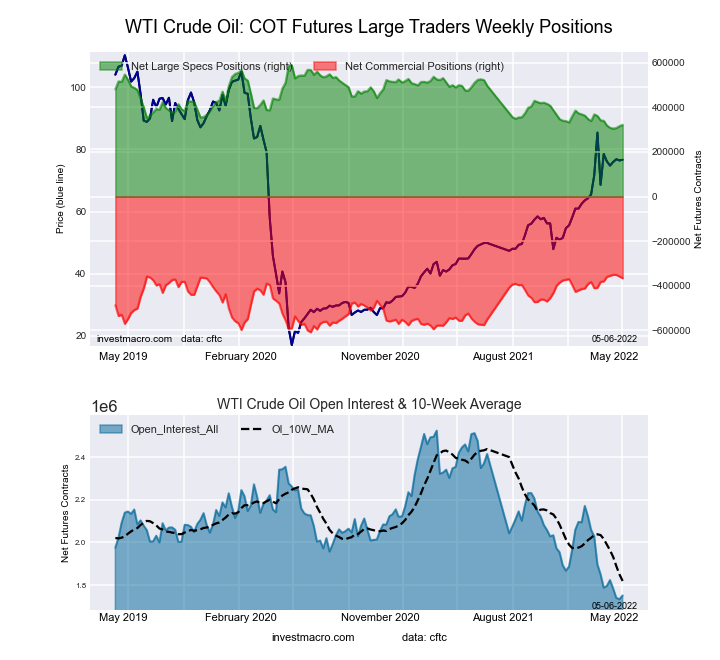
This week’s current strength score (the trader positioning range over the past three years, measured from 0 to 100) shows the speculators are currently Bearish-Extreme with a score of 5.9 percent. The commercials are Bullish-Extreme with a score of 93.9 percent and the small traders (not shown in chart) are Bullish with a score of 77.7 percent.
| WTI Crude Oil Futures Statistics | SPECULATORS | COMMERCIALS | SMALL TRADERS |
| – Percent of Open Interest Longs: | 24.0 | 35.4 | 5.2 |
| – Percent of Open Interest Shorts: | 5.6 | 56.3 | 2.6 |
| – Net Position: | 321,701 | -366,213 | 44,512 |
| – Gross Longs: | 419,692 | 620,327 | 90,371 |
| – Gross Shorts: | 97,991 | 986,540 | 45,859 |
| – Long to Short Ratio: | 4.3 to 1 | 0.6 to 1 | 2.0 to 1 |
| NET POSITION TREND: | |||
| – Strength Index Score (3 Year Range Pct): | 5.9 | 93.9 | 77.7 |
| – Strength Index Reading (3 Year Range): | Bearish-Extreme | Bullish-Extreme | Bullish |
| NET POSITION MOVEMENT INDEX: | |||
| – 6-Week Change in Strength Index: | -6.4 | 5.4 | 6.2 |
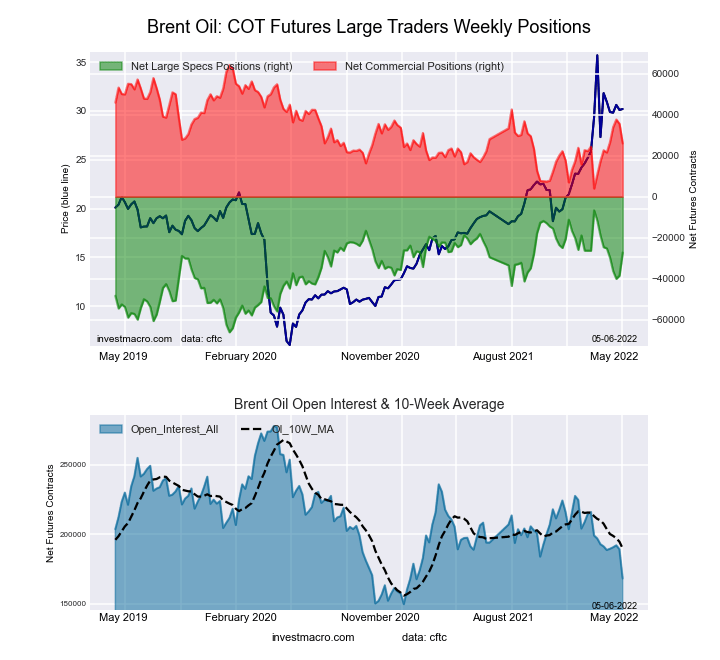
This week’s current strength score (the trader positioning range over the past three years, measured from 0 to 100) shows the speculators are currently Bullish with a score of 65.4 percent. The commercials are Bearish with a score of 36.6 percent and the small traders (not shown in chart) are Bearish with a score of 26.9 percent.
| Brent Crude Oil Futures Statistics | SPECULATORS | COMMERCIALS | SMALL TRADERS |
| – Percent of Open Interest Longs: | 20.6 | 46.7 | 4.1 |
| – Percent of Open Interest Shorts: | 36.9 | 31.2 | 3.3 |
| – Net Position: | -27,318 | 26,014 | 1,304 |
| – Gross Longs: | 34,685 | 78,491 | 6,840 |
| – Gross Shorts: | 62,003 | 52,477 | 5,536 |
| – Long to Short Ratio: | 0.6 to 1 | 1.5 to 1 | 1.2 to 1 |
| NET POSITION TREND: | |||
| – Strength Index Score (3 Year Range Pct): | 65.4 | 36.6 | 26.9 |
| – Strength Index Reading (3 Year Range): | Bullish | Bearish | Bearish |
| NET POSITION MOVEMENT INDEX: | |||
| – 6-Week Change in Strength Index: | -4.5 | 5.6 | -9.8 |
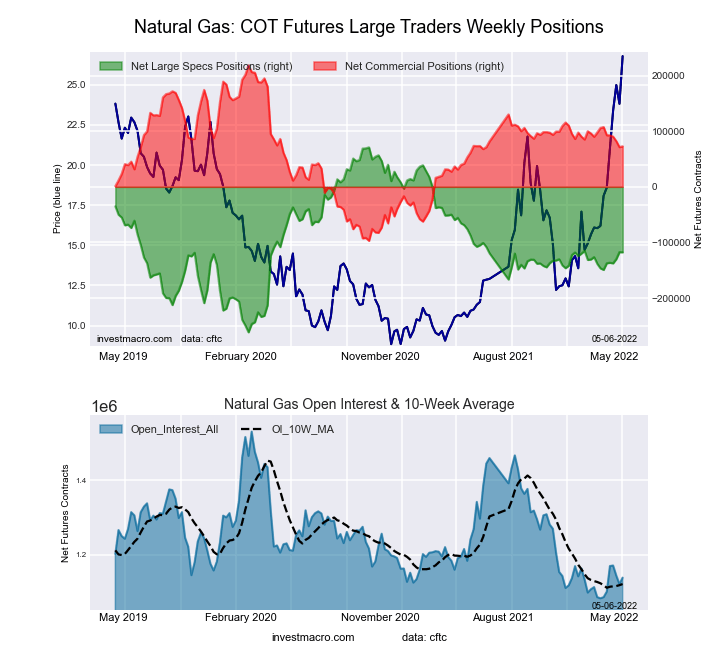
This week’s current strength score (the trader positioning range over the past three years, measured from 0 to 100) shows the speculators are currently Bearish with a score of 43.3 percent. The commercials are Bullish with a score of 53.8 percent and the small traders (not shown in chart) are Bullish-Extreme with a score of 92.3 percent.
| Natural Gas Futures Statistics | SPECULATORS | COMMERCIALS | SMALL TRADERS |
| – Percent of Open Interest Longs: | 21.7 | 38.9 | 6.4 |
| – Percent of Open Interest Shorts: | 32.0 | 32.5 | 2.5 |
| – Net Position: | -117,706 | 72,861 | 44,845 |
| – Gross Longs: | 247,092 | 442,604 | 72,900 |
| – Gross Shorts: | 364,798 | 369,743 | 28,055 |
| – Long to Short Ratio: | 0.7 to 1 | 1.2 to 1 | 2.6 to 1 |
| NET POSITION TREND: | |||
| – Strength Index Score (3 Year Range Pct): | 43.3 | 53.8 | 92.3 |
| – Strength Index Reading (3 Year Range): | Bearish | Bullish | Bullish-Extreme |
| NET POSITION MOVEMENT INDEX: | |||
| – 6-Week Change in Strength Index: | 9.5 | -11.0 | 7.5 |
This week’s current strength score (the trader positioning range over the past three years, measured from 0 to 100) shows the speculators are currently Bearish-Extreme with a score of 9.2 percent. The commercials are Bullish-Extreme with a score of 88.0 percent and the small traders (not shown in chart) are Bullish-Extreme with a score of 83.4 percent.
| Nasdaq Mini Futures Statistics | SPECULATORS | COMMERCIALS | SMALL TRADERS |
| – Percent of Open Interest Longs: | 25.5 | 52.1 | 7.3 |
| – Percent of Open Interest Shorts: | 13.1 | 68.0 | 3.9 |
| – Net Position: | 38,381 | -48,991 | 10,610 |
| – Gross Longs: | 79,017 | 161,247 | 22,690 |
| – Gross Shorts: | 40,636 | 210,238 | 12,080 |
| – Long to Short Ratio: | 1.9 to 1 | 0.8 to 1 | 1.9 to 1 |
| NET POSITION TREND: | |||
| – Strength Index Score (3 Year Range Pct): | 9.2 | 88.0 | 83.4 |
| – Strength Index Reading (3 Year Range): | Bearish-Extreme | Bullish-Extreme | Bullish-Extreme |
| NET POSITION MOVEMENT INDEX: | |||
| – 6-Week Change in Strength Index: | -10.2 | 4.7 | 35.3 |
This week’s current strength score (the trader positioning range over the past three years, measured from 0 to 100) shows the speculators are currently Bullish with a score of 51.9 percent. The commercials are Bearish with a score of 36.7 percent and the small traders (not shown in chart) are Bullish-Extreme with a score of 88.4 percent.
| Heating Oil Futures Statistics | SPECULATORS | COMMERCIALS | SMALL TRADERS |
| – Percent of Open Interest Longs: | 17.0 | 50.8 | 14.4 |
| – Percent of Open Interest Shorts: | 15.1 | 60.1 | 6.9 |
| – Net Position: | 6,455 | -32,434 | 25,979 |
| – Gross Longs: | 59,340 | 177,626 | 50,210 |
| – Gross Shorts: | 52,885 | 210,060 | 24,231 |
| – Long to Short Ratio: | 1.1 to 1 | 0.8 to 1 | 2.1 to 1 |
| NET POSITION TREND: | |||
| – Strength Index Score (3 Year Range Pct): | 51.9 | 36.7 | 88.4 |
| – Strength Index Reading (3 Year Range): | Bullish | Bearish | Bullish-Extreme |
| NET POSITION MOVEMENT INDEX: | |||
| – 6-Week Change in Strength Index: | 4.2 | -10.3 | 23.6 |
This week’s current strength score (the trader positioning range over the past three years, measured from 0 to 100) shows the speculators are currently Bullish with a score of 56.4 percent. The commercials are Bearish with a score of 42.0 percent and the small traders (not shown in chart) are Bearish with a score of 44.0 percent.
| Bloomberg Index Futures Statistics | SPECULATORS | COMMERCIALS | SMALL TRADERS |
| – Percent of Open Interest Longs: | 58.2 | 36.0 | 2.1 |
| – Percent of Open Interest Shorts: | 96.2 | 0.0 | 0.2 |
| – Net Position: | -13,354 | 12,665 | 689 |
| – Gross Longs: | 20,458 | 12,665 | 743 |
| – Gross Shorts: | 33,812 | 0 | 54 |
| – Long to Short Ratio: | 0.6 to 1 | inf to 1 | 13.8 to 1 |
| NET POSITION TREND: | |||
| – Strength Index Score (3 Year Range Pct): | 56.4 | 42.0 | 44.0 |
| – Strength Index Reading (3 Year Range): | Bullish | Bearish | Bearish |
| NET POSITION MOVEMENT INDEX: | |||
| – 6-Week Change in Strength Index: | -4.0 | 4.1 | -1.5 |
Article By InvestMacro – Receive our weekly COT Reports by Email
*COT Report: The COT data, released weekly to the public each Friday, is updated through the most recent Tuesday (data is 3 days old) and shows a quick view of how large speculators or non-commercials (for-profit traders) were positioned in the futures markets.
The CFTC categorizes trader positions according to commercial hedgers (traders who use futures contracts for hedging as part of the business), non-commercials (large traders who speculate to realize trading profits) and nonreportable traders (usually small traders/speculators) as well as their open interest (contracts open in the market at time of reporting).See CFTC criteria here.
By JustMarkets The US stock indices ended Friday’s session in the red. By the end…
By Analytical Department RoboForex USD/JPY opens the week at 162.36 on Monday. The Japanese yen…
By InvestMacro Here are the latest charts and statistics for the Commitment of Traders (COT)…
By InvestMacro The latest update for the weekly Commitment of Traders (COT) report was released…
By InvestMacro Here are the latest charts and statistics for the Commitment of Traders (COT)…
By InvestMacro Here are the latest charts and statistics for the Commitment of Traders (COT)…
This website uses cookies.