By InvestMacro | COT | Data Tables | COT Leaders | Downloads | COT Newsletter
Here are the latest charts and statistics for the Commitment of Traders (COT) data published by the Commodities Futures Trading Commission (CFTC).
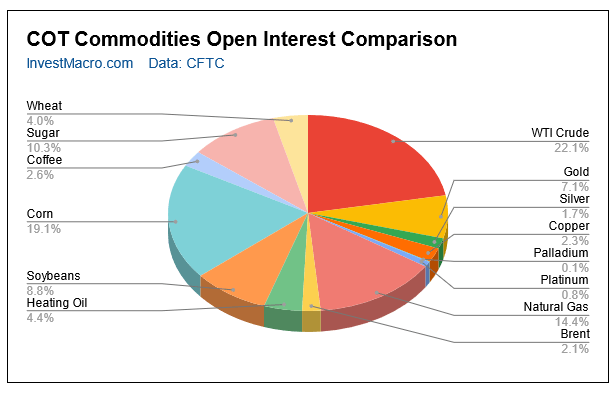
The latest COT data is updated through Tuesday May 3rd 2022 and shows a quick view of how large traders (for-profit speculators and commercial entities) were positioned in the futures markets.
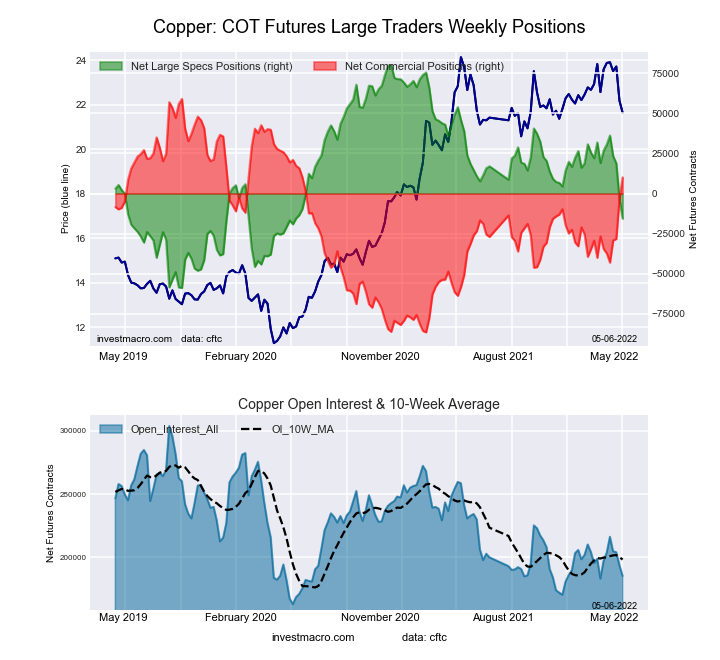
Highlighting the COT metals data is the recent decline in the Copper futures bets. The speculative net position in the Copper futures has fallen for two consecutive weeks and by a total of -19,408 contracts over that time-frame. This weakness has dropped the current standing for Copper net positions into a bearish position for a second straight week. Last week was the first time Copper has been in a bearish position since June 2nd of 2020, a span of ninety-nine weeks. This week’s further decline in speculator bets brings the current net standing (-15,623 contracts) to the lowest level in two years, dating back to May 5th of 2020.
Weighing heavily on the Copper sentiment is the shut downs in China due to Covid-19 outbreaks, particularly in Shanghai and Beijing. China is among the largest producers of Copper in the world and is the largest consumer of Copper in the world with the red metal being used in numerous manufacturing processes, industries and electronics being produced in the country. Any prolonged slowdown in China economic activity will have an outsized effect on the current demand for Copper.
Free Reports:
The Copper price has pulled back recently with declines in each of the last four weeks that has taken approximately 10 percent off the futures price. Copper has been on a torrid bullish run that started in March 2020 when the pandemic burst open globally. Since the lows in March of 2020, Copper’s price rose by over 100 percent and now currently trades around the $4.25 per pound futures level.
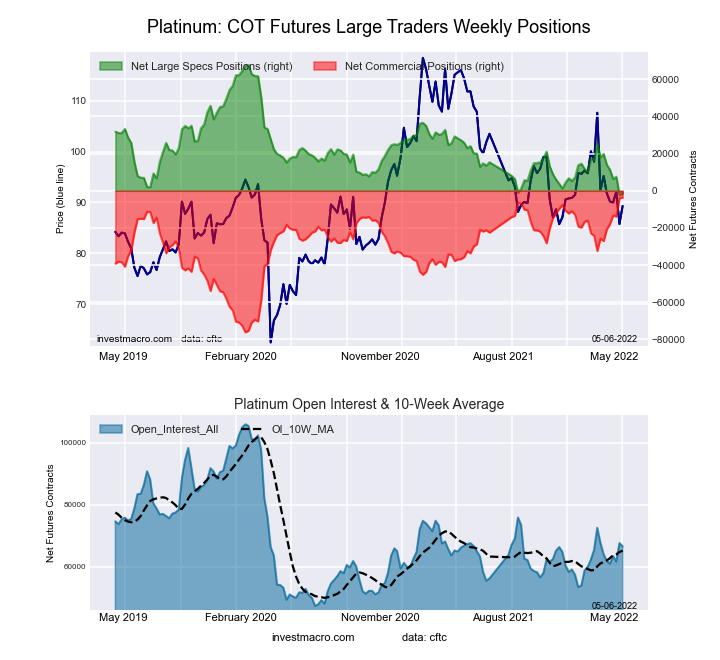
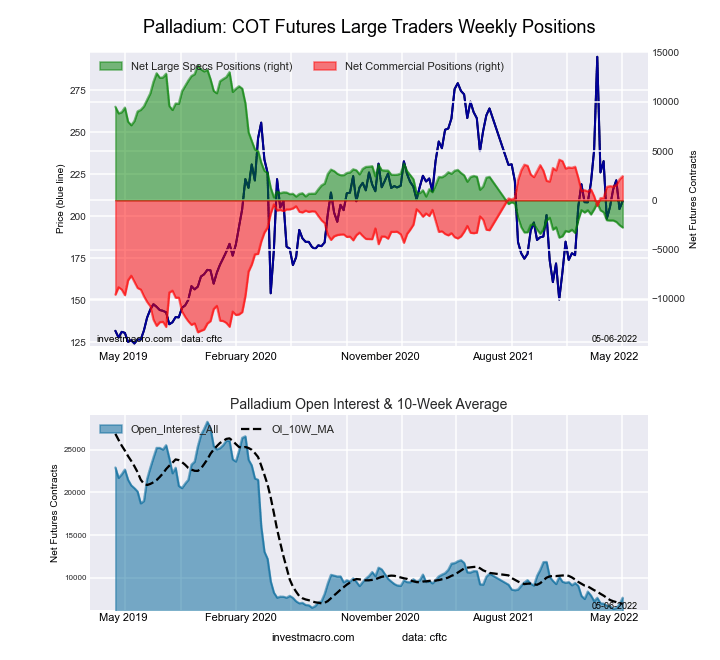
The only metals market we cover with higher speculator bets this week was Platinum (+816 contracts) while the markets with lower spec bets were Silver (-7,338 contracts), Gold (-18,856 contracts), Copper (-11,838 contracts) and Palladium (-245 contracts).
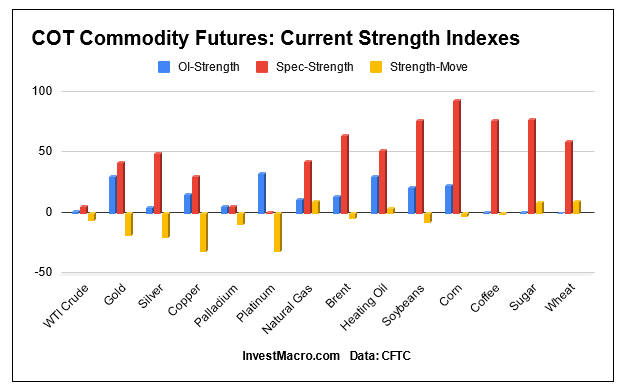
Speculator strength standings for each Commodity where strength index is current net position compared to past three years, above 80 is bullish extreme, below 20 is bearish extreme OI Strength = Current Open Interest level compared to last 3 years range Spec Strength = Current Net Speculator level compared to last 3 years range Strength Move = Six week change of Spec Strength
| May-03-2022 | OI | OI-Index | Spec-Net | Spec-Index | Com-Net | COM-Index | Smalls-Net | Smalls-Index |
|---|---|---|---|---|---|---|---|---|
| WTI Crude | 1,751,564 | 2 | 321,701 | 6 | -366,213 | 94 | 44,512 | 78 |
| Gold | 560,441 | 31 | 199,168 | 42 | -231,852 | 55 | 32,684 | 57 |
| Silver | 137,692 | 5 | 28,068 | 50 | -39,317 | 60 | 11,249 | 8 |
| Copper | 185,255 | 16 | -15,623 | 31 | 10,080 | 66 | 5,543 | 57 |
| Palladium | 7,638 | 6 | -2,752 | 6 | 2,455 | 90 | 297 | 61 |
| Platinum | 66,545 | 33 | -1,541 | 1 | -3,667 | 100 | 5,208 | 35 |
| Natural Gas | 1,138,319 | 12 | -117,706 | 43 | 72,861 | 54 | 44,845 | 92 |
| Brent | 168,128 | 14 | -27,318 | 65 | 26,014 | 37 | 1,304 | 27 |
| Heating Oil | 349,618 | 31 | 6,455 | 52 | -32,434 | 37 | 25,979 | 88 |
| Soybeans | 700,856 | 22 | 190,402 | 77 | -165,353 | 27 | -25,049 | 29 |
| Corn | 1,513,880 | 23 | 501,865 | 94 | -451,210 | 8 | -50,655 | 14 |
| Coffee | 206,337 | 1 | 40,697 | 77 | -43,007 | 28 | 2,310 | 5 |
| Sugar | 818,627 | 1 | 201,592 | 78 | -236,394 | 23 | 34,802 | 51 |
| Wheat | 319,233 | 0 | 20,012 | 60 | -14,225 | 30 | -5,787 | 82 |
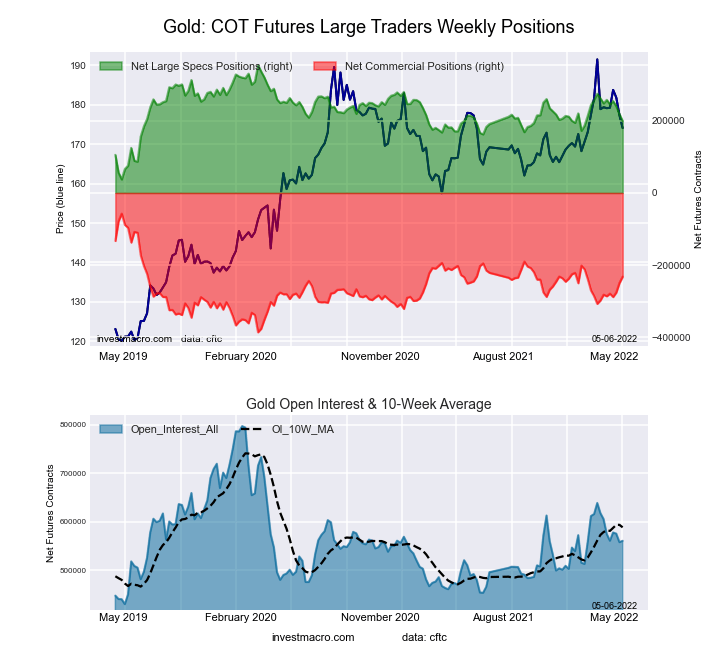
This week’s current strength score (the trader positioning range over the past three years, measured from 0 to 100) shows the speculators are currently Bearish with a score of 42.1 percent. The commercials are Bullish with a score of 55.4 percent and the small traders (not shown in chart) are Bullish with a score of 57.0 percent.
| Gold Futures Statistics | SPECULATORS | COMMERCIALS | SMALL TRADERS |
| – Percent of Open Interest Longs: | 52.4 | 23.3 | 9.1 |
| – Percent of Open Interest Shorts: | 16.8 | 64.7 | 3.3 |
| – Net Position: | 199,168 | -231,852 | 32,684 |
| – Gross Longs: | 293,439 | 130,795 | 51,270 |
| – Gross Shorts: | 94,271 | 362,647 | 18,586 |
| – Long to Short Ratio: | 3.1 to 1 | 0.4 to 1 | 2.8 to 1 |
| NET POSITION TREND: | |||
| – Strength Index Score (3 Year Range Pct): | 42.1 | 55.4 | 57.0 |
| – Strength Index Reading (3 Year Range): | Bearish | Bullish | Bullish |
| NET POSITION MOVEMENT INDEX: | |||
| – 6-Week Change in Strength Index: | -18.3 | 17.9 | -2.5 |
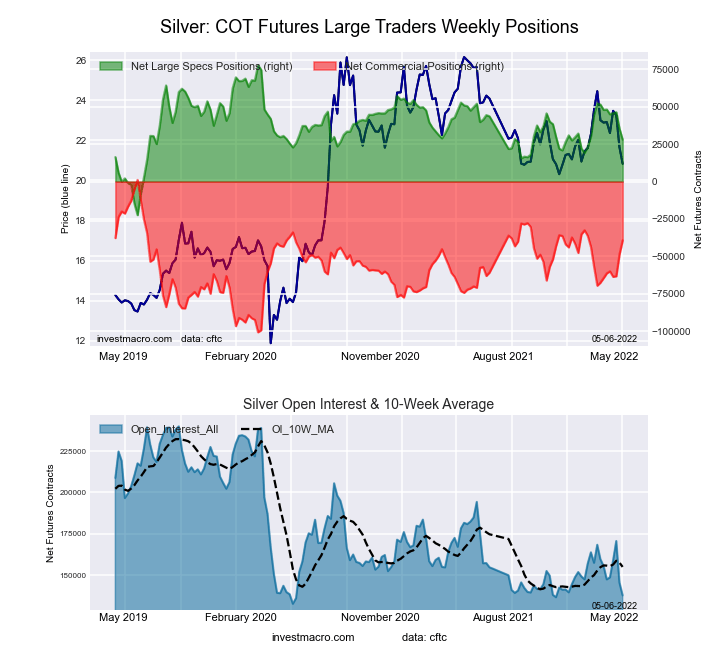
This week’s current strength score (the trader positioning range over the past three years, measured from 0 to 100) shows the speculators are currently Bullish with a score of 50.3 percent. The commercials are Bullish with a score of 60.3 percent and the small traders (not shown in chart) are Bearish-Extreme with a score of 8.4 percent.
| Silver Futures Statistics | SPECULATORS | COMMERCIALS | SMALL TRADERS |
| – Percent of Open Interest Longs: | 41.2 | 36.4 | 17.3 |
| – Percent of Open Interest Shorts: | 20.8 | 65.0 | 9.2 |
| – Net Position: | 28,068 | -39,317 | 11,249 |
| – Gross Longs: | 56,764 | 50,184 | 23,860 |
| – Gross Shorts: | 28,696 | 89,501 | 12,611 |
| – Long to Short Ratio: | 2.0 to 1 | 0.6 to 1 | 1.9 to 1 |
| NET POSITION TREND: | |||
| – Strength Index Score (3 Year Range Pct): | 50.3 | 60.3 | 8.4 |
| – Strength Index Reading (3 Year Range): | Bullish | Bullish | Bearish-Extreme |
| NET POSITION MOVEMENT INDEX: | |||
| – 6-Week Change in Strength Index: | -19.8 | 24.8 | -31.2 |
This week’s current strength score (the trader positioning range over the past three years, measured from 0 to 100) shows the speculators are currently Bearish with a score of 31.1 percent. The commercials are Bullish with a score of 66.4 percent and the small traders (not shown in chart) are Bullish with a score of 57.3 percent.
| Copper Futures Statistics | SPECULATORS | COMMERCIALS | SMALL TRADERS |
| – Percent of Open Interest Longs: | 35.4 | 46.7 | 9.7 |
| – Percent of Open Interest Shorts: | 43.8 | 41.2 | 6.7 |
| – Net Position: | -15,623 | 10,080 | 5,543 |
| – Gross Longs: | 65,590 | 86,458 | 18,009 |
| – Gross Shorts: | 81,213 | 76,378 | 12,466 |
| – Long to Short Ratio: | 0.8 to 1 | 1.1 to 1 | 1.4 to 1 |
| NET POSITION TREND: | |||
| – Strength Index Score (3 Year Range Pct): | 31.1 | 66.4 | 57.3 |
| – Strength Index Reading (3 Year Range): | Bearish | Bullish | Bullish |
| NET POSITION MOVEMENT INDEX: | |||
| – 6-Week Change in Strength Index: | -30.6 | 30.7 | -13.0 |
This week’s current strength score (the trader positioning range over the past three years, measured from 0 to 100) shows the speculators are currently Bearish-Extreme with a score of 1.2 percent. The commercials are Bullish-Extreme with a score of 100.0 percent and the small traders (not shown in chart) are Bearish with a score of 34.6 percent.
| Platinum Futures Statistics | SPECULATORS | COMMERCIALS | SMALL TRADERS |
| – Percent of Open Interest Longs: | 44.4 | 38.8 | 13.5 |
| – Percent of Open Interest Shorts: | 46.7 | 44.3 | 5.6 |
| – Net Position: | -1,541 | -3,667 | 5,208 |
| – Gross Longs: | 29,516 | 25,830 | 8,956 |
| – Gross Shorts: | 31,057 | 29,497 | 3,748 |
| – Long to Short Ratio: | 1.0 to 1 | 0.9 to 1 | 2.4 to 1 |
| NET POSITION TREND: | |||
| – Strength Index Score (3 Year Range Pct): | 1.2 | 100.0 | 34.6 |
| – Strength Index Reading (3 Year Range): | Bearish-Extreme | Bullish-Extreme | Bearish |
| NET POSITION MOVEMENT INDEX: | |||
| – 6-Week Change in Strength Index: | -30.5 | 32.3 | -28.3 |
This week’s current strength score (the trader positioning range over the past three years, measured from 0 to 100) shows the speculators are currently Bearish-Extreme with a score of 5.8 percent. The commercials are Bullish-Extreme with a score of 90.5 percent and the small traders (not shown in chart) are Bullish with a score of 61.1 percent.
| Palladium Futures Statistics | SPECULATORS | COMMERCIALS | SMALL TRADERS |
| – Percent of Open Interest Longs: | 12.7 | 59.8 | 16.9 |
| – Percent of Open Interest Shorts: | 48.8 | 27.7 | 13.0 |
| – Net Position: | -2,752 | 2,455 | 297 |
| – Gross Longs: | 973 | 4,567 | 1,290 |
| – Gross Shorts: | 3,725 | 2,112 | 993 |
| – Long to Short Ratio: | 0.3 to 1 | 2.2 to 1 | 1.3 to 1 |
| NET POSITION TREND: | |||
| – Strength Index Score (3 Year Range Pct): | 5.8 | 90.5 | 61.1 |
| – Strength Index Reading (3 Year Range): | Bearish-Extreme | Bullish-Extreme | Bullish |
| NET POSITION MOVEMENT INDEX: | |||
| – 6-Week Change in Strength Index: | -8.8 | 12.7 | -38.9 |
Article By InvestMacro – Receive our weekly COT Reports by Email
*COT Report: The COT data, released weekly to the public each Friday, is updated through the most recent Tuesday (data is 3 days old) and shows a quick view of how large speculators or non-commercials (for-profit traders) were positioned in the futures markets.
The CFTC categorizes trader positions according to commercial hedgers (traders who use futures contracts for hedging as part of the business), non-commercials (large traders who speculate to realize trading profits) and nonreportable traders (usually small traders/speculators) as well as their open interest (contracts open in the market at time of reporting).See CFTC criteria here.
By JustMarkets The US stock indices ended Friday’s session in the red. By the end…
By Analytical Department RoboForex USD/JPY opens the week at 162.36 on Monday. The Japanese yen…
By InvestMacro Here are the latest charts and statistics for the Commitment of Traders (COT)…
By InvestMacro The latest update for the weekly Commitment of Traders (COT) report was released…
By InvestMacro Here are the latest charts and statistics for the Commitment of Traders (COT)…
By InvestMacro Here are the latest charts and statistics for the Commitment of Traders (COT)…
This website uses cookies.