By InvestMacro | COT | Data Tables | COT Leaders | Downloads | COT Newsletter
Here are the latest charts and statistics for the Commitment of Traders (COT) data published by the Commodities Futures Trading Commission (CFTC).
The latest COT data is updated through Tuesday April 5th and shows a quick view of how large traders (for-profit speculators and commercial entities) were positioned in the futures markets.
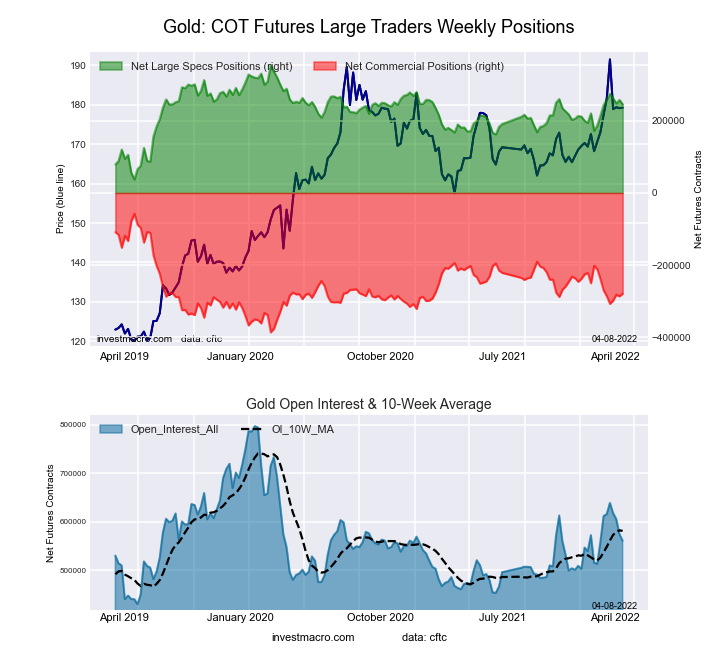
Highlighting the COT metals data is the recent decline in the Gold futures bets. The speculative net position in the Gold futures dropped this week for the third time in the past four weeks and by a total of -28,847 contracts over that time-frame. Gold spec positions had previously been on a strong run of rising weekly bullish bets and had increased for five straight weeks from February 8th to March 8th with a total gain of +102,246 contracts over that period. That speculator sentiment strength brought positions to a sixty-one week high with a net position of +274,388 contracts and coincided with the Gold price surging above the $2,050 level. Since then, bullish bets have cooled off while the Gold price has also taken a breather and fallen back into a trading range between approximately $1,920 and $1,960 where it currently resides.
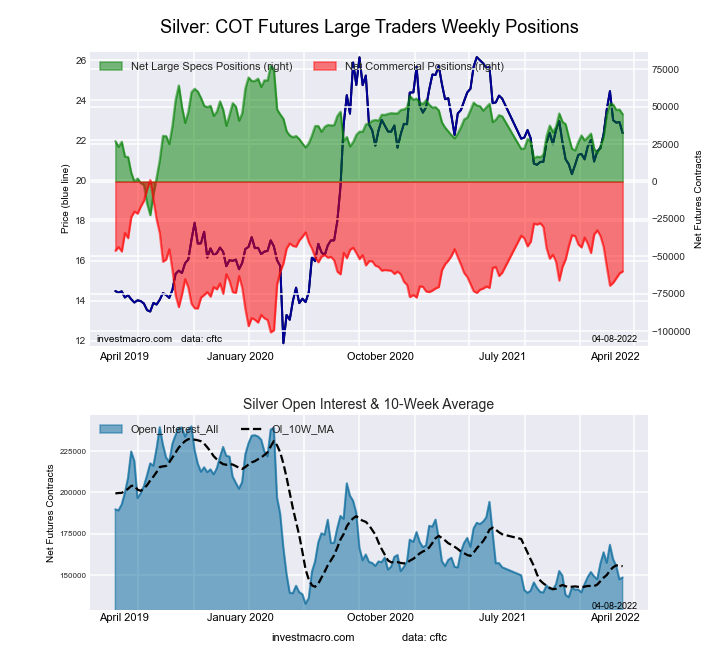
Overall, the metals market that rose this week was just Copper (5,561 contracts) while Gold (-12,055 contracts), Platinum (-2,711 contracts), Palladium (-30 contracts) and Silver (-3,206 contracts) all had lower bets on the week.
Free Reports:
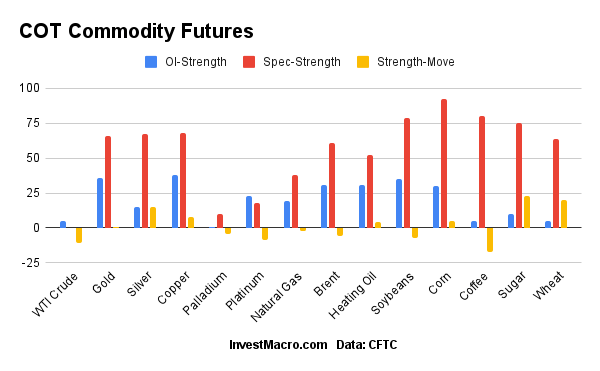
OI Strength = Current Open Interest level compared to last 3 years range
Spec Strength = Current Net Speculator level compared to last 3 years range
Strength Move = Six week change of Spec Strength
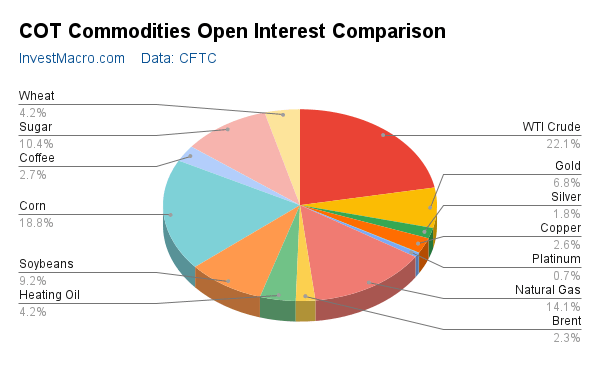
| Apr-05-2022 | OI | OI-Index | Spec-Net | Spec-Index | Com-Net | COM-Index | Smalls-Net | Smalls-Index |
|---|---|---|---|---|---|---|---|---|
| WTI Crude | 1,823,366 | 5 | 308,594 | 0 | -355,435 | 100 | 46,841 | 81 |
| Gold | 560,666 | 36 | 245,541 | 66 | -278,758 | 33 | 33,217 | 58 |
| Silver | 148,526 | 15 | 45,034 | 67 | -60,036 | 40 | 15,002 | 30 |
| Copper | 216,157 | 38 | 36,142 | 68 | -43,039 | 30 | 6,897 | 65 |
| Palladium | 6,642 | 1 | -2,041 | 10 | 1,443 | 85 | 598 | 78 |
| Platinum | 60,983 | 23 | 11,290 | 18 | -17,905 | 83 | 6,615 | 54 |
| Natural Gas | 1,169,620 | 19 | -136,611 | 38 | 92,647 | 60 | 43,964 | 90 |
| Brent | 189,394 | 31 | -29,712 | 61 | 26,537 | 37 | 3,175 | 52 |
| Heating Oil | 349,618 | 31 | 6,455 | 52 | -32,434 | 37 | 25,979 | 88 |
| Soybeans | 756,785 | 35 | 198,924 | 79 | -170,882 | 26 | -28,042 | 24 |
| Corn | 1,556,206 | 30 | 487,073 | 92 | -424,154 | 12 | -62,919 | 7 |
| Coffee | 226,730 | 5 | 43,811 | 80 | -48,758 | 22 | 4,947 | 23 |
| Sugar | 859,871 | 10 | 188,547 | 75 | -240,107 | 23 | 51,560 | 72 |
| Wheat | 344,615 | 5 | 19,951 | 64 | -15,332 | 26 | -4,619 | 89 |
This week’s current strength score (the trader positioning range over the past three years, measured from 0 to 100) shows the speculators are currently Bullish with a score of 65.8 percent. The commercials are Bearish with a score of 32.6 percent and the small traders (not shown in chart) are Bullish with a score of 58.5 percent.
| Gold Futures Statistics | SPECULATORS | COMMERCIALS | SMALL TRADERS |
| – Percent of Open Interest Longs: | 57.9 | 22.2 | 9.2 |
| – Percent of Open Interest Shorts: | 14.1 | 71.9 | 3.3 |
| – Net Position: | 245,541 | -278,758 | 33,217 |
| – Gross Longs: | 324,570 | 124,506 | 51,778 |
| – Gross Shorts: | 79,029 | 403,264 | 18,561 |
| – Long to Short Ratio: | 4.1 to 1 | 0.3 to 1 | 2.8 to 1 |
| NET POSITION TREND: | |||
| – Strength Index Score (3 Year Range Pct): | 65.8 | 32.6 | 58.5 |
| – Strength Index Reading (3 Year Range): | Bullish | Bearish | Bullish |
| NET POSITION MOVEMENT INDEX: | |||
| – 6-Week Change in Strength Index: | 0.8 | -2.8 | 18.9 |
This week’s current strength score (the trader positioning range over the past three years, measured from 0 to 100) shows the speculators are currently Bullish with a score of 67.3 percent. The commercials are Bearish with a score of 40.0 percent and the small traders (not shown in chart) are Bearish with a score of 30.2 percent.
| Silver Futures Statistics | SPECULATORS | COMMERCIALS | SMALL TRADERS |
| – Percent of Open Interest Longs: | 43.7 | 30.9 | 17.7 |
| – Percent of Open Interest Shorts: | 13.4 | 71.3 | 7.6 |
| – Net Position: | 45,034 | -60,036 | 15,002 |
| – Gross Longs: | 64,936 | 45,922 | 26,307 |
| – Gross Shorts: | 19,902 | 105,958 | 11,305 |
| – Long to Short Ratio: | 3.3 to 1 | 0.4 to 1 | 2.3 to 1 |
| NET POSITION TREND: | |||
| – Strength Index Score (3 Year Range Pct): | 67.3 | 40.0 | 30.2 |
| – Strength Index Reading (3 Year Range): | Bullish | Bearish | Bearish |
| NET POSITION MOVEMENT INDEX: | |||
| – 6-Week Change in Strength Index: | 14.7 | -16.0 | 9.2 |
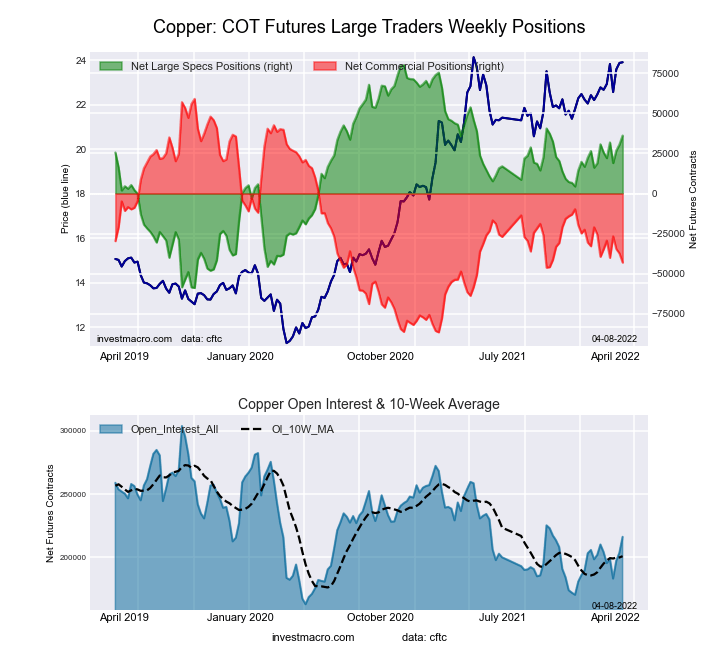
This week’s current strength score (the trader positioning range over the past three years, measured from 0 to 100) shows the speculators are currently Bullish with a score of 68.4 percent. The commercials are Bearish with a score of 29.9 percent and the small traders (not shown in chart) are Bullish with a score of 65.2 percent.
| Copper Futures Statistics | SPECULATORS | COMMERCIALS | SMALL TRADERS |
| – Percent of Open Interest Longs: | 42.0 | 38.0 | 8.6 |
| – Percent of Open Interest Shorts: | 25.3 | 57.9 | 5.4 |
| – Net Position: | 36,142 | -43,039 | 6,897 |
| – Gross Longs: | 90,779 | 82,054 | 18,675 |
| – Gross Shorts: | 54,637 | 125,093 | 11,778 |
| – Long to Short Ratio: | 1.7 to 1 | 0.7 to 1 | 1.6 to 1 |
| NET POSITION TREND: | |||
| – Strength Index Score (3 Year Range Pct): | 68.4 | 29.9 | 65.2 |
| – Strength Index Reading (3 Year Range): | Bullish | Bearish | Bullish |
| NET POSITION MOVEMENT INDEX: | |||
| – 6-Week Change in Strength Index: | 7.6 | -5.7 | -13.2 |
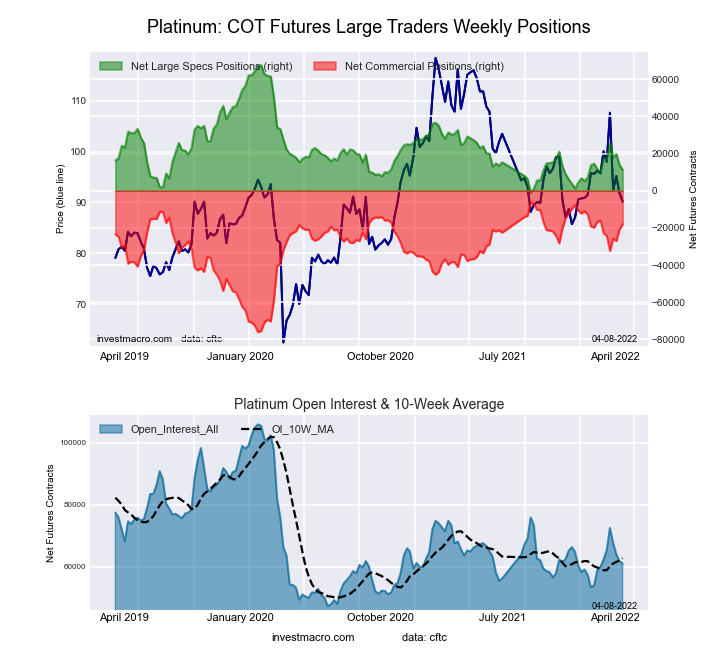
This week’s current strength score (the trader positioning range over the past three years, measured from 0 to 100) shows the speculators are currently Bearish-Extreme with a score of 18.0 percent. The commercials are Bullish-Extreme with a score of 83.4 percent and the small traders (not shown in chart) are Bullish with a score of 54.3 percent.
| Platinum Futures Statistics | SPECULATORS | COMMERCIALS | SMALL TRADERS |
| – Percent of Open Interest Longs: | 47.3 | 32.6 | 16.5 |
| – Percent of Open Interest Shorts: | 28.8 | 62.0 | 5.6 |
| – Net Position: | 11,290 | -17,905 | 6,615 |
| – Gross Longs: | 28,827 | 19,894 | 10,054 |
| – Gross Shorts: | 17,537 | 37,799 | 3,439 |
| – Long to Short Ratio: | 1.6 to 1 | 0.5 to 1 | 2.9 to 1 |
| NET POSITION TREND: | |||
| – Strength Index Score (3 Year Range Pct): | 18.0 | 83.4 | 54.3 |
| – Strength Index Reading (3 Year Range): | Bearish-Extreme | Bullish-Extreme | Bullish |
| NET POSITION MOVEMENT INDEX: | |||
| – 6-Week Change in Strength Index: | -9.1 | 7.1 | 17.7 |
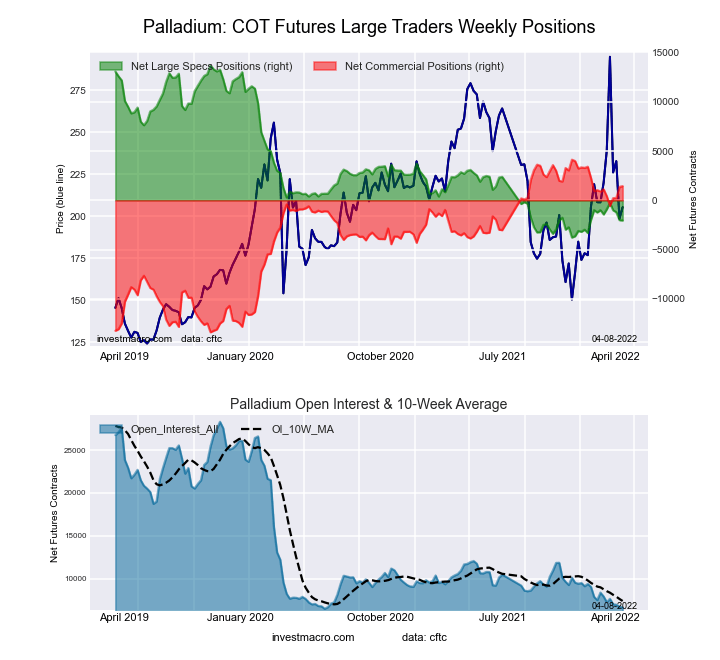
This week’s current strength score (the trader positioning range over the past three years, measured from 0 to 100) shows the speculators are currently Bearish-Extreme with a score of 9.9 percent. The commercials are Bullish-Extreme with a score of 84.7 percent and the small traders (not shown in chart) are Bullish with a score of 78.5 percent.
| Palladium Futures Statistics | SPECULATORS | COMMERCIALS | SMALL TRADERS |
| – Percent of Open Interest Longs: | 25.7 | 52.5 | 20.6 |
| – Percent of Open Interest Shorts: | 56.4 | 30.7 | 11.5 |
| – Net Position: | -2,041 | 1,443 | 598 |
| – Gross Longs: | 1,704 | 3,484 | 1,365 |
| – Gross Shorts: | 3,745 | 2,041 | 767 |
| – Long to Short Ratio: | 0.5 to 1 | 1.7 to 1 | 1.8 to 1 |
| NET POSITION TREND: | |||
| – Strength Index Score (3 Year Range Pct): | 9.9 | 84.7 | 78.5 |
| – Strength Index Reading (3 Year Range): | Bearish-Extreme | Bullish-Extreme | Bullish |
| NET POSITION MOVEMENT INDEX: | |||
| – 6-Week Change in Strength Index: | -3.5 | 1.9 | 16.6 |
Article By InvestMacro – Receive our weekly COT Reports by Email
*COT Report: The COT data, released weekly to the public each Friday, is updated through the most recent Tuesday (data is 3 days old) and shows a quick view of how large speculators or non-commercials (for-profit traders) were positioned in the futures markets.
The CFTC categorizes trader positions according to commercial hedgers (traders who use futures contracts for hedging as part of the business), non-commercials (large traders who speculate to realize trading profits) and nonreportable traders (usually small traders/speculators) as well as their open interest (contracts open in the market at time of reporting).See CFTC criteria here.
By JustMarkets The US stock indices ended Friday’s session in the red. By the end…
By Analytical Department RoboForex USD/JPY opens the week at 162.36 on Monday. The Japanese yen…
By InvestMacro Here are the latest charts and statistics for the Commitment of Traders (COT)…
By InvestMacro The latest update for the weekly Commitment of Traders (COT) report was released…
By InvestMacro Here are the latest charts and statistics for the Commitment of Traders (COT)…
By InvestMacro Here are the latest charts and statistics for the Commitment of Traders (COT)…
This website uses cookies.