By InvestMacro
Here are the latest charts and statistics for the Commitment of Traders (COT) data published by the Commodities Futures Trading Commission (CFTC).
The latest COT data is updated through Tuesday February 17th and shows a quick view of how large market participants (for-profit speculators and commercial traders) were positioned in the futures markets. All currency positions are in direct relation to the US dollar where, for example, a bet for the euro is a bet that the euro will rise versus the dollar while a bet against the euro will be a bet that the euro will decline versus the dollar.
Weekly Speculator Changes led by Japanese Yen, AUD & CAD
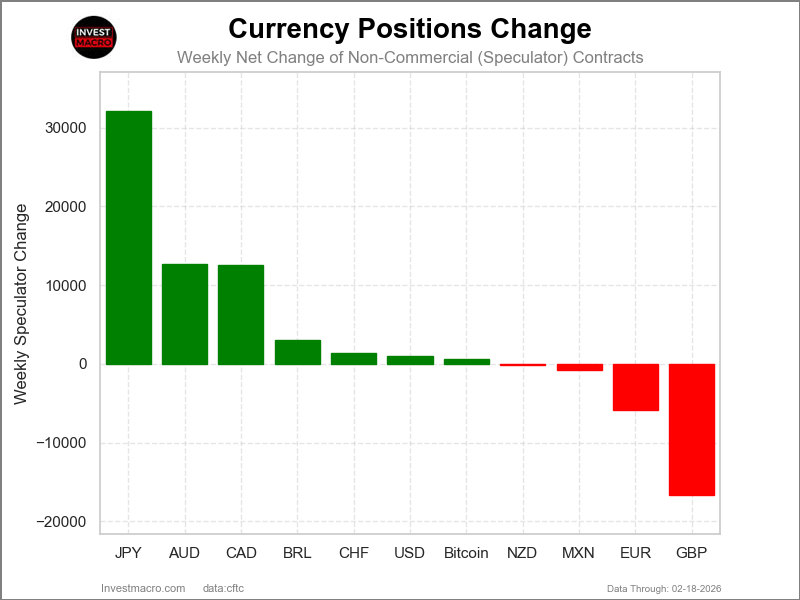
The COT currency market speculator bets were overall higher this week as seven out of the eleven currency markets we cover had higher positioning while the other four markets had lower speculator contracts.
Leading the gains for the currency markets was the Japanese Yen (32,061 contracts), the Australian Dollar (12,722 contracts), the Canadian Dollar (12,550 contracts), the Swiss Franc (1,378 contracts), the US Dollar Index (1,057 contracts), the Brazilian Real (681 contracts) and Bitcoin (621 contracts) also showing a positive week.
The currencies seeing declines in speculator bets on the week were the British Pound (-16,594 contracts), the EuroFX (-5,825 contracts), the Mexican Peso (-829 contracts) and the New Zealand Dollar (-94 contracts) registering lower bets on the week.
Currency Speculators push Japanese Yen, USD Index Bets into Bullish Positions
Highlighting the currency data this week, there were strong gains by the Japanese Yen, the Australian Dollar, and the Canadian Dollar while the US Dollar Index saw its first bullish position in quite a while.
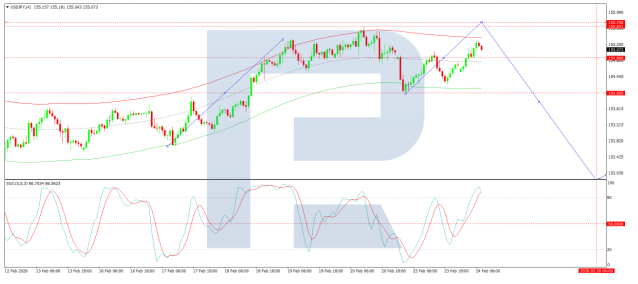
The Japanese yen speculator position this week rose by over +32,000 weekly contracts. This was the highest jump in one-week contracts since October. The Japanese weekly speculator contracts have now risen for five consecutive weeks and in seven out of the last nine weeks. This positive sentiment has brought the Japanese yen net speculator position back into a bullish level with a total net standing of 12,955 contracts this week. This is the first positive week out of the last six weeks for the Japanese yen position in the FOREX markets. The Japanese yen has continued to be a subdued currency against the US dollar and saw a shortfall this week. The USD/JPY currency pair this week closed above the 155.00 level, which remains near historic Japanese yen weakness. However, this currency pair has bounced off of resistance at the 160.00 level for the third time in the past year.
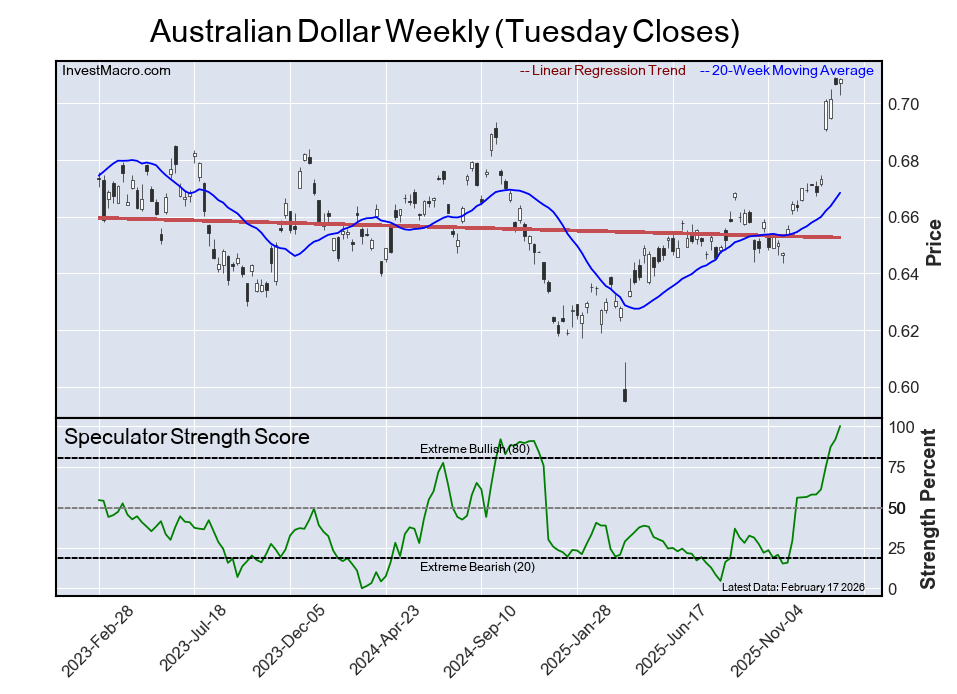
The Australian Dollar speculator position continues to improve week to week. This week’s gain was over +12,000 contracts, and the Australian Dollar speculator position has now risen for 12 consecutive weeks. The spec position has jumped by over +130,000 contracts in the past 12 weeks, which has brought the position from a -84,176 contracts on November 25th to this week’s total of 45,931 net contracts. The Australian Dollar speculator level had been so consistently bearish that we have not seen a net position above this week’s level since October of 2017. In the forex markets, the Australian Dollar keeps chugging along higher against the US Dollar and this week closed above the 0.7075 level, marking the highest close since 2023. The Australian Dollar is higher by approximately 6% since the beginning of 2026.
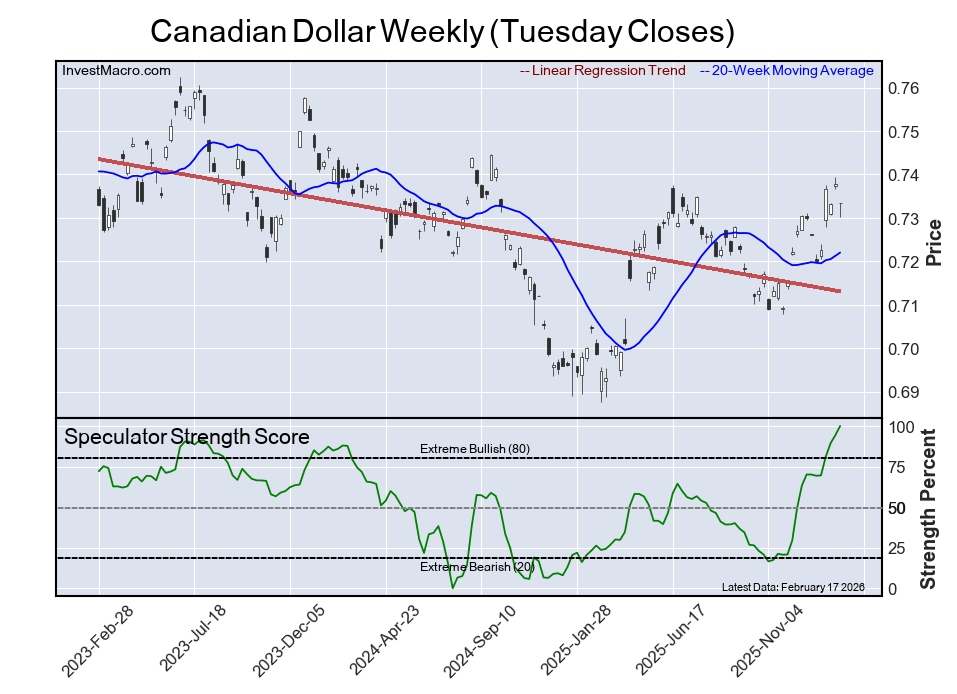
Next up, the Canadian Dollar has also been on a rise as the speculator position has now risen for five consecutive weeks and has been higher in 10 out of the last 12 weeks. In just these last 12 weeks alone, the speculator position has surged by +176,240 contracts, taking the overall net position from a super bearish total of -150,414 net contracts on November 25th to this week’s bullish position of 25,826 net contracts. The Canadian Dollar has also been modestly rising in the currency markets against the US Dollar. Since November, the CAD is up by approximately 3% and the CAD currently trades just below its 200-week moving average at the 0.7312 exchange rate.
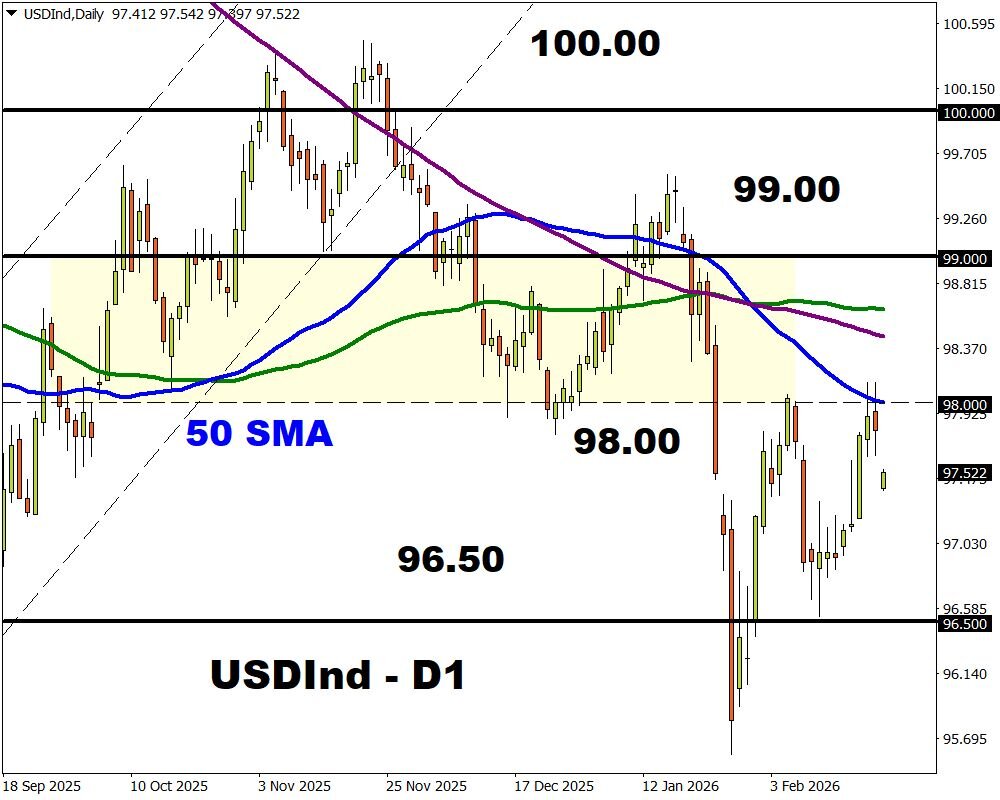
Next up, the US Dollar Index (DXY) has seen four consecutive weekly gains in speculator positions and has now seen higher speculator bets on a weekly basis in 11 out of the past 12 weeks. This week’s gain brought the overall USD Index net positioning to a small bullish position of just +328 contracts. This is the first bullish position since June of 2025, a span of 36 weeks. In the foreign exchange markets this week, the USD Index was higher by almost 1% on the week, but price gains were rejected around the 98.00 resistance level. Since the start of 2025, the DXY is down by approximately 11% and currently, the DXY has overhead resistance at 98.00, while looking lower around the 96.50 level, there has been strong support found.
U.S. Dollar Index Leads Price Gains This Week
The U.S. Dollar Index was the highest riser over the past five days, with a 1.01% increase on the week. The Mexican Peso was marginally higher with a 0.22% increase, followed by the Australian Dollar, which rose by 0.12%.
On the downside, the biggest decline was seen by Bitcoin which fell by -1.58% followed by the Japanese Yen, which dipped by -1.49%. The British Pound Sterling was lower by -1.23% followed by the New Zealand Dollar, which declined by -1.10%, and the Swiss Franc, which fell by -0.94%. The Euro dipped by -0.74% while the Canadian Dollar was lower by -0.40%, and the Brazilian Real saw a modestly lower return by -0.24%.
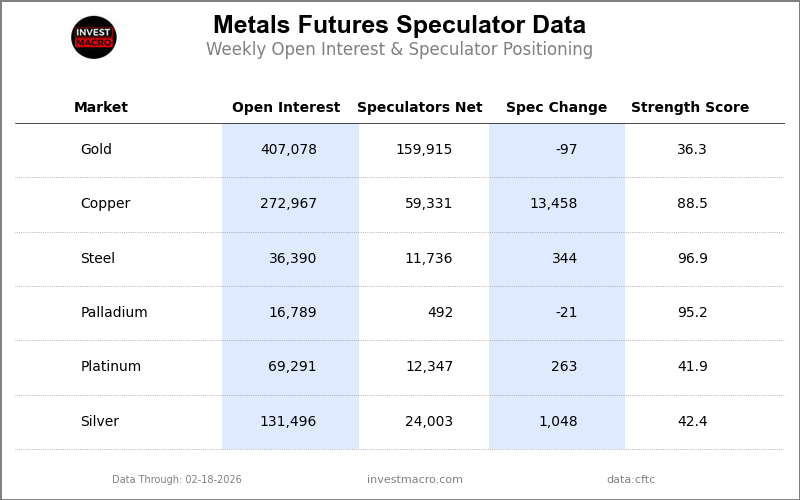
Currencies Data:
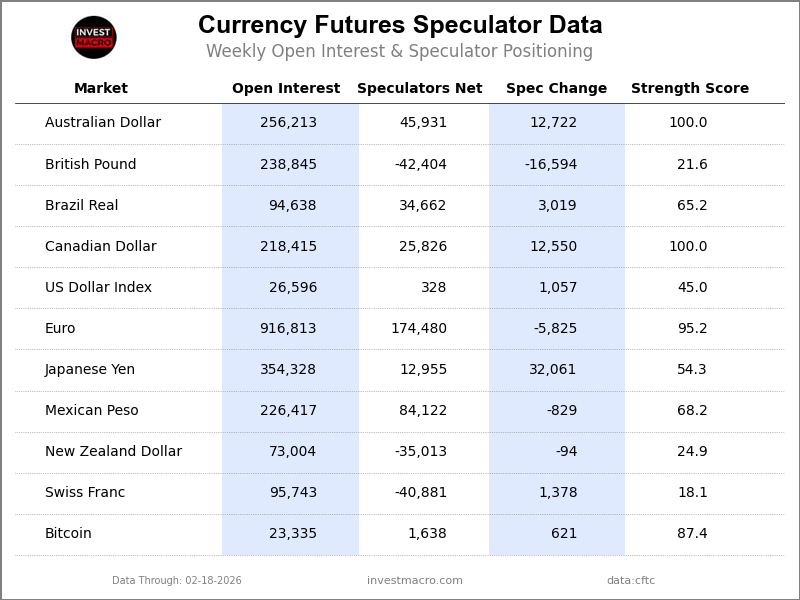
Legend: Open Interest | Speculators Current Net Position | Weekly Specs Change | Specs Strength Score compared to last 3-Years (0-100 range)
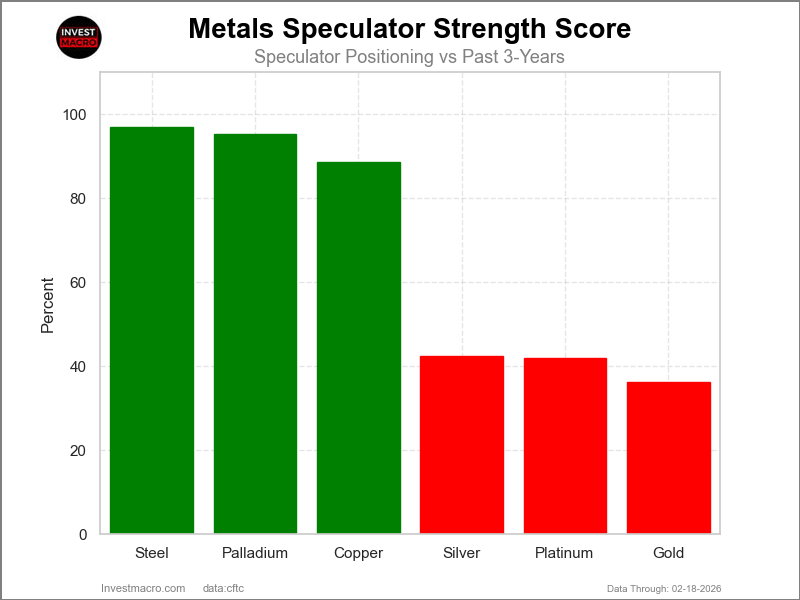
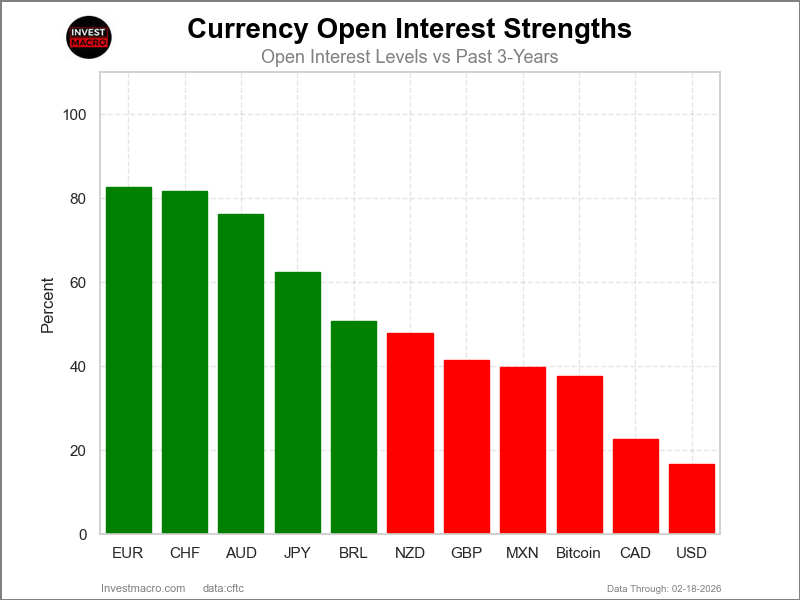
Strength Scores led by Canadian Dollar & Australian Dollar
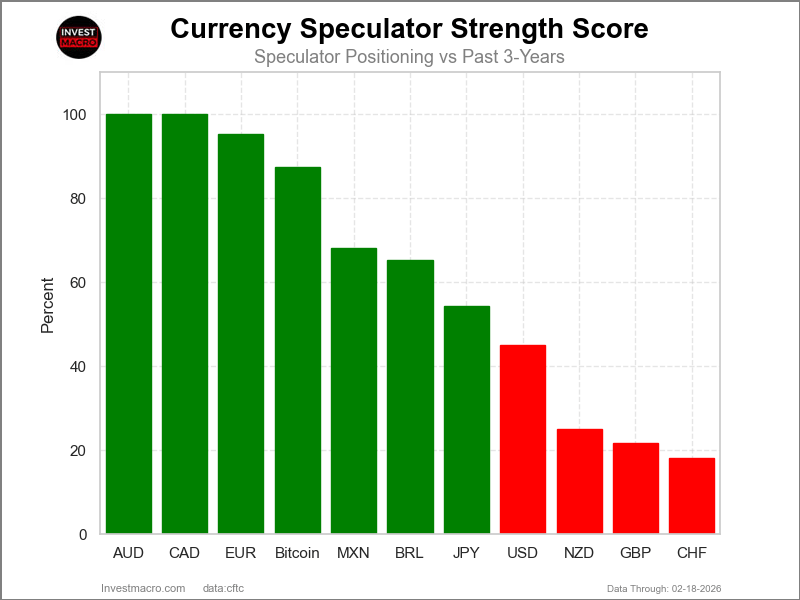
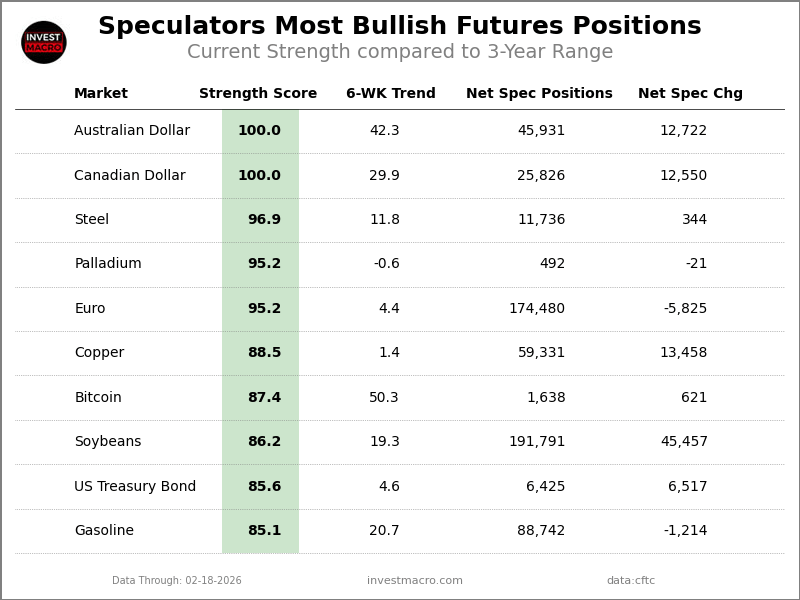
COT Strength Scores (a normalized measure of Speculator positions over a 3-Year range, from 0 to 100 where above 80 is Extreme-Bullish and below 20 is Extreme-Bearish) showed that the Canadian Dollar (100 percent) and the Australian Dollar (100 percent) lead the currency markets this week. The EuroFX (95 percent), Bitcoin (87 percent) and the Mexican Peso (68 percent) come in as the next highest in the weekly strength scores.
On the downside, the Swiss Franc (18 percent) comes in at the lowest strength levels currently and is the lone currency in Extreme-Bearish territory (below 20 percent). The next lowest strength scores are the British Pound (22 percent), the New Zealand Dollar (25 percent) and the US Dollar Index (45 percent).
3-Year Strength Statistics:
US Dollar Index (45.0 percent) vs US Dollar Index previous week (42.2 percent)
EuroFX (95.2 percent) vs EuroFX previous week (97.4 percent)
British Pound Sterling (21.6 percent) vs British Pound Sterling previous week (28.6 percent)
Japanese Yen (54.3 percent) vs Japanese Yen previous week (45.4 percent)
Swiss Franc (18.1 percent) vs Swiss Franc previous week (15.3 percent)
Canadian Dollar (100.0 percent) vs Canadian Dollar previous week (94.3 percent)
Australian Dollar (100.0 percent) vs Australian Dollar previous week (91.7 percent)
New Zealand Dollar (24.9 percent) vs New Zealand Dollar previous week (25.0 percent)
Mexican Peso (68.2 percent) vs Mexican Peso previous week (68.7 percent)
Brazilian Real (63.0 percent) vs Brazilian Real previous week (62.5 percent)
Bitcoin (87.4 percent) vs Bitcoin previous week (74.2 percent)
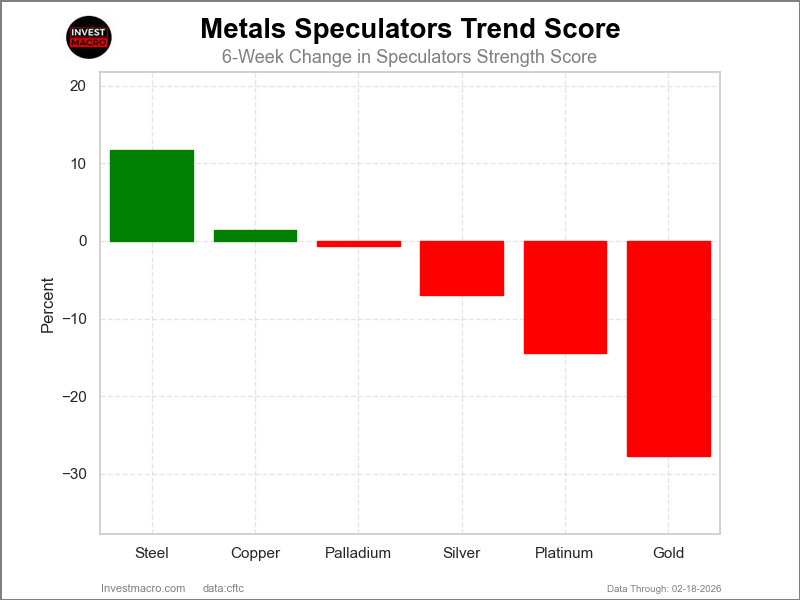
Bitcoin & Australian Dollar top the 6-Week Strength Trends
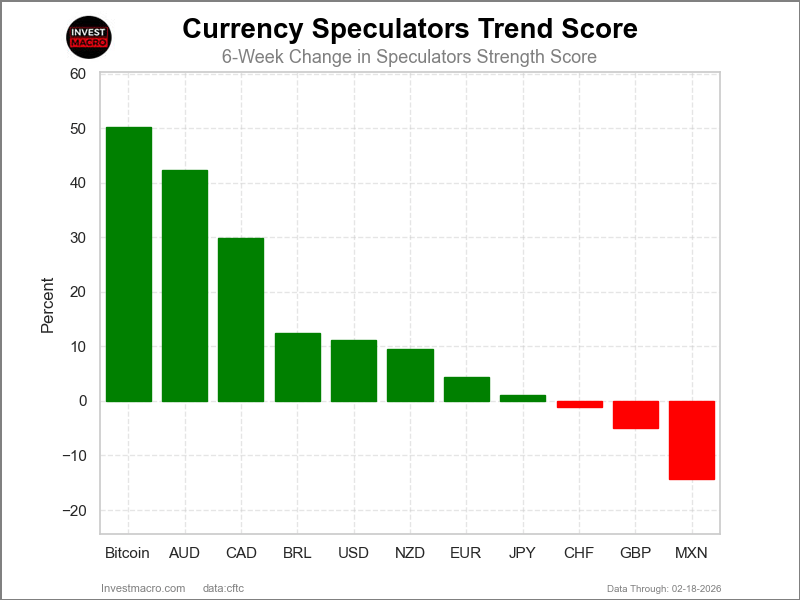
COT Strength Score Trends (or move index, calculates the 6-week changes in strength scores) showed that the Bitcoin (50 percent) and the Australian Dollar (42 percent) lead the past six weeks trends for the currencies. The Canadian Dollar (30 percent), the US Dollar Index (11 percent) and the New Zealand Dollar (10 percent) are the next highest positive movers in the 3-Year trends data.
The Mexican Peso (-14 percent) leads the downside trend scores currently with the British Pound (-5 percent) and the Swiss Franc (-1 percent) following next with lower trend scores.
3-Year Strength Trends:
US Dollar Index (11.2 percent) vs US Dollar Index previous week (8.7 percent)
EuroFX (4.4 percent) vs EuroFX previous week (8.7 percent)
British Pound Sterling (-5.0 percent) vs British Pound Sterling previous week (3.1 percent)
Japanese Yen (1.1 percent) vs Japanese Yen previous week (-9.1 percent)
Swiss Franc (-1.2 percent) vs Swiss Franc previous week (3.9 percent)
Canadian Dollar (29.9 percent) vs Canadian Dollar previous week (24.2 percent)
Australian Dollar (42.3 percent) vs Australian Dollar previous week (35.5 percent)
New Zealand Dollar (9.5 percent) vs New Zealand Dollar previous week (9.5 percent)
Mexican Peso (-14.4 percent) vs Mexican Peso previous week (-12.2 percent)
Brazilian Real (-7.6 percent) vs Brazilian Real previous week (-12.2 percent)
Bitcoin (50.3 percent) vs Bitcoin previous week (32.4 percent)
Individual COT Forex Markets:
US Dollar Index Futures:
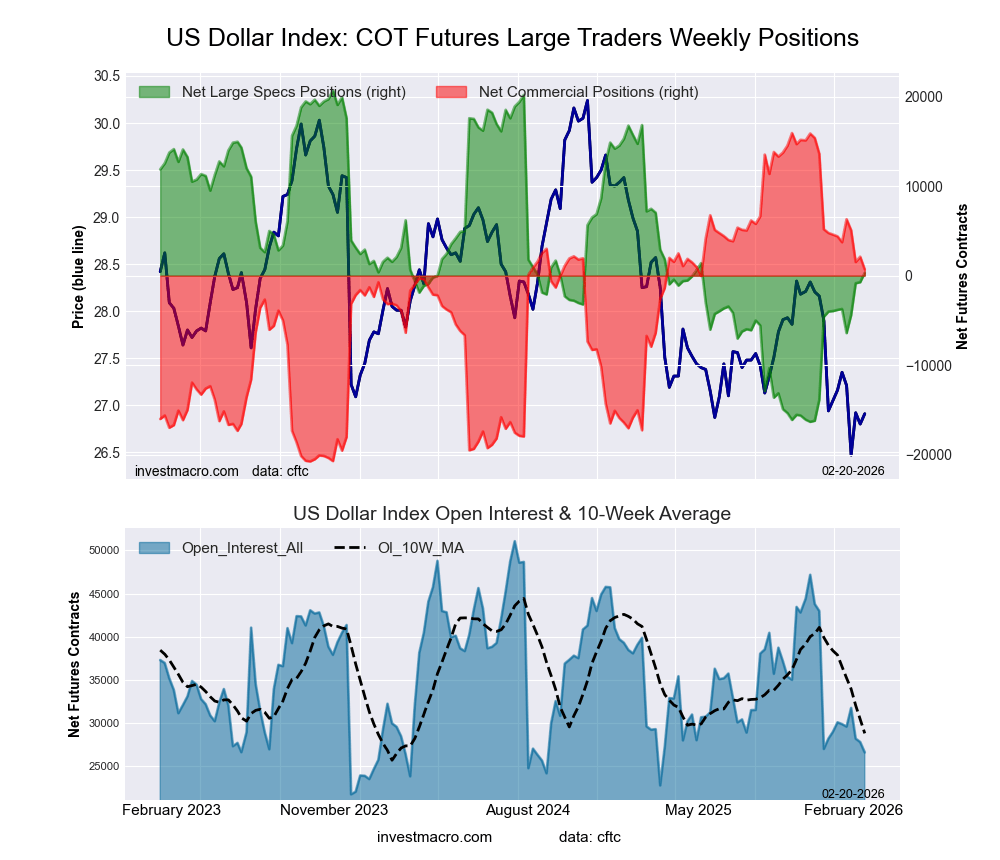 The US Dollar Index large speculator standing this week reached a net position of 328 contracts in the data reported through Tuesday. This was a weekly boost of 1,057 contracts from the previous week which had a total of -729 net contracts.
This week’s current strength score (the trader positioning range over the past three years, measured from 0 to 100) shows the speculators are currently Bearish with a score of 45.0 percent. The commercials are Bullish with a score of 58.5 percent and the small traders (not shown in chart) are Bearish-Extreme with a score of 18.9 percent.
Price Trend-Following Model: Downtrend
Our weekly trend-following model classifies the current market price position as: Downtrend.
| US DOLLAR INDEX Statistics | SPECULATORS | COMMERCIALS | SMALL TRADERS |
| – Percent of Open Interest Longs: | 58.0 | 26.7 | 7.5 |
| – Percent of Open Interest Shorts: | 56.7 | 24.1 | 11.3 |
| – Net Position: | 328 | 694 | -1,022 |
| – Gross Longs: | 15,416 | 7,094 | 1,996 |
| – Gross Shorts: | 15,088 | 6,400 | 3,018 |
| – Long to Short Ratio: | 1.0 to 1 | 1.1 to 1 | 0.7 to 1 |
| NET POSITION TREND: | | | |
| – Strength Index Score (3 Year Range Pct): | 45.0 | 58.5 | 18.9 |
| – Strength Index Reading (3 Year Range): | Bearish | Bullish | Bearish-Extreme |
| NET POSITION MOVEMENT INDEX: | | | |
| – 6-Week Change in Strength Index: | 11.2 | -10.1 | -7.1 |
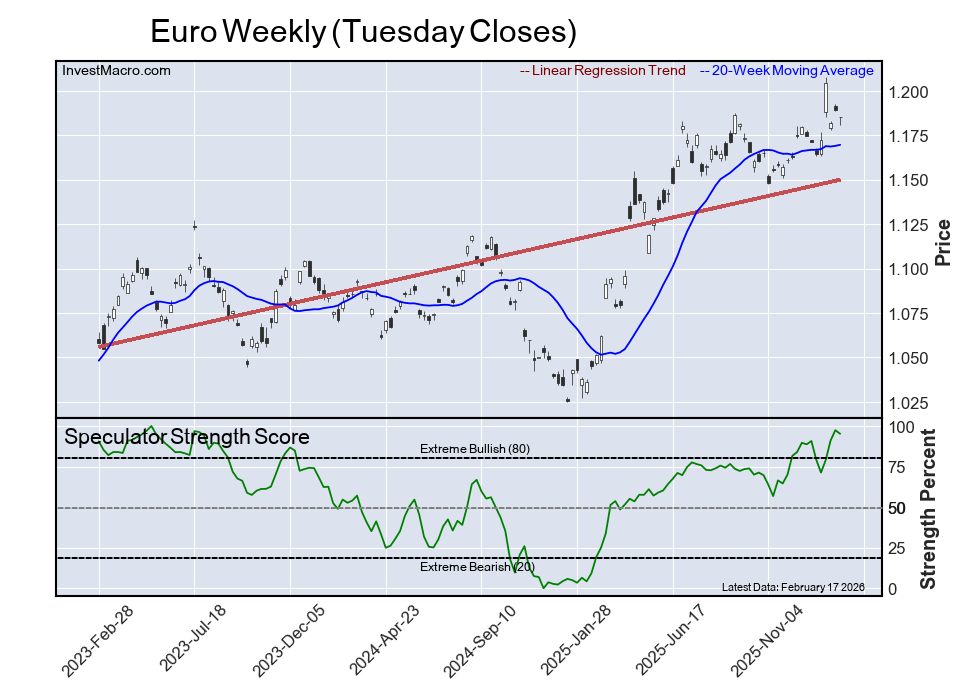
Euro Currency Futures:
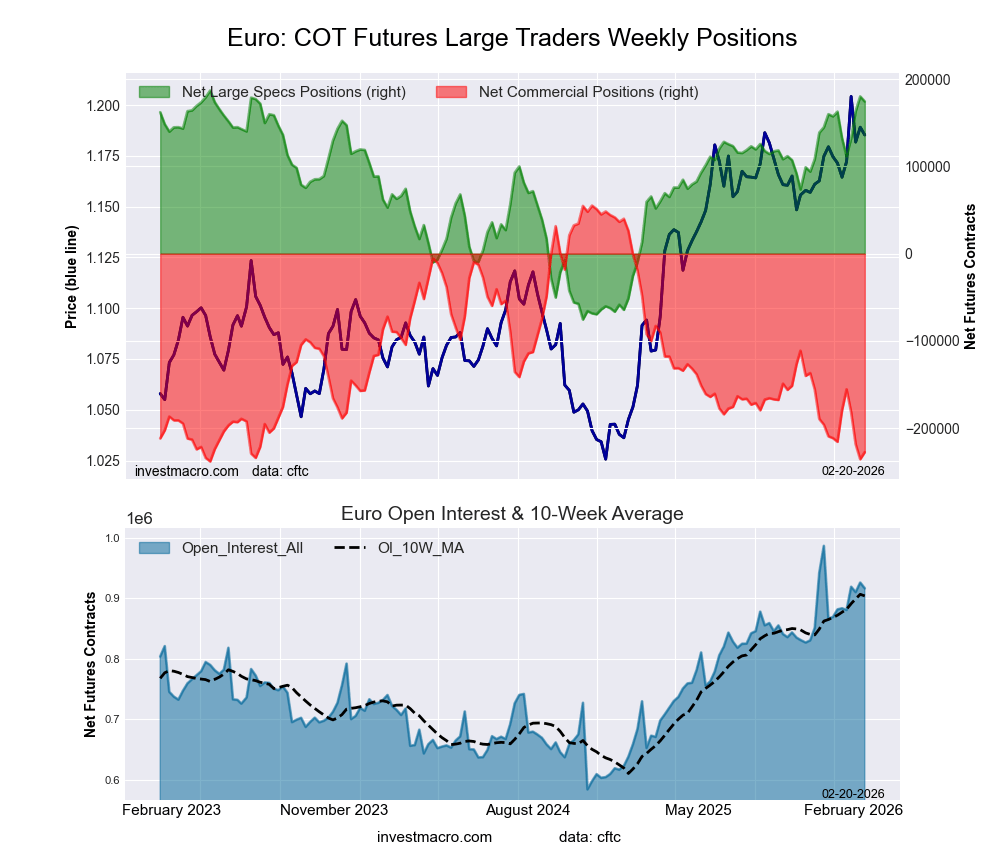 The Euro Currency large speculator standing this week reached a net position of 174,480 contracts in the data reported through Tuesday. This was a weekly decline of -5,825 contracts from the previous week which had a total of 180,305 net contracts.
This week’s current strength score (the trader positioning range over the past three years, measured from 0 to 100) shows the speculators are currently Bullish-Extreme with a score of 95.2 percent. The commercials are Bearish-Extreme with a score of 3.6 percent and the small traders (not shown in chart) are Bullish-Extreme with a score of 86.8 percent.
Price Trend-Following Model: Uptrend
Our weekly trend-following model classifies the current market price position as: Uptrend.
| EURO Currency Statistics | SPECULATORS | COMMERCIALS | SMALL TRADERS |
| – Percent of Open Interest Longs: | 34.0 | 53.1 | 10.5 |
| – Percent of Open Interest Shorts: | 15.0 | 78.0 | 4.7 |
| – Net Position: | 174,480 | -227,677 | 53,197 |
| – Gross Longs: | 311,549 | 487,219 | 96,673 |
| – Gross Shorts: | 137,069 | 714,896 | 43,476 |
| – Long to Short Ratio: | 2.3 to 1 | 0.7 to 1 | 2.2 to 1 |
| NET POSITION TREND: | | | |
| – Strength Index Score (3 Year Range Pct): | 95.2 | 3.6 | 86.8 |
| – Strength Index Reading (3 Year Range): | Bullish-Extreme | Bearish-Extreme | Bullish-Extreme |
| NET POSITION MOVEMENT INDEX: | | | |
| – 6-Week Change in Strength Index: | 4.4 | -4.0 | 0.4 |
British Pound Sterling Futures:
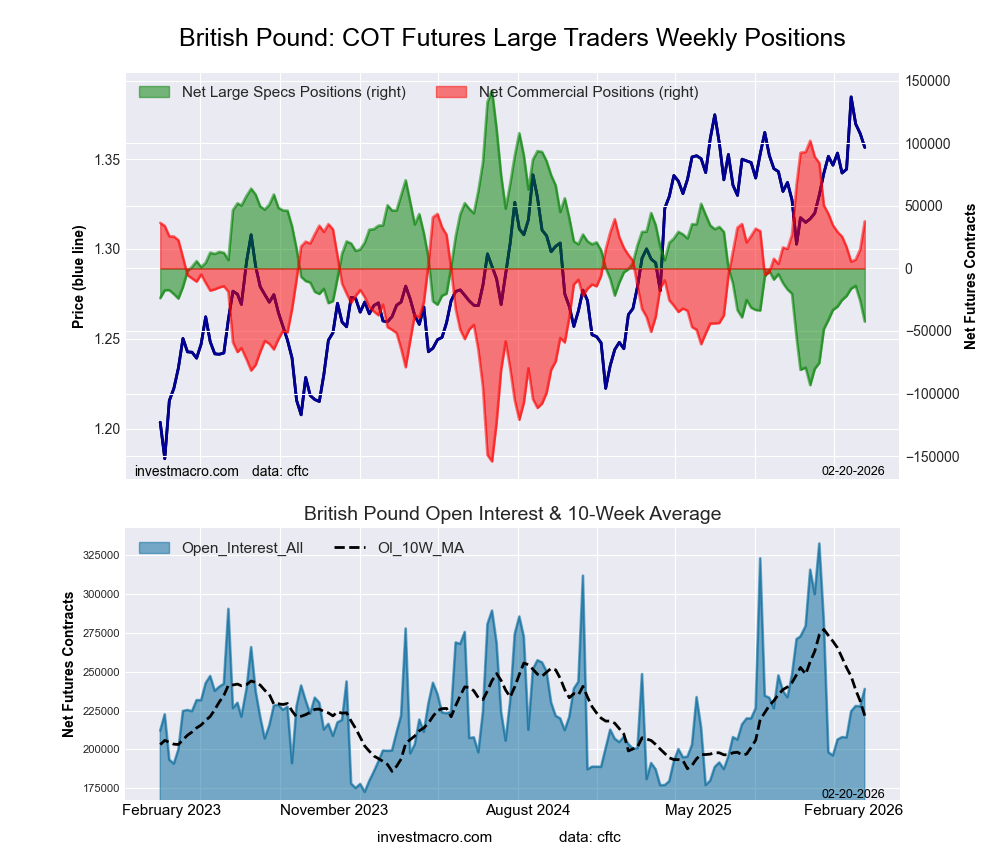 The British Pound Sterling large speculator standing this week reached a net position of -42,404 contracts in the data reported through Tuesday. This was a weekly fall of -16,594 contracts from the previous week which had a total of -25,810 net contracts.
This week’s current strength score (the trader positioning range over the past three years, measured from 0 to 100) shows the speculators are currently Bearish with a score of 21.6 percent. The commercials are Bullish with a score of 74.9 percent and the small traders (not shown in chart) are Bullish with a score of 65.6 percent.
Price Trend-Following Model: Uptrend
Our weekly trend-following model classifies the current market price position as: Uptrend.
| BRITISH POUND Statistics | SPECULATORS | COMMERCIALS | SMALL TRADERS |
| – Percent of Open Interest Longs: | 34.3 | 48.2 | 13.8 |
| – Percent of Open Interest Shorts: | 52.1 | 32.4 | 11.8 |
| – Net Position: | -42,404 | 37,654 | 4,750 |
| – Gross Longs: | 82,015 | 115,022 | 32,847 |
| – Gross Shorts: | 124,419 | 77,368 | 28,097 |
| – Long to Short Ratio: | 0.7 to 1 | 1.5 to 1 | 1.2 to 1 |
| NET POSITION TREND: | | | |
| – Strength Index Score (3 Year Range Pct): | 21.6 | 74.9 | 65.6 |
| – Strength Index Reading (3 Year Range): | Bearish | Bullish | Bullish |
| NET POSITION MOVEMENT INDEX: | | | |
| – 6-Week Change in Strength Index: | -5.0 | 3.3 | 9.0 |
Japanese Yen Futures:
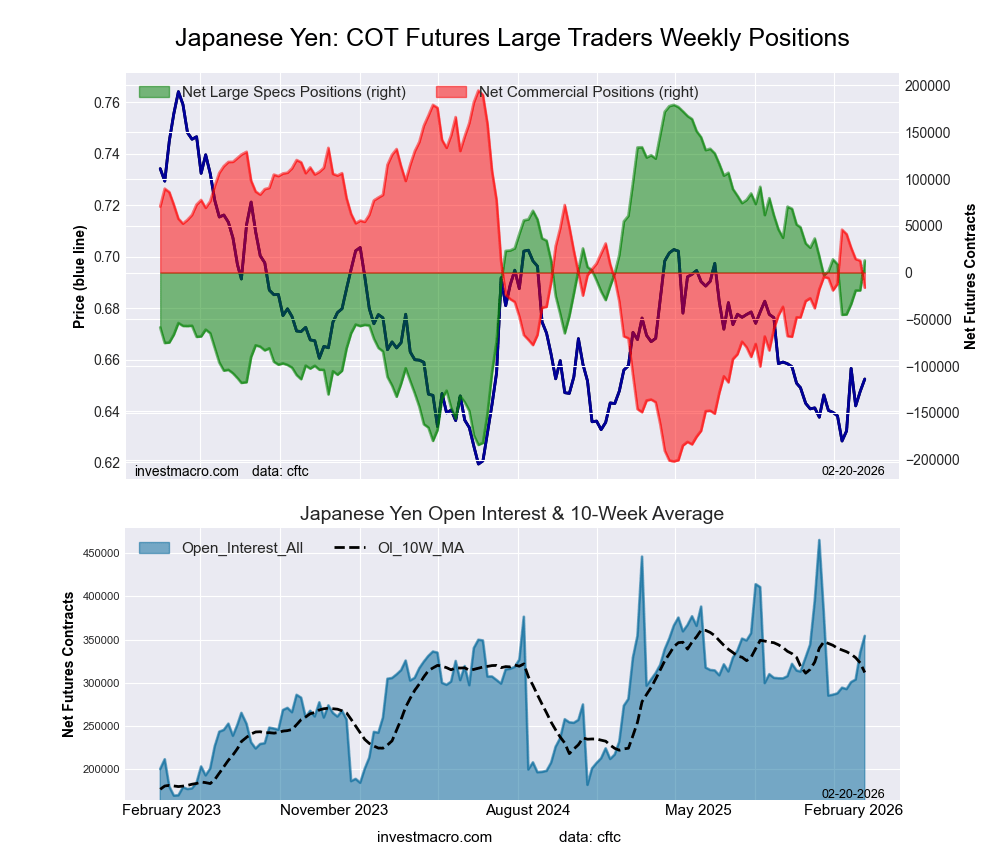 The Japanese Yen large speculator standing this week reached a net position of 12,955 contracts in the data reported through Tuesday. This was a weekly gain of 32,061 contracts from the previous week which had a total of -19,106 net contracts.
This week’s current strength score (the trader positioning range over the past three years, measured from 0 to 100) shows the speculators are currently Bullish with a score of 54.3 percent. The commercials are Bearish with a score of 46.8 percent and the small traders (not shown in chart) are Bearish with a score of 45.2 percent.
Price Trend-Following Model: Weak Downtrend
Our weekly trend-following model classifies the current market price position as: Weak Downtrend.
| JAPANESE YEN Statistics | SPECULATORS | COMMERCIALS | SMALL TRADERS |
| – Percent of Open Interest Longs: | 40.4 | 40.0 | 11.1 |
| – Percent of Open Interest Shorts: | 36.8 | 44.6 | 10.1 |
| – Net Position: | 12,955 | -16,168 | 3,213 |
| – Gross Longs: | 143,172 | 141,766 | 39,166 |
| – Gross Shorts: | 130,217 | 157,934 | 35,953 |
| – Long to Short Ratio: | 1.1 to 1 | 0.9 to 1 | 1.1 to 1 |
| NET POSITION TREND: | | | |
| – Strength Index Score (3 Year Range Pct): | 54.3 | 46.8 | 45.2 |
| – Strength Index Reading (3 Year Range): | Bullish | Bearish | Bearish |
| NET POSITION MOVEMENT INDEX: | | | |
| – 6-Week Change in Strength Index: | 1.1 | -1.0 | -0.4 |
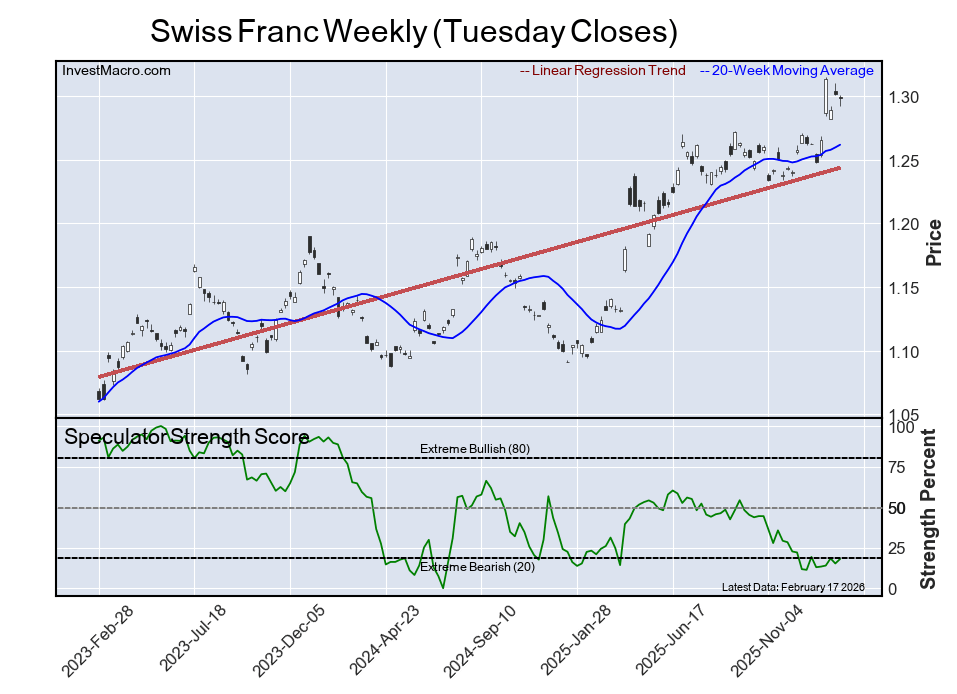
Swiss Franc Futures:
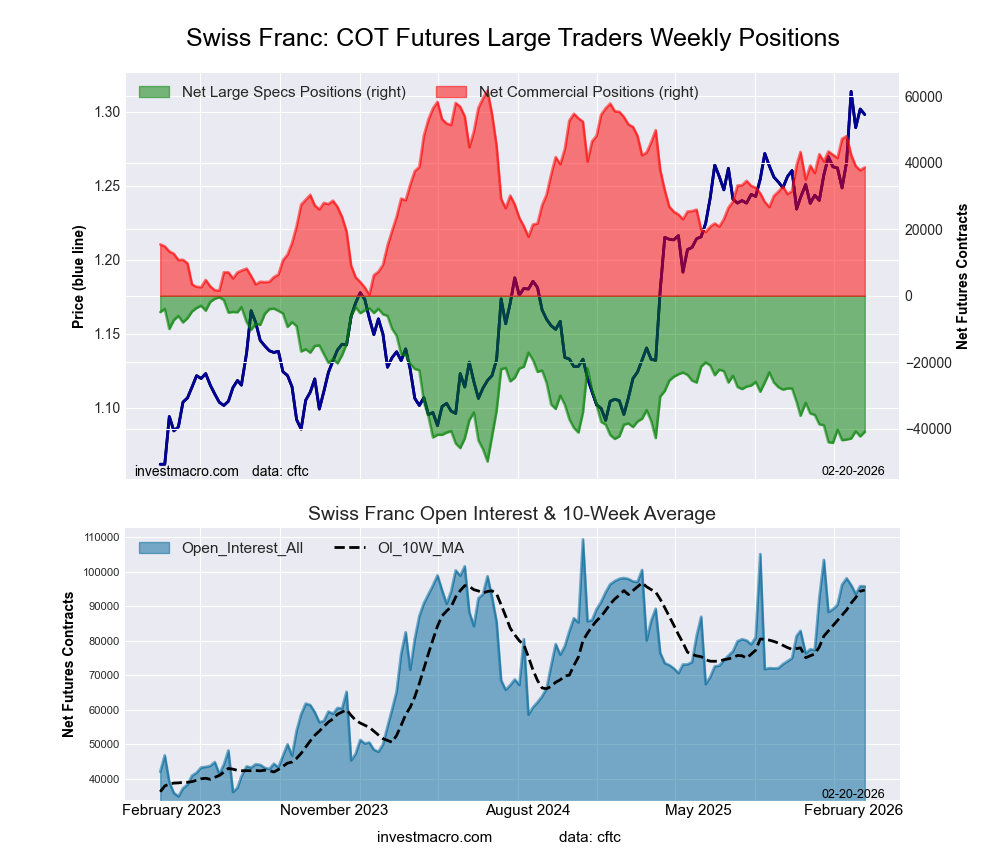 The Swiss Franc large speculator standing this week reached a net position of -40,881 contracts in the data reported through Tuesday. This was a weekly increase of 1,378 contracts from the previous week which had a total of -42,259 net contracts.
This week’s current strength score (the trader positioning range over the past three years, measured from 0 to 100) shows the speculators are currently Bearish-Extreme with a score of 18.1 percent. The commercials are Bullish with a score of 62.4 percent and the small traders (not shown in chart) are Bullish-Extreme with a score of 88.4 percent.
Price Trend-Following Model: Strong Uptrend
Our weekly trend-following model classifies the current market price position as: Strong Uptrend.
| SWISS FRANC Statistics | SPECULATORS | COMMERCIALS | SMALL TRADERS |
| – Percent of Open Interest Longs: | 10.5 | 68.7 | 20.7 |
| – Percent of Open Interest Shorts: | 53.2 | 28.4 | 18.3 |
| – Net Position: | -40,881 | 38,596 | 2,285 |
| – Gross Longs: | 10,072 | 65,773 | 19,844 |
| – Gross Shorts: | 50,953 | 27,177 | 17,559 |
| – Long to Short Ratio: | 0.2 to 1 | 2.4 to 1 | 1.1 to 1 |
| NET POSITION TREND: | | | |
| – Strength Index Score (3 Year Range Pct): | 18.1 | 62.4 | 88.4 |
| – Strength Index Reading (3 Year Range): | Bearish-Extreme | Bullish | Bullish-Extreme |
| NET POSITION MOVEMENT INDEX: | | | |
| – 6-Week Change in Strength Index: | -1.2 | -4.6 | 14.5 |
Canadian Dollar Futures:
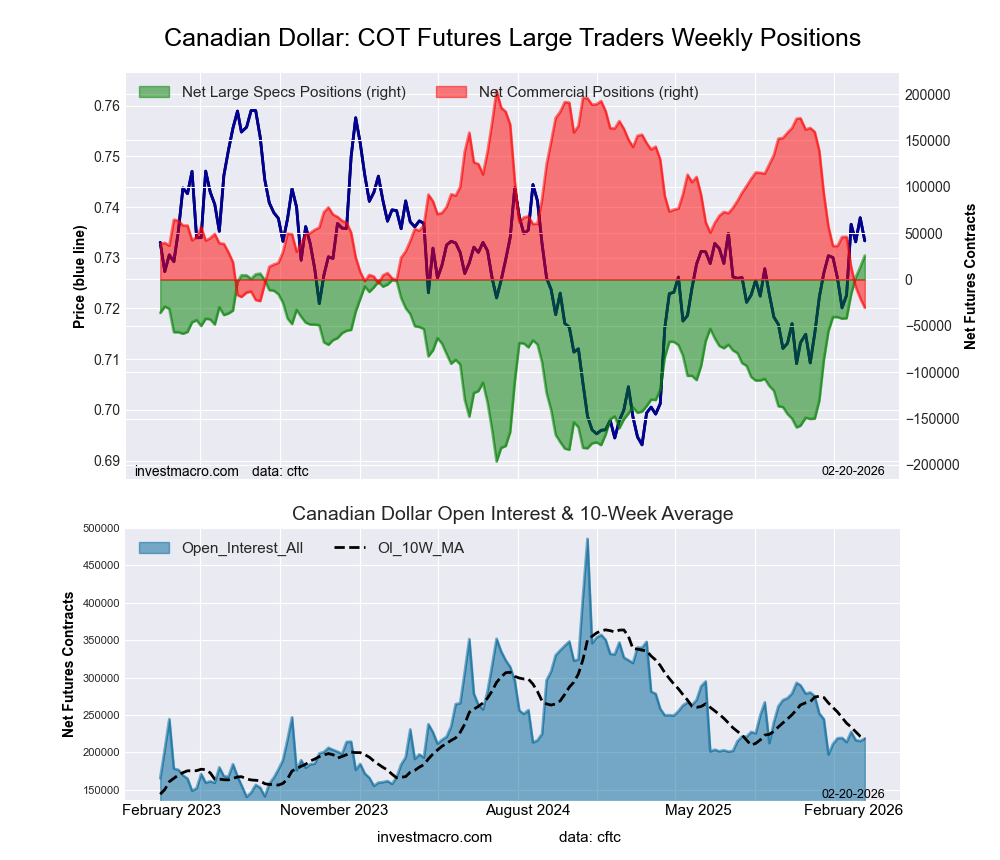 The Canadian Dollar large speculator standing this week reached a net position of 25,826 contracts in the data reported through Tuesday. This was a weekly rise of 12,550 contracts from the previous week which had a total of 13,276 net contracts.
This week’s current strength score (the trader positioning range over the past three years, measured from 0 to 100) shows the speculators are currently Bullish-Extreme with a score of 100.0 percent. The commercials are Bearish-Extreme with a score of 0.0 percent and the small traders (not shown in chart) are Bullish with a score of 58.0 percent.
Price Trend-Following Model: Uptrend
Our weekly trend-following model classifies the current market price position as: Uptrend.
| CANADIAN DOLLAR Statistics | SPECULATORS | COMMERCIALS | SMALL TRADERS |
| – Percent of Open Interest Longs: | 41.0 | 42.9 | 14.0 |
| – Percent of Open Interest Shorts: | 29.2 | 56.8 | 11.9 |
| – Net Position: | 25,826 | -30,374 | 4,548 |
| – Gross Longs: | 89,601 | 93,653 | 30,479 |
| – Gross Shorts: | 63,775 | 124,027 | 25,931 |
| – Long to Short Ratio: | 1.4 to 1 | 0.8 to 1 | 1.2 to 1 |
| NET POSITION TREND: | | | |
| – Strength Index Score (3 Year Range Pct): | 100.0 | 0.0 | 58.0 |
| – Strength Index Reading (3 Year Range): | Bullish-Extreme | Bearish-Extreme | Bullish |
| NET POSITION MOVEMENT INDEX: | | | |
| – 6-Week Change in Strength Index: | 29.9 | -28.4 | 0.1 |
Australian Dollar Futures:
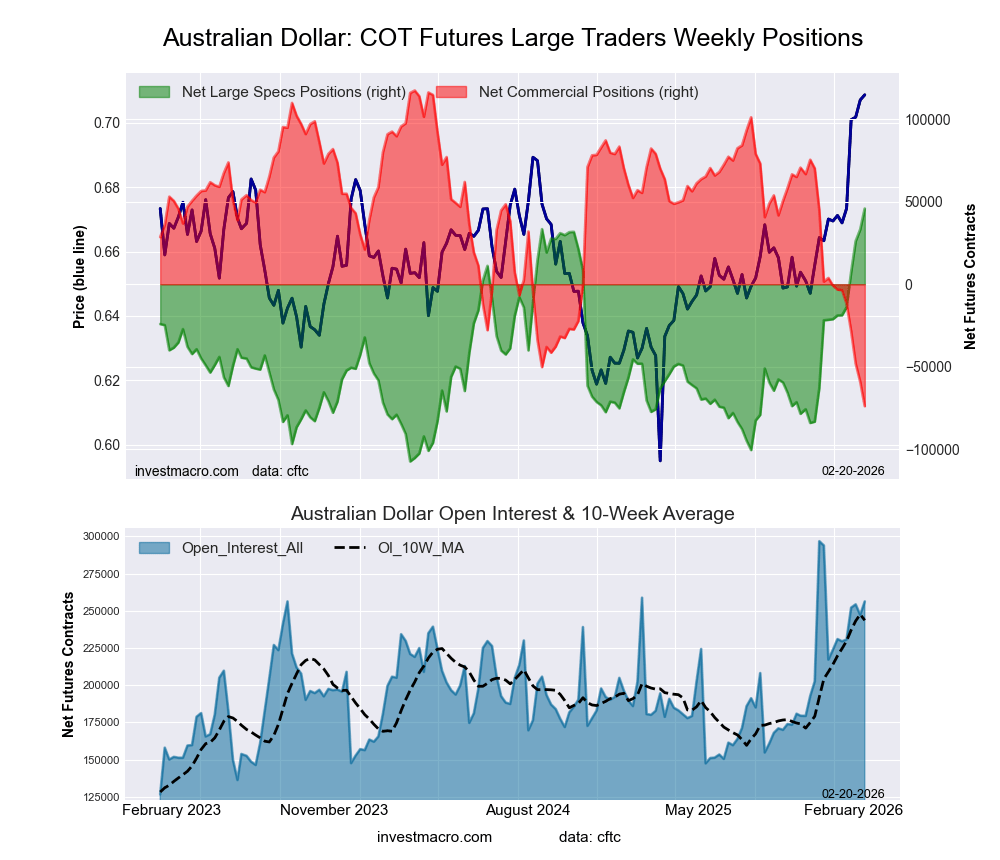 The Australian Dollar large speculator standing this week reached a net position of 45,931 contracts in the data reported through Tuesday. This was a weekly increase of 12,722 contracts from the previous week which had a total of 33,209 net contracts.
This week’s current strength score (the trader positioning range over the past three years, measured from 0 to 100) shows the speculators are currently Bullish-Extreme with a score of 100.0 percent. The commercials are Bearish-Extreme with a score of 0.0 percent and the small traders (not shown in chart) are Bullish-Extreme with a score of 100.0 percent.
Price Trend-Following Model: Strong Uptrend
Our weekly trend-following model classifies the current market price position as: Strong Uptrend.
| AUSTRALIAN DOLLAR Statistics | SPECULATORS | COMMERCIALS | SMALL TRADERS |
| – Percent of Open Interest Longs: | 46.0 | 32.3 | 17.8 |
| – Percent of Open Interest Shorts: | 28.1 | 61.2 | 6.8 |
| – Net Position: | 45,931 | -73,989 | 28,058 |
| – Gross Longs: | 117,820 | 82,854 | 45,601 |
| – Gross Shorts: | 71,889 | 156,843 | 17,543 |
| – Long to Short Ratio: | 1.6 to 1 | 0.5 to 1 | 2.6 to 1 |
| NET POSITION TREND: | | | |
| – Strength Index Score (3 Year Range Pct): | 100.0 | 0.0 | 100.0 |
| – Strength Index Reading (3 Year Range): | Bullish-Extreme | Bearish-Extreme | Bullish-Extreme |
| NET POSITION MOVEMENT INDEX: | | | |
| – 6-Week Change in Strength Index: | 42.3 | -36.9 | 12.5 |
New Zealand Dollar Futures:
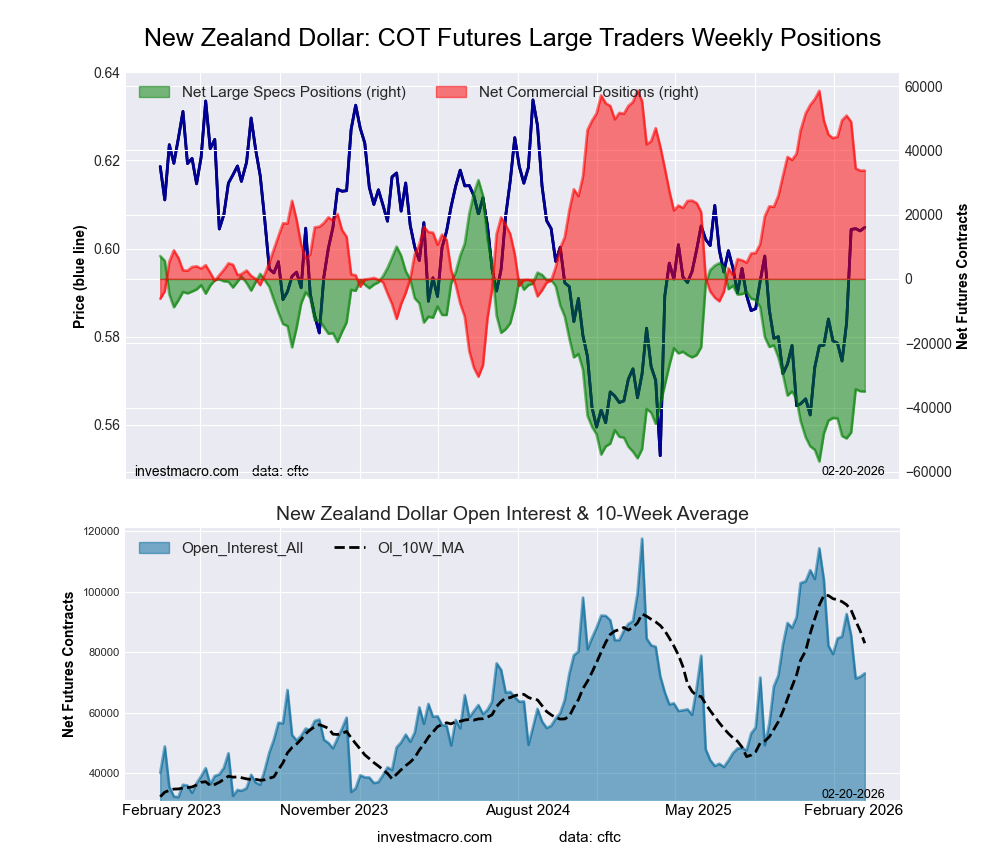 The New Zealand Dollar large speculator standing this week reached a net position of -35,013 contracts in the data reported through Tuesday. This was a weekly lowering of -94 contracts from the previous week which had a total of -34,919 net contracts.
This week’s current strength score (the trader positioning range over the past three years, measured from 0 to 100) shows the speculators are currently Bearish with a score of 24.9 percent. The commercials are Bullish with a score of 72.0 percent and the small traders (not shown in chart) are Bullish with a score of 69.3 percent.
Price Trend-Following Model: Strong Uptrend
Our weekly trend-following model classifies the current market price position as: Strong Uptrend.
| NEW ZEALAND DOLLAR Statistics | SPECULATORS | COMMERCIALS | SMALL TRADERS |
| – Percent of Open Interest Longs: | 15.3 | 76.3 | 6.5 |
| – Percent of Open Interest Shorts: | 63.3 | 30.1 | 4.7 |
| – Net Position: | -35,013 | 33,709 | 1,304 |
| – Gross Longs: | 11,183 | 55,719 | 4,750 |
| – Gross Shorts: | 46,196 | 22,010 | 3,446 |
| – Long to Short Ratio: | 0.2 to 1 | 2.5 to 1 | 1.4 to 1 |
| NET POSITION TREND: | | | |
| – Strength Index Score (3 Year Range Pct): | 24.9 | 72.0 | 69.3 |
| – Strength Index Reading (3 Year Range): | Bearish | Bullish | Bullish |
| NET POSITION MOVEMENT INDEX: | | | |
| – 6-Week Change in Strength Index: | 9.5 | -11.8 | 28.1 |
Mexican Peso Futures:
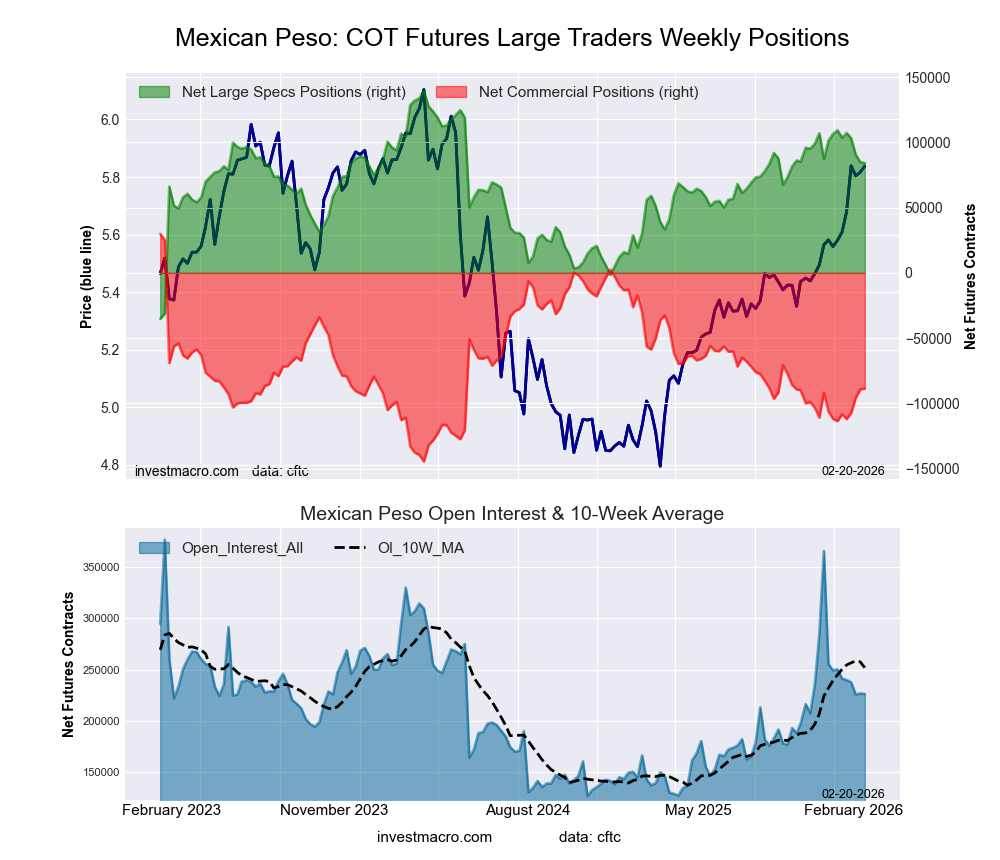 The Mexican Peso large speculator standing this week reached a net position of 84,122 contracts in the data reported through Tuesday. This was a weekly fall of -829 contracts from the previous week which had a total of 84,951 net contracts.
This week’s current strength score (the trader positioning range over the past three years, measured from 0 to 100) shows the speculators are currently Bullish with a score of 68.2 percent. The commercials are Bearish with a score of 32.0 percent and the small traders (not shown in chart) are Bearish with a score of 48.0 percent.
Price Trend-Following Model: Strong Uptrend
Our weekly trend-following model classifies the current market price position as: Strong Uptrend.
| MEXICAN PESO Statistics | SPECULATORS | COMMERCIALS | SMALL TRADERS |
| – Percent of Open Interest Longs: | 56.6 | 39.1 | 3.2 |
| – Percent of Open Interest Shorts: | 19.5 | 78.2 | 1.2 |
| – Net Position: | 84,122 | -88,665 | 4,543 |
| – Gross Longs: | 128,197 | 88,449 | 7,231 |
| – Gross Shorts: | 44,075 | 177,114 | 2,688 |
| – Long to Short Ratio: | 2.9 to 1 | 0.5 to 1 | 2.7 to 1 |
| NET POSITION TREND: | | | |
| – Strength Index Score (3 Year Range Pct): | 68.2 | 32.0 | 48.0 |
| – Strength Index Reading (3 Year Range): | Bullish | Bearish | Bearish |
| NET POSITION MOVEMENT INDEX: | | | |
| – 6-Week Change in Strength Index: | -14.4 | 14.3 | 1.6 |
Brazilian Real Futures:
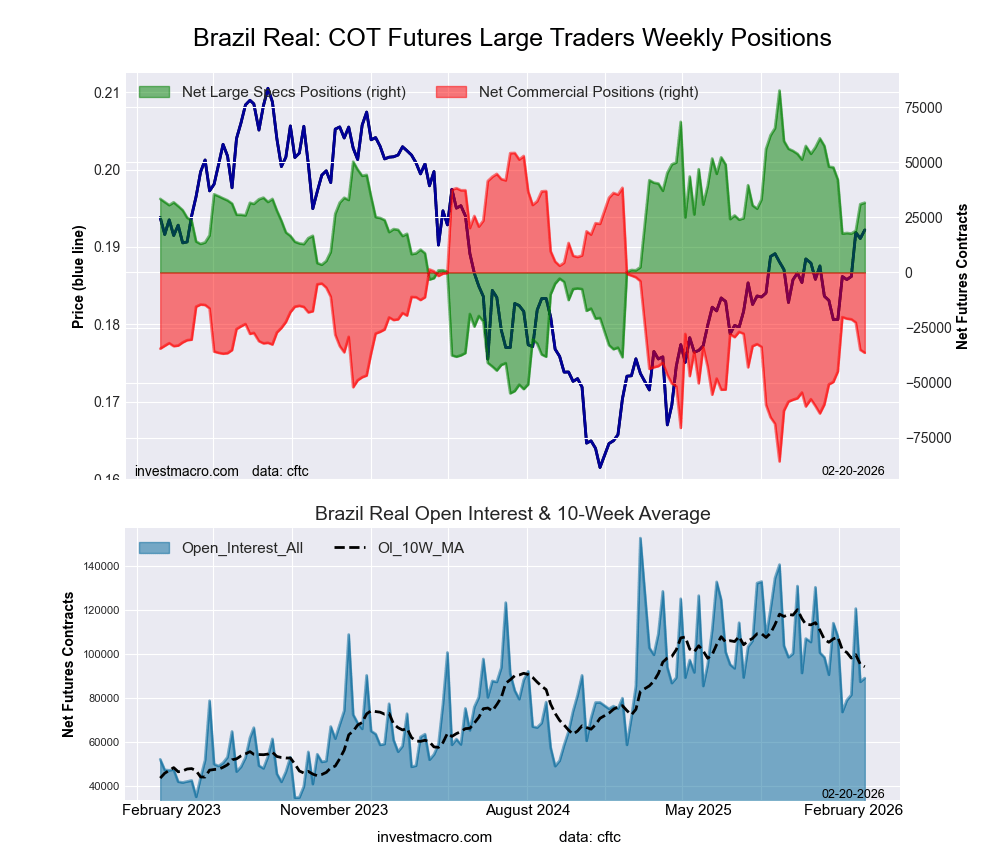 The Brazilian Real large speculator standing this week reached a net position of 31,643 contracts in the data reported through Tuesday. This was a weekly gain of 681 contracts from the previous week which had a total of 30,962 net contracts.
This week’s current strength score (the trader positioning range over the past three years, measured from 0 to 100) shows the speculators are currently Bullish with a score of 63.0 percent. The commercials are Bearish with a score of 35.2 percent and the small traders (not shown in chart) are Bearish with a score of 48.1 percent.
Price Trend-Following Model: Strong Uptrend
Our weekly trend-following model classifies the current market price position as: Strong Uptrend.
| BRAZIL REAL Statistics | SPECULATORS | COMMERCIALS | SMALL TRADERS |
| – Percent of Open Interest Longs: | 65.6 | 27.3 | 6.1 |
| – Percent of Open Interest Shorts: | 30.1 | 68.2 | 0.7 |
| – Net Position: | 31,643 | -36,474 | 4,831 |
| – Gross Longs: | 58,395 | 24,271 | 5,456 |
| – Gross Shorts: | 26,752 | 60,745 | 625 |
| – Long to Short Ratio: | 2.2 to 1 | 0.4 to 1 | 8.7 to 1 |
| NET POSITION TREND: | | | |
| – Strength Index Score (3 Year Range Pct): | 63.0 | 35.2 | 48.1 |
| – Strength Index Reading (3 Year Range): | Bullish | Bearish | Bearish |
| NET POSITION MOVEMENT INDEX: | | | |
| – 6-Week Change in Strength Index: | -7.6 | 6.1 | 11.2 |
Bitcoin Futures:
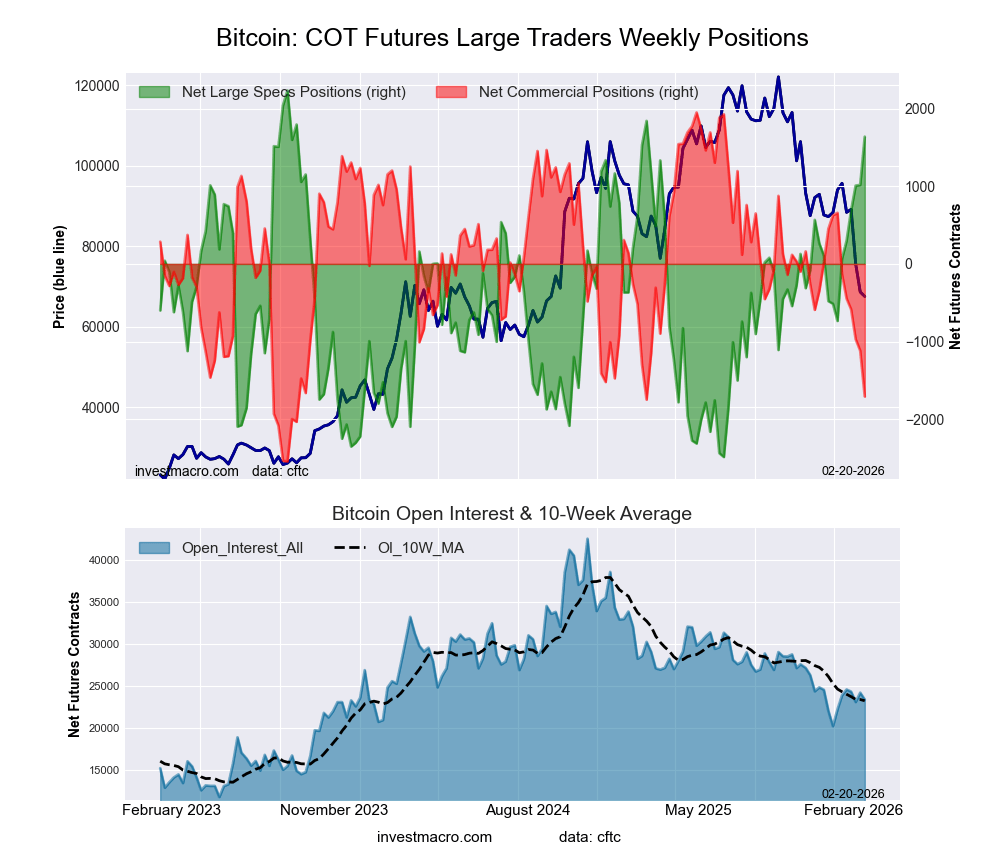 The Bitcoin large speculator standing this week reached a net position of 1,638 contracts in the data reported through Tuesday. This was a weekly lift of 621 contracts from the previous week which had a total of 1,017 net contracts.
This week’s current strength score (the trader positioning range over the past three years, measured from 0 to 100) shows the speculators are currently Bullish-Extreme with a score of 87.4 percent. The commercials are Bearish-Extreme with a score of 18.6 percent and the small traders (not shown in chart) are Bearish with a score of 40.9 percent.
Price Trend-Following Model: Strong Downtrend
Our weekly trend-following model classifies the current market price position as: Strong Downtrend.
| BITCOIN Statistics | SPECULATORS | COMMERCIALS | SMALL TRADERS |
| – Percent of Open Interest Longs: | 71.1 | 2.0 | 5.0 |
| – Percent of Open Interest Shorts: | 64.1 | 9.3 | 4.7 |
| – Net Position: | 1,638 | -1,707 | 69 |
| – Gross Longs: | 16,593 | 463 | 1,163 |
| – Gross Shorts: | 14,955 | 2,170 | 1,094 |
| – Long to Short Ratio: | 1.1 to 1 | 0.2 to 1 | 1.1 to 1 |
| NET POSITION TREND: | | | |
| – Strength Index Score (3 Year Range Pct): | 87.4 | 18.6 | 40.9 |
| – Strength Index Reading (3 Year Range): | Bullish-Extreme | Bearish-Extreme | Bearish |
| NET POSITION MOVEMENT INDEX: | | | |
| – 6-Week Change in Strength Index: | 50.3 | -52.6 | -0.4 |
Article By InvestMacro – Receive our weekly COT Newsletter
*COT Report: The COT data, released weekly to the public each Friday, is updated through the most recent Tuesday (data is 3 days old) and shows a quick view of how large speculators or non-commercials (for-profit traders) were positioned in the futures markets.
The CFTC categorizes trader positions according to commercial hedgers (traders who use futures contracts for hedging as part of the business), non-commercials (large traders who speculate to realize trading profits) and nonreportable traders (usually small traders/speculators) as well as their open interest (contracts open in the market at time of reporting). See CFTC criteria here.