By InvestMacro
The latest update for the weekly Commitment of Traders (COT) report was released by the Commodity Futures Trading Commission (CFTC) on Friday for data ending on Tuesday June 23rd.
This weekly Extreme Positions report highlights the Most Bullish and Most Bearish Positions for the speculator category and is a current snapshot of how speculators were positioned as of Tuesday. Extreme positioning in these markets can foreshadow strong moves in the underlying market.
To signify an extreme position, we use the Strength Index (also known as the COT Index) of each instrument, a common method of measuring COT data. The Strength Index is simply a comparison of current trader positions against the range of positions over the previous 3 years. We use over 80 percent as extremely bullish and under 20 percent as extremely bearish (Compare Strength Index scores across all markets in the data table or cot leaders table).
The 6-WK Trend score is the change in the Strength Index over the past 6 weeks and signals how strong and which way the Strength Index is going.
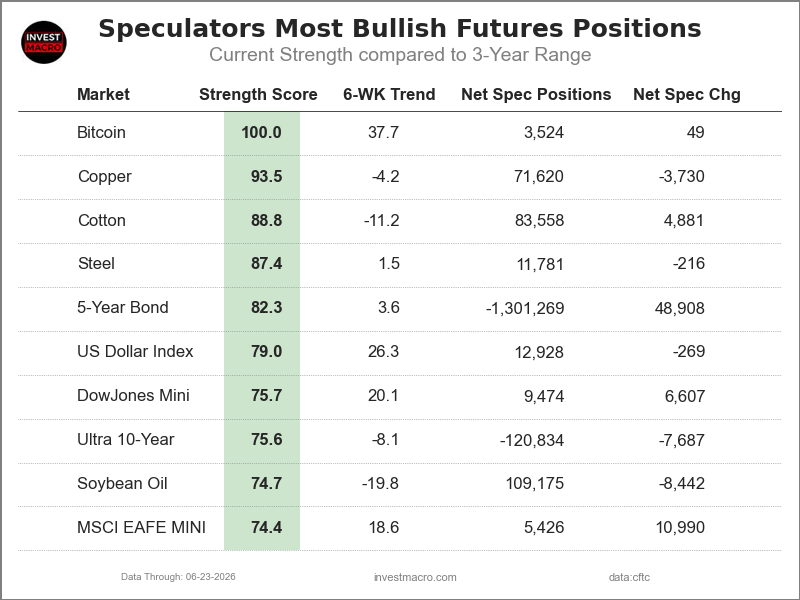
Here Are This Week’s Most Bullish Speculator Positions:
Bitcoin
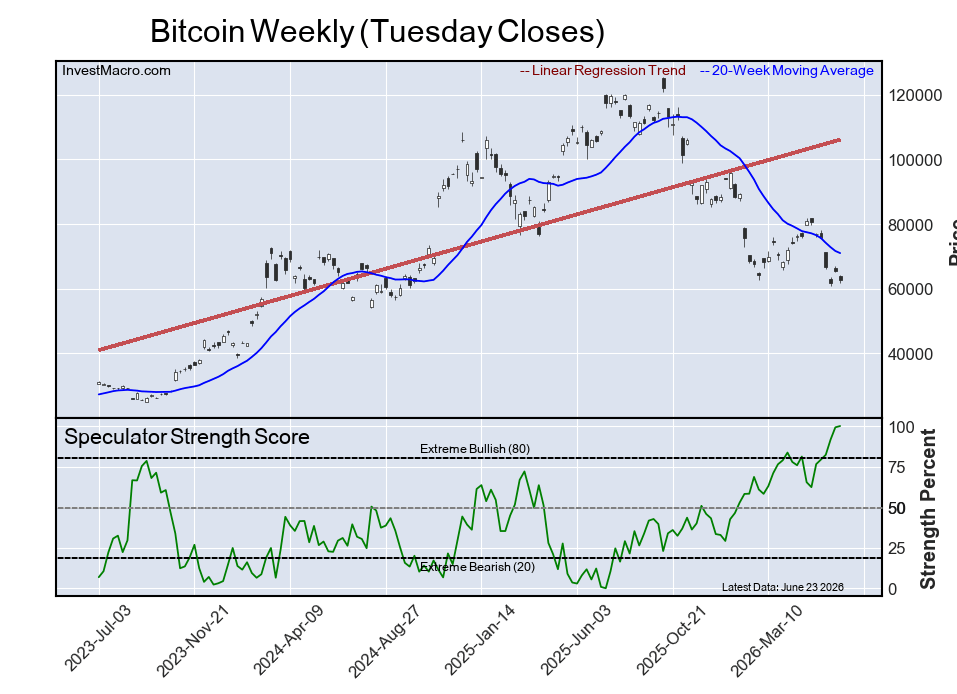
The Bitcoin speculator position comes in as the most bullish extreme standing this week as the speculators tend to use the futures as a hedging instrument for Bitcoin. The Bitcoin speculator level is currently at a 100 percent score of its 3-year range.
The six-week trend for the percent strength score totaled a rise higher by 38 percentage points this week while the overall net speculator position was a total of 3,524 net contracts this week with an increase of 49 contract in the weekly speculator bets.
Speculators or Non-Commercials Notes:
Speculators, classified as non-commercial traders by the CFTC, are made up of large commodity funds, hedge funds and other significant for-profit participants. The Specs are generally regarded as trend-followers in their behavior towards price action – net speculator bets and prices tend to go in the same directions. These traders often look to buy when prices are rising and sell when prices are falling. To illustrate this point, many times speculator contracts can be found at their most extremes (bullish or bearish) when prices are also close to their highest or lowest levels.
These extreme levels can be dangerous for the large speculators as the trade is most crowded, there is less trading ammunition still sitting on the sidelines to push the trend further and prices have moved a significant distance. When the trend becomes exhausted, some speculators take profits while others look to also exit positions when prices fail to continue in the same direction. This process usually plays out over many months to years and can ultimately create a reverse effect where prices start to fall and speculators start a process of selling when prices are falling.
Copper
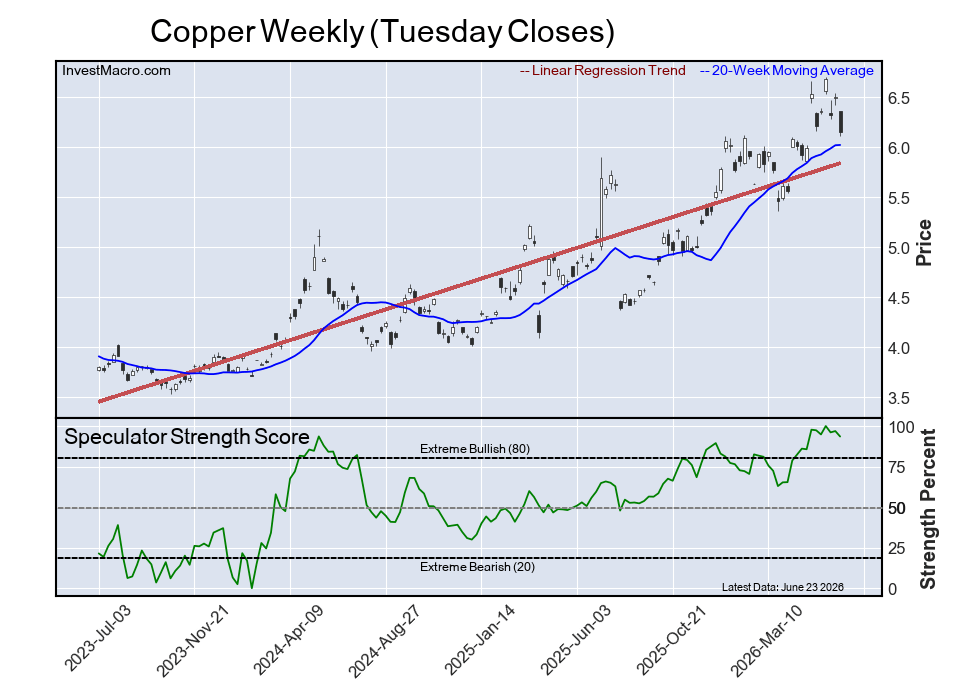
The Copper speculator position comes next in the extreme standings this week with the Copper speculator level now at a 94 percent score of its 3-year range.
The six-week trend for the percent strength score was a decline of -4 percentage points this week. The speculator position registered 71,620 net contracts this week with a decrease of -3,730 contracts in speculator bets.
Cotton
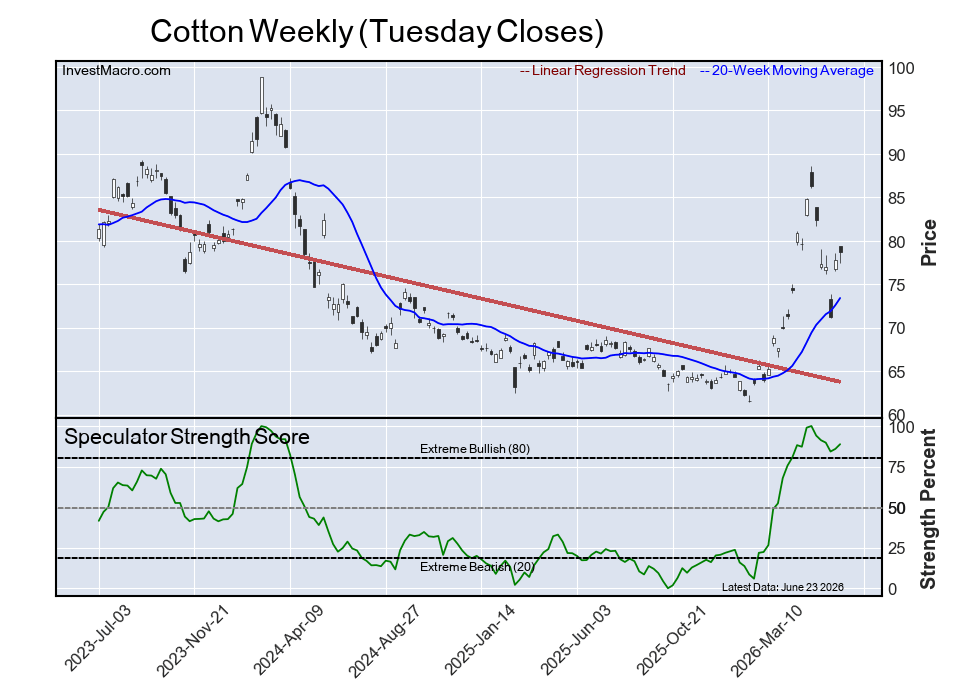
The Cotton speculator position comes in third this week in the extreme standings as the Cotton speculator level resides at a 89 percent score of its 3-year range.
The six-week trend for the speculator strength score came in at a decline of -11 percentage points this week and the overall speculator position was 83,558 net contracts this week with an increase of 4,881 contracts in the weekly speculator bets.
Steel
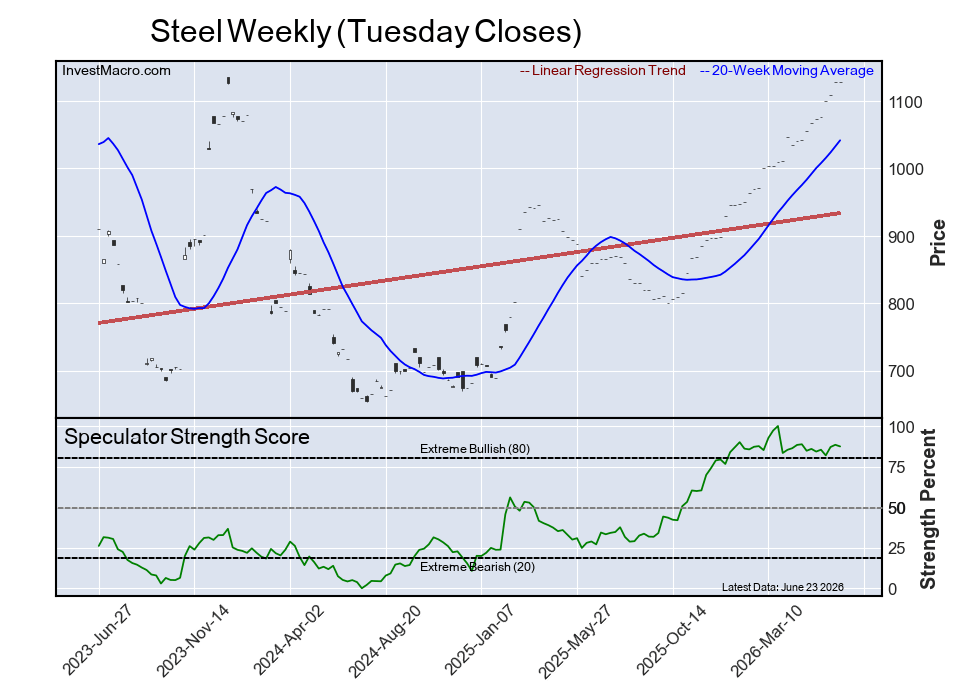
The Steel speculator position comes up number four in the extreme standings this week as the Steel speculator level is currently at an 87 percent score of its 3-year range.
The six-week trend for the speculator strength score totaled a boost of 2 percentage points this week while the overall speculator position was 11,781 net contracts this week with a decline of -216 contracts in the speculator bets.
5-Year Bond
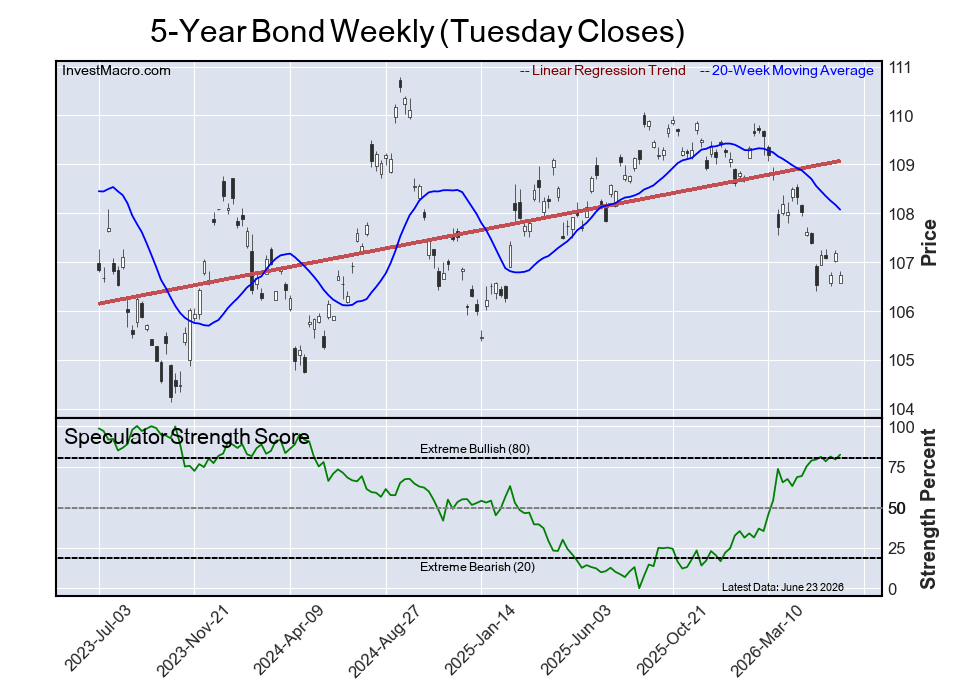
The 5-Year Bond speculator position rounds out the top five in this week’s bullish extreme standings with the 5-Year speculator level sitting at a 82 percent score of its 3-year range. The six-week trend for the speculator strength score was an advance by 4 percentage points this week.
The speculator position was -1,301,269 net contracts this week with a rise of 48,908 contracts in the weekly speculator bets.
The Most Bearish Speculator Positions of the Week:
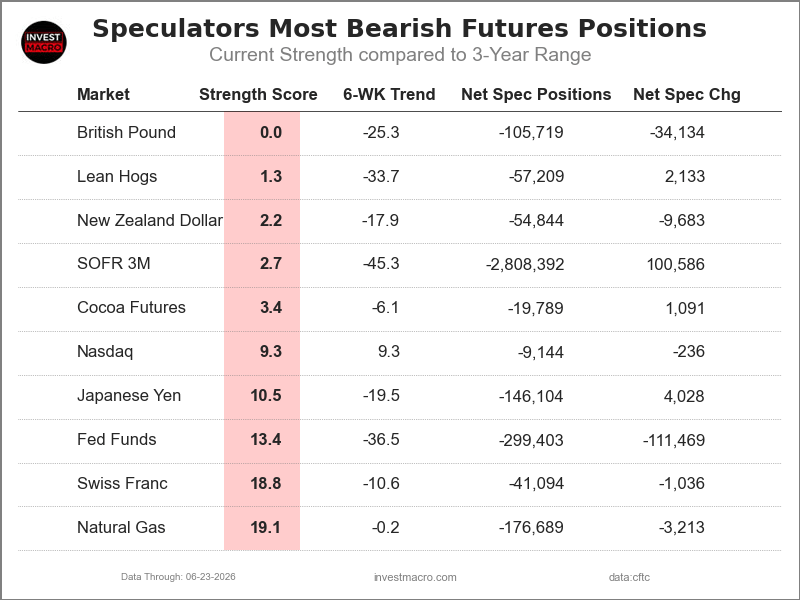
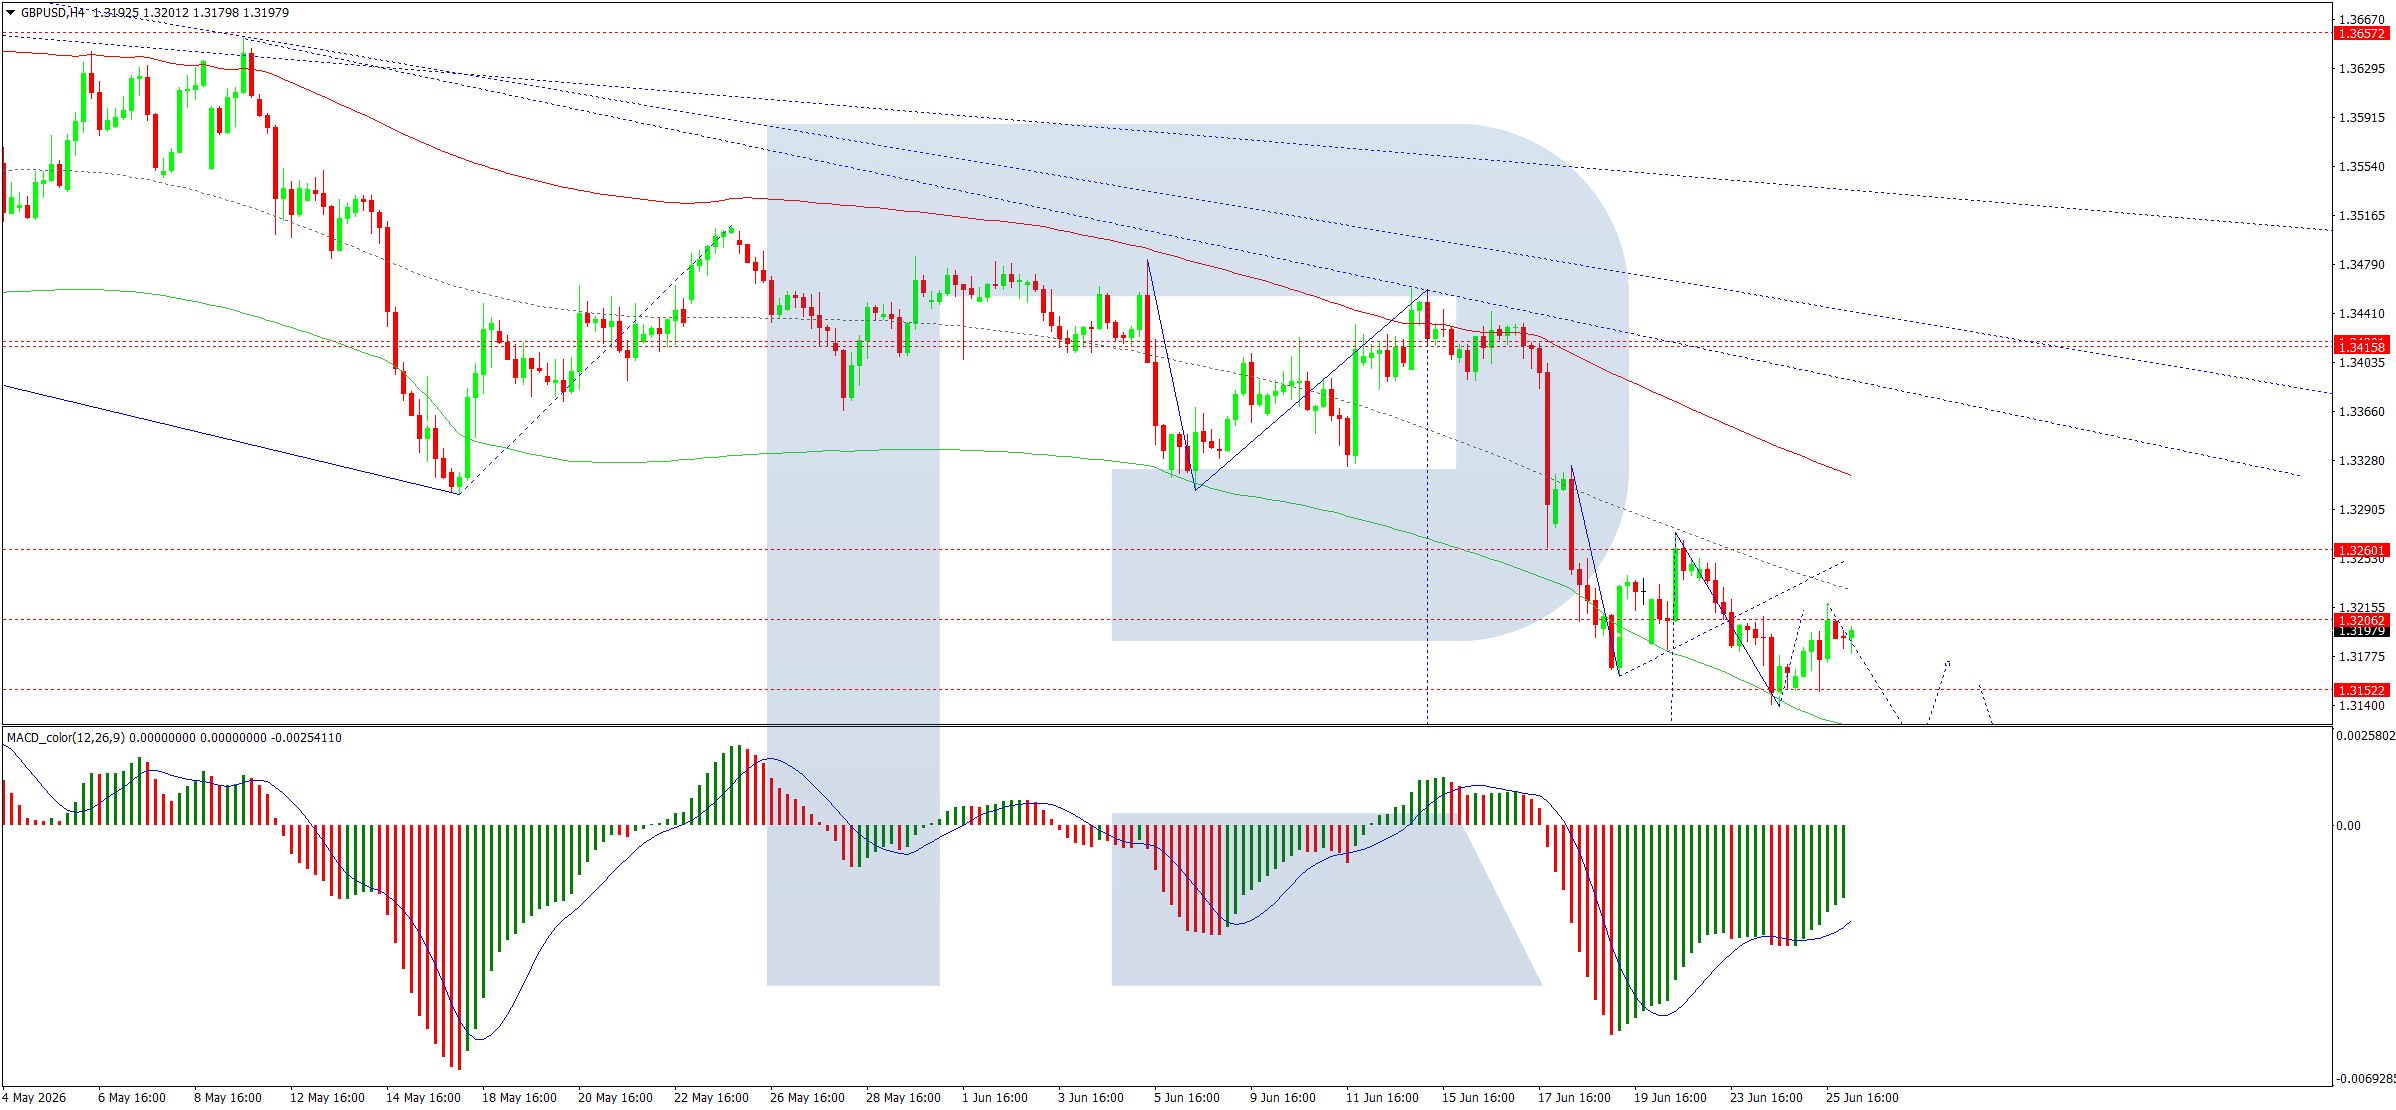
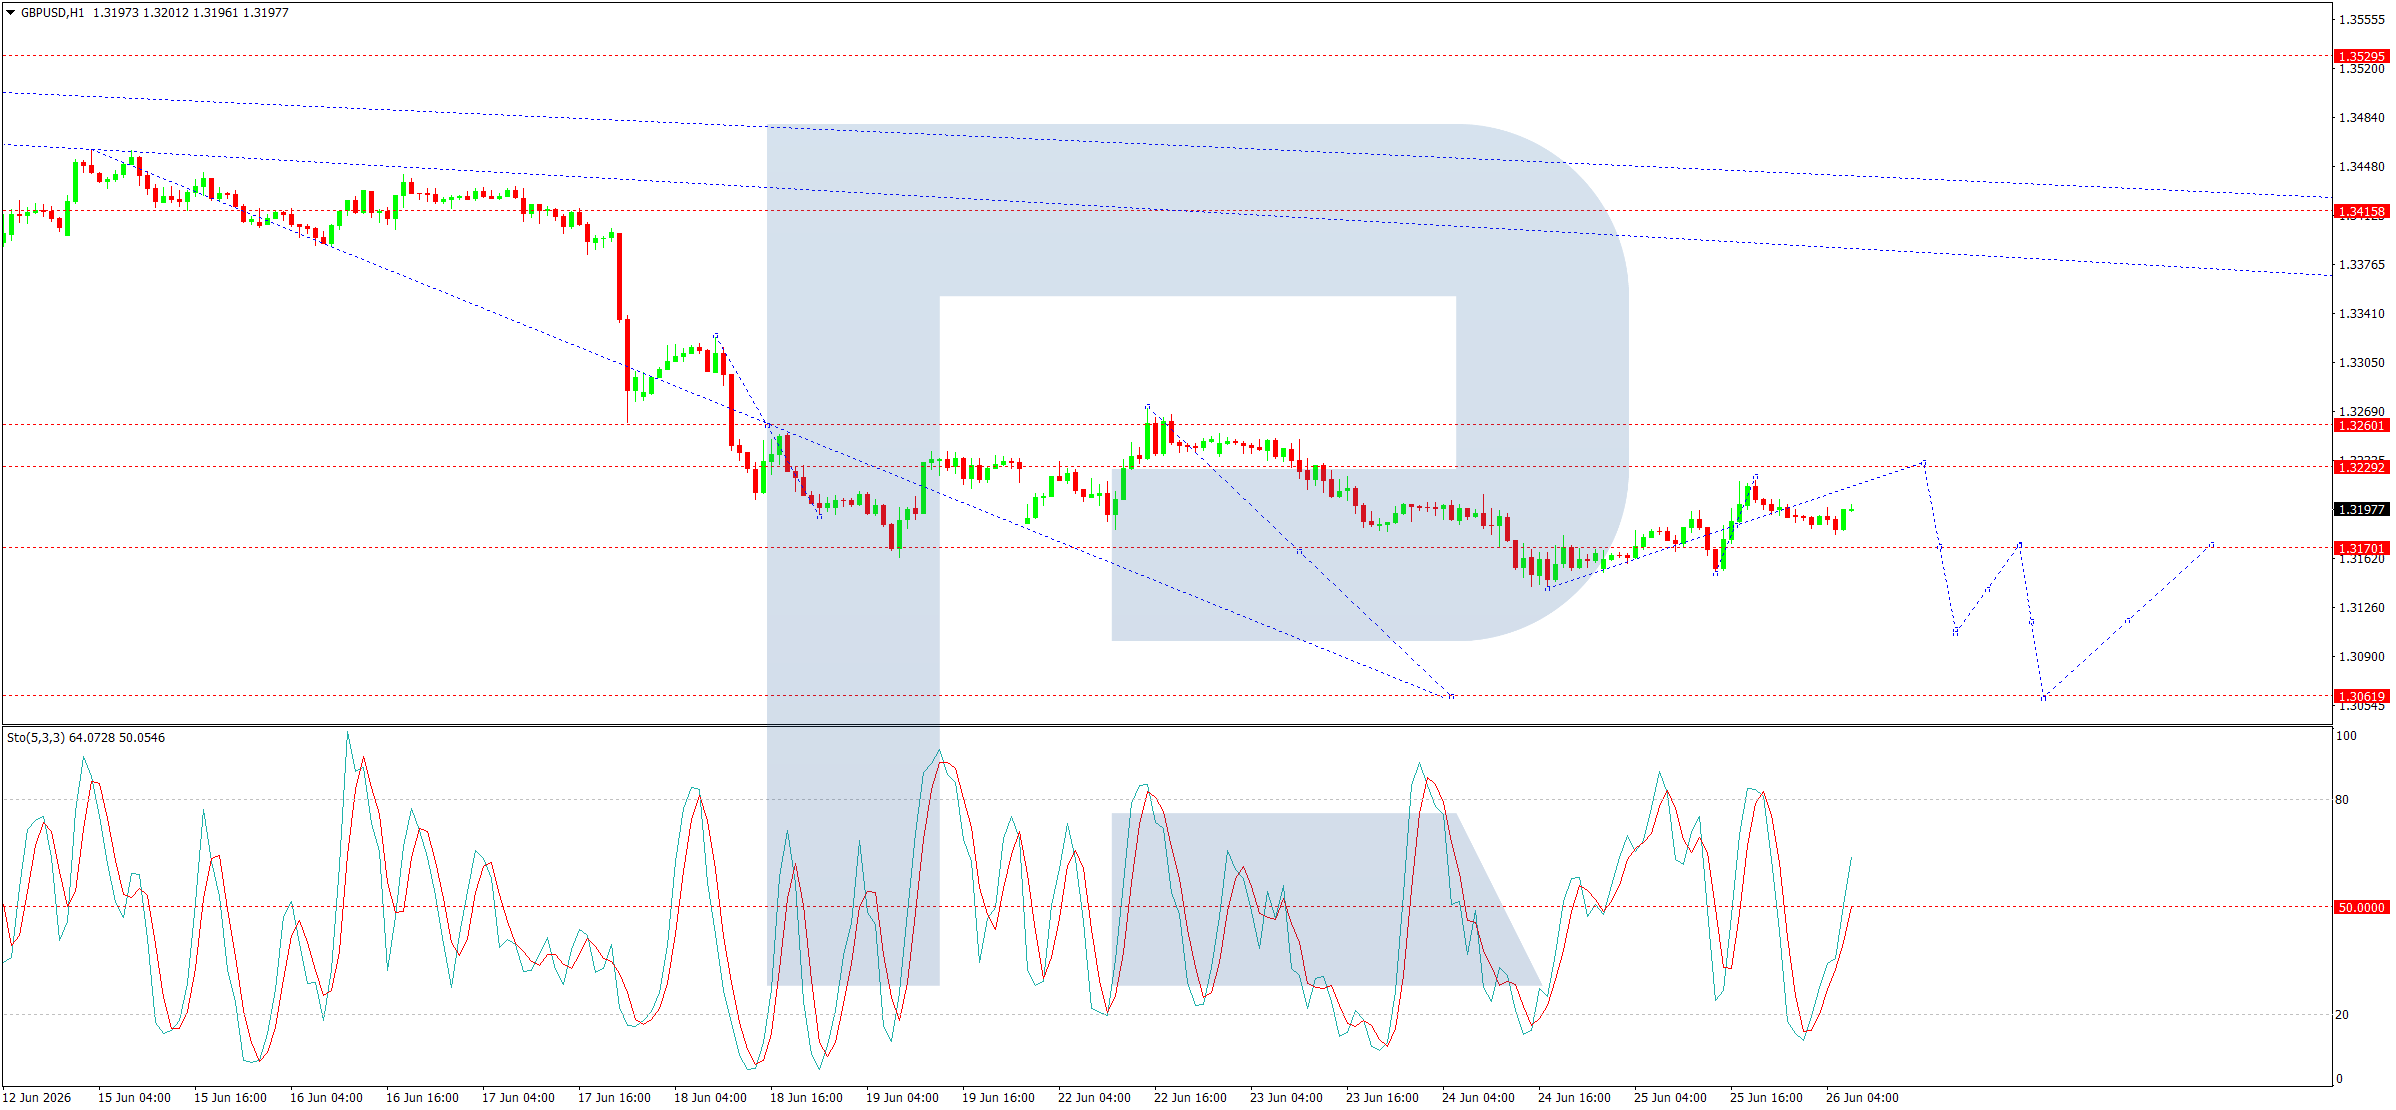
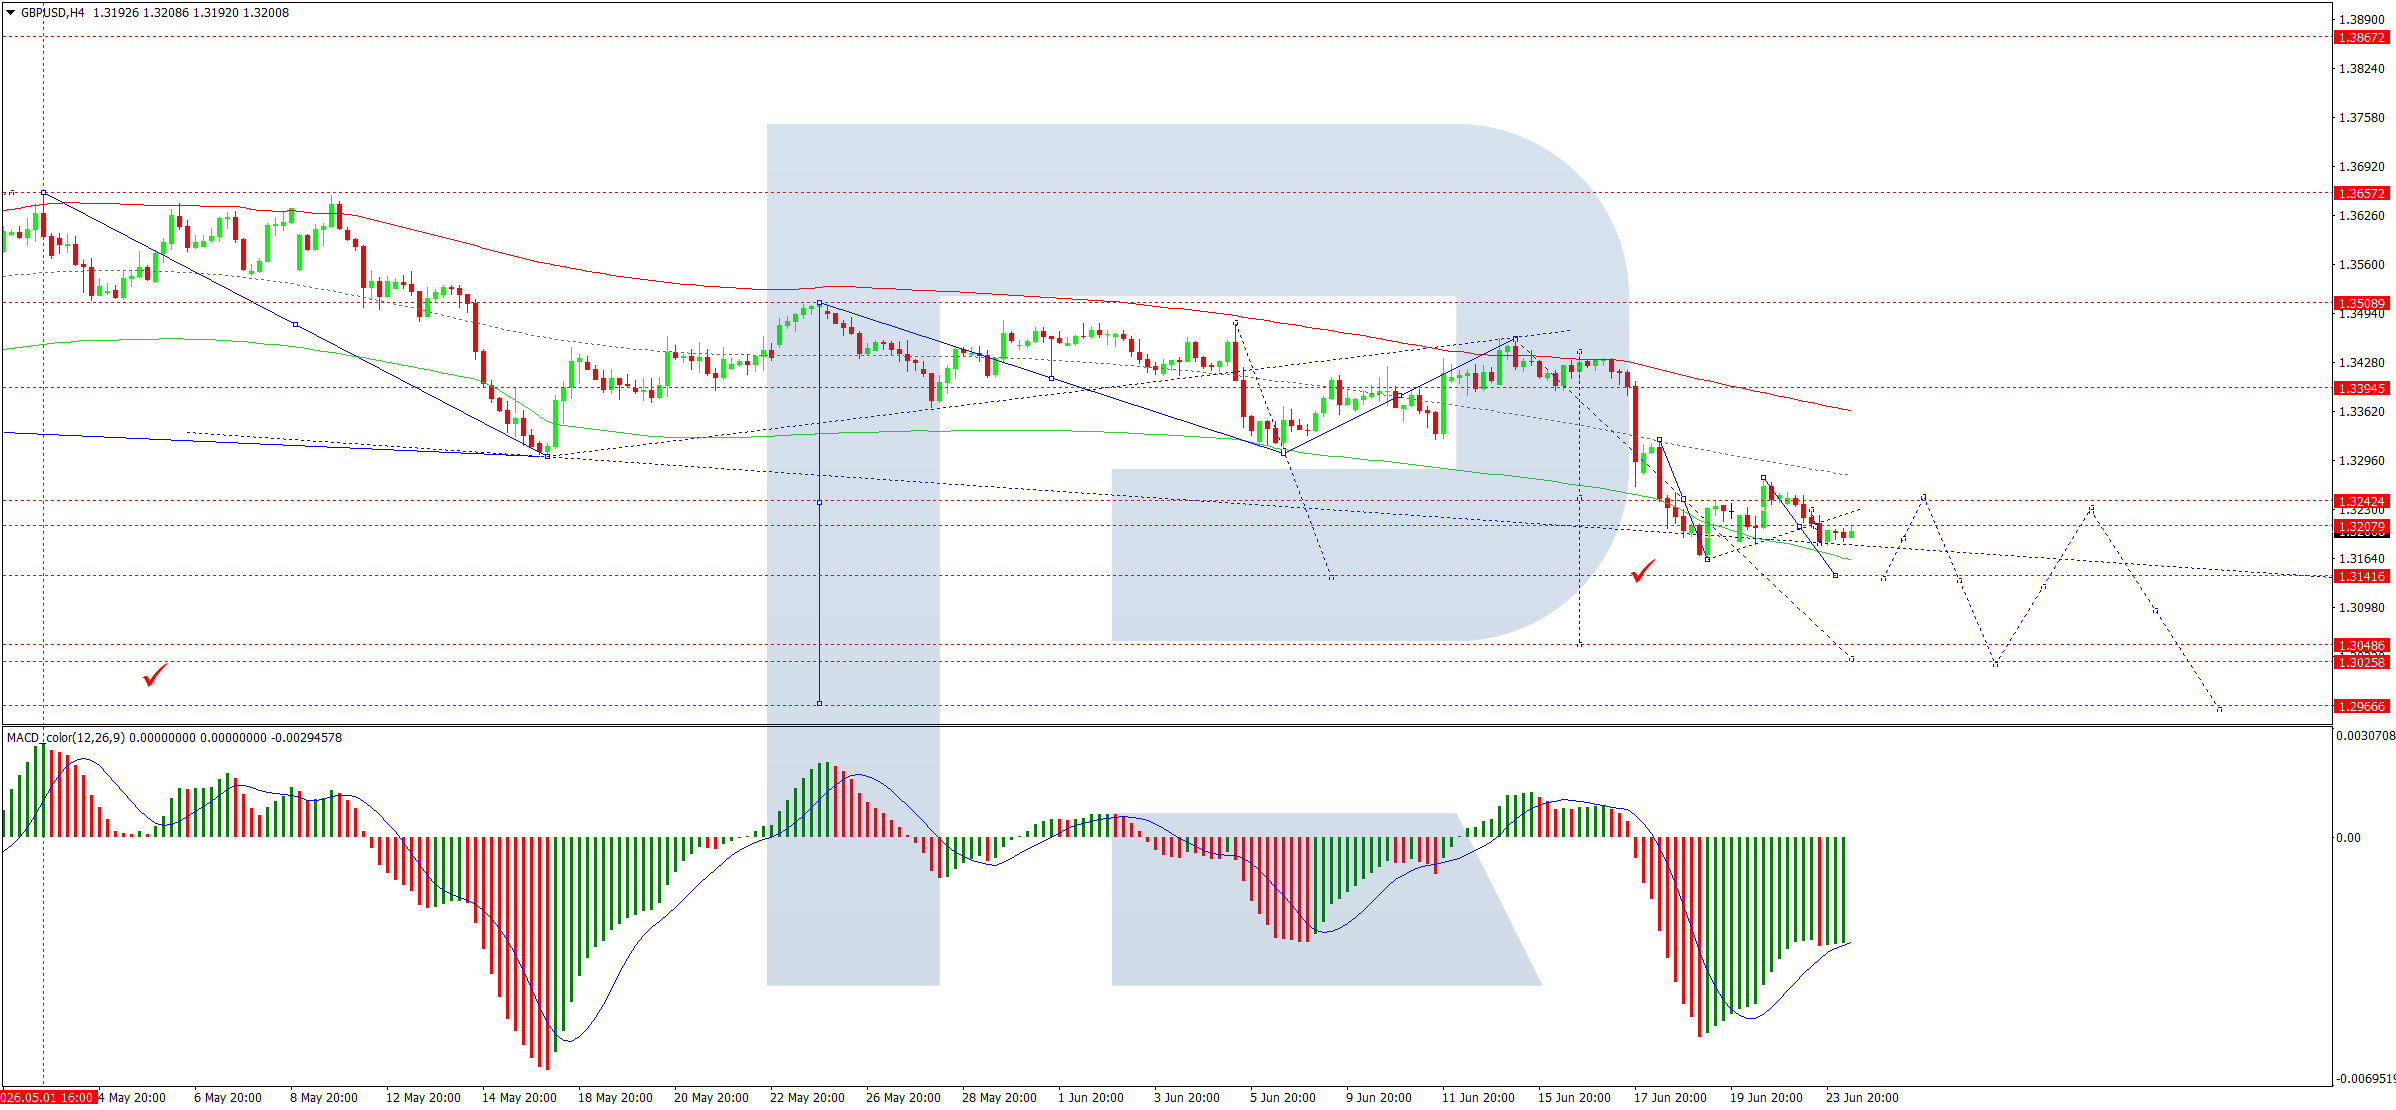
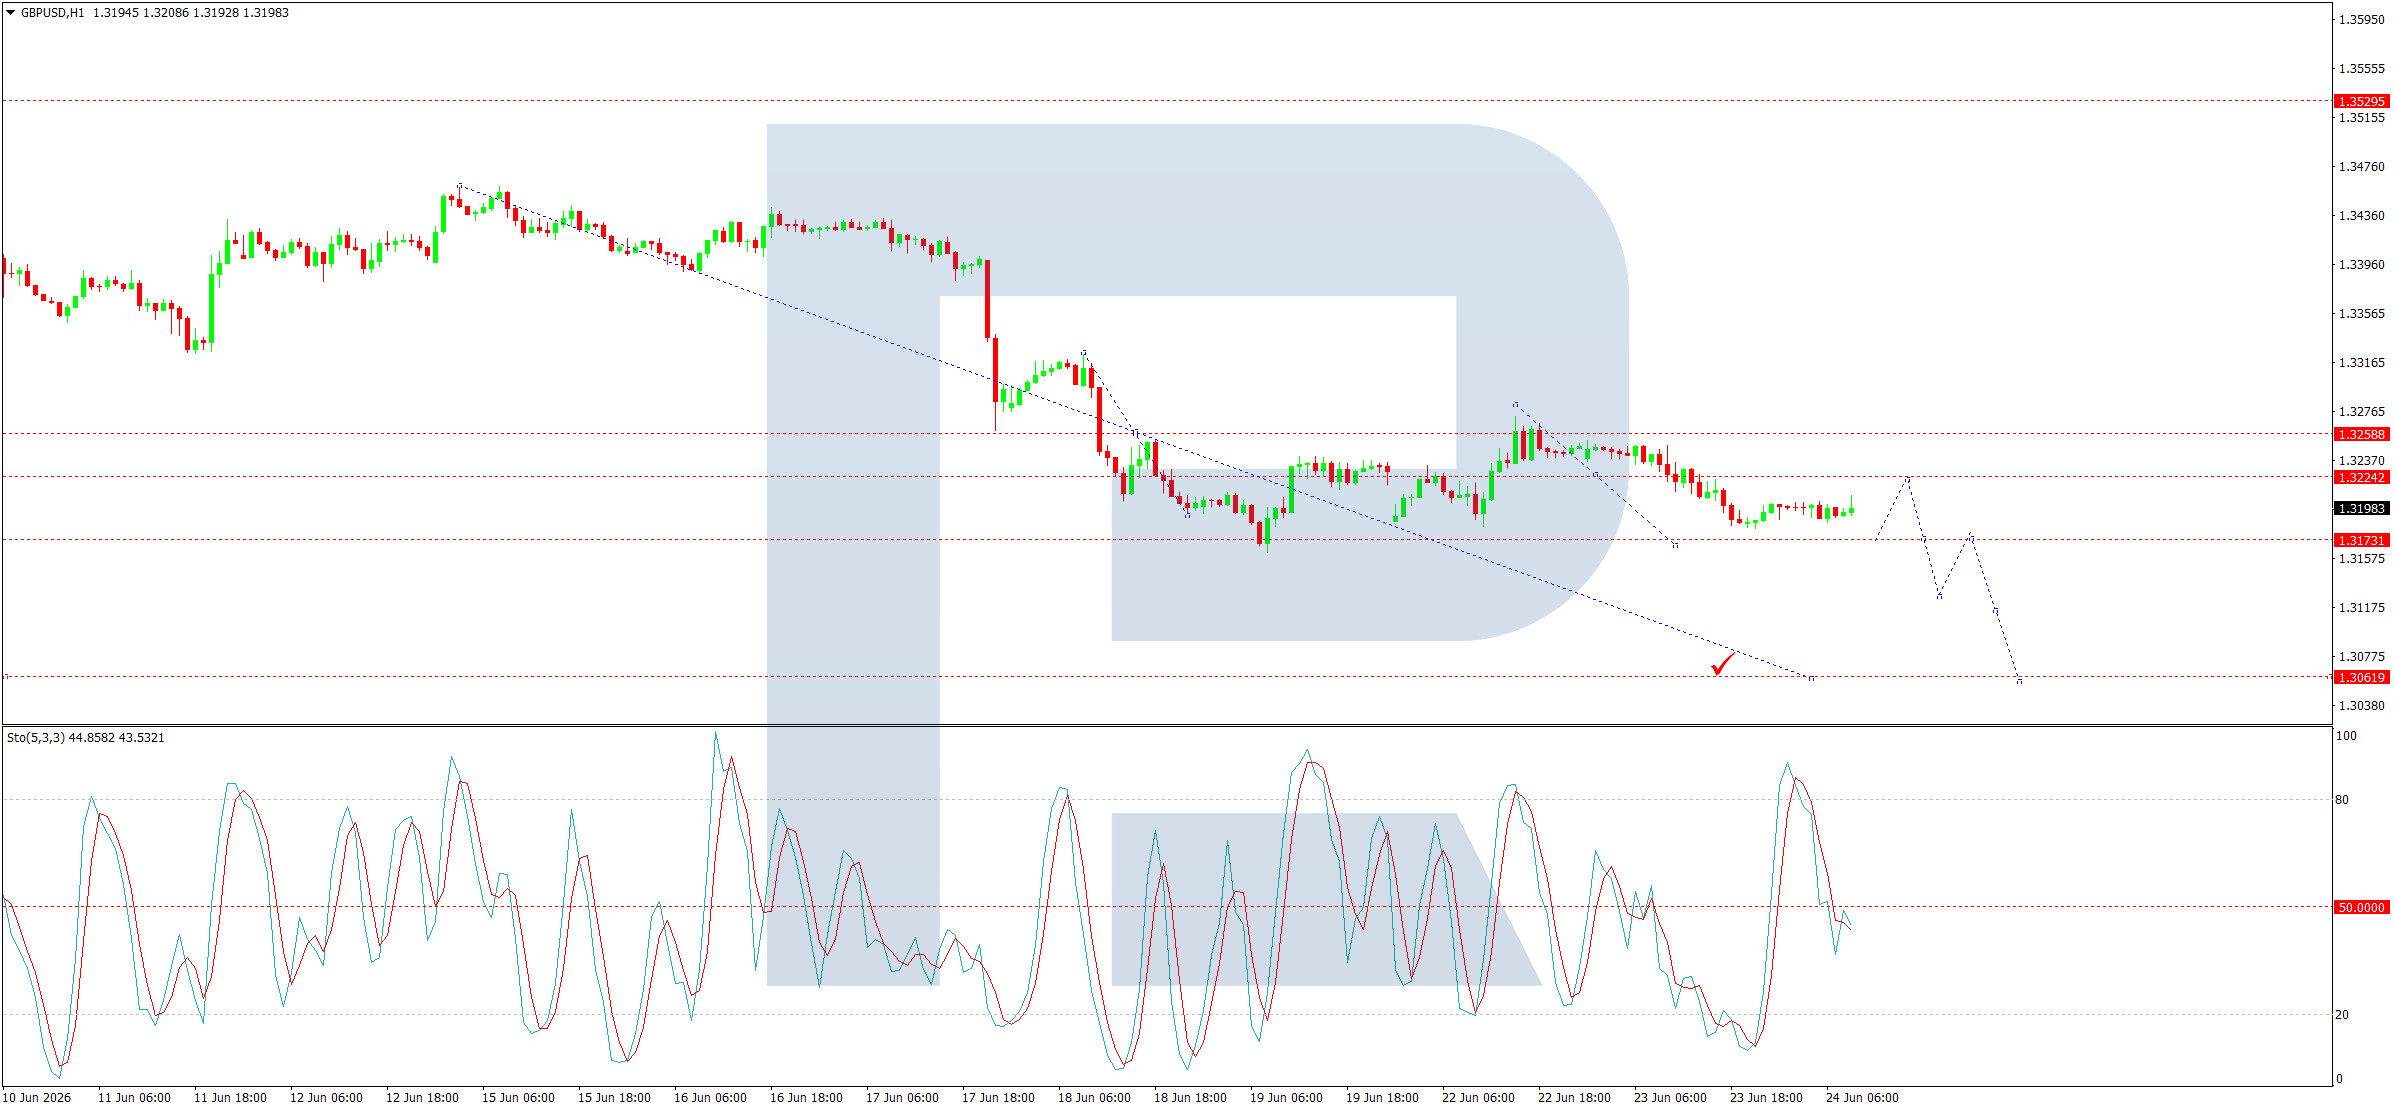
British Pound
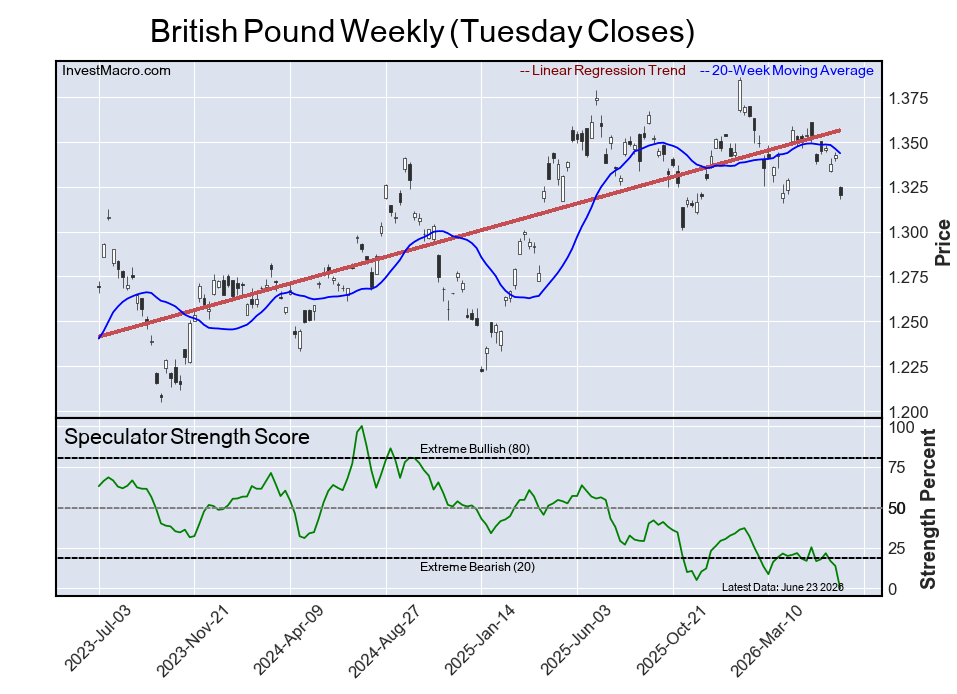
The British Pound speculator position comes in as the most bearish extreme standing this week as the GBP speculator level is at a 0 percent minimum score of its 3-year range.
The six-week trend for the speculator strength score was a decrease by -25 percentage points this week and the overall speculator position was -105,719 net contracts this week with a retreat of -34,134 contracts in the speculator bets.
Lean Hogs
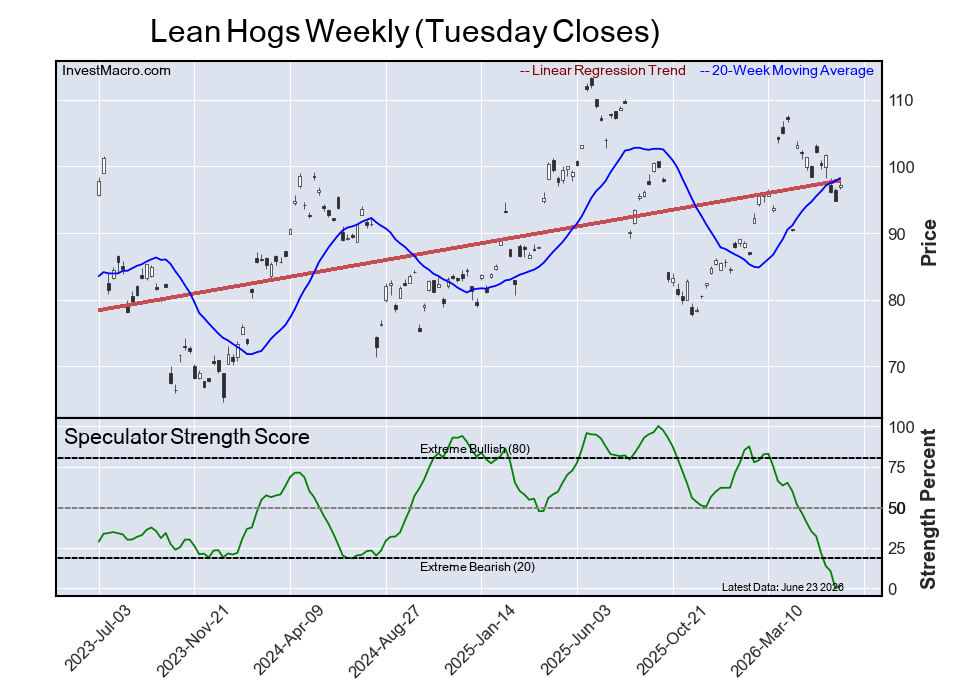
The Lean Hogs speculator position comes in second for the most bearish extreme standing on the week with the Lean Hogs speculator level at a 1 percent score of its 3-year range.
The six-week trend for the speculator strength score was a retreat of -34 percentage points this week while the speculator position was -57,209 net contracts this week with a rise of 2,133 contracts in the weekly speculator bets.
New Zealand Dollar
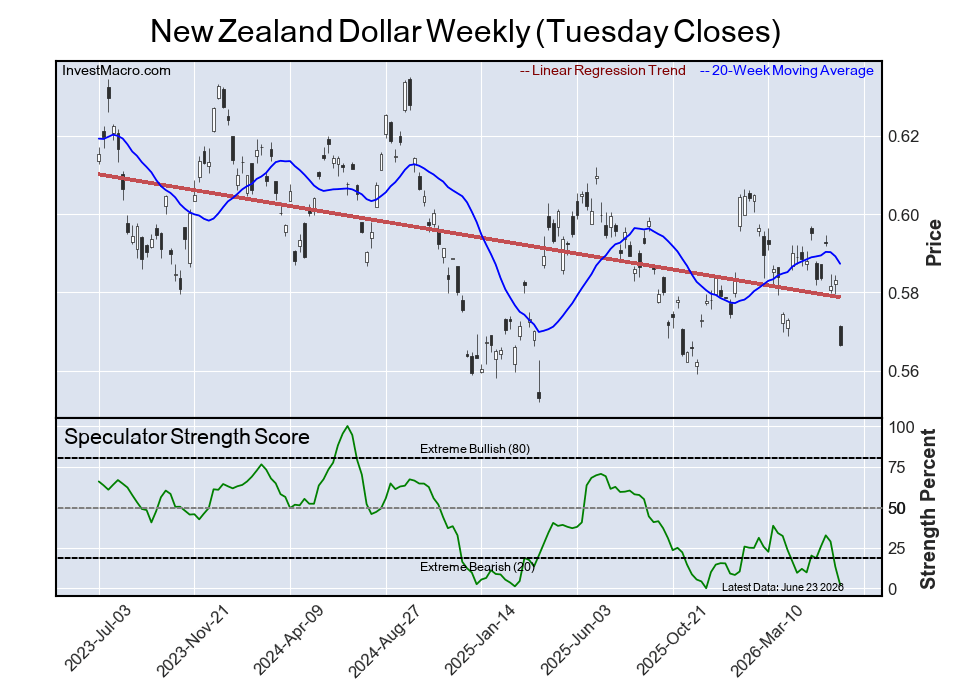
The New Zealand Dollar speculator position comes in as third most bearish extreme standing of the week. The NZD speculator level resides at a 2 percent score of its 3-year range.
The six-week trend for the speculator strength score was a decrease by -18 percentage points this week and the overall speculator position was -54,844 net contracts this week with a decline of -9,683 contracts in the speculator bets.
Cocoa Futures
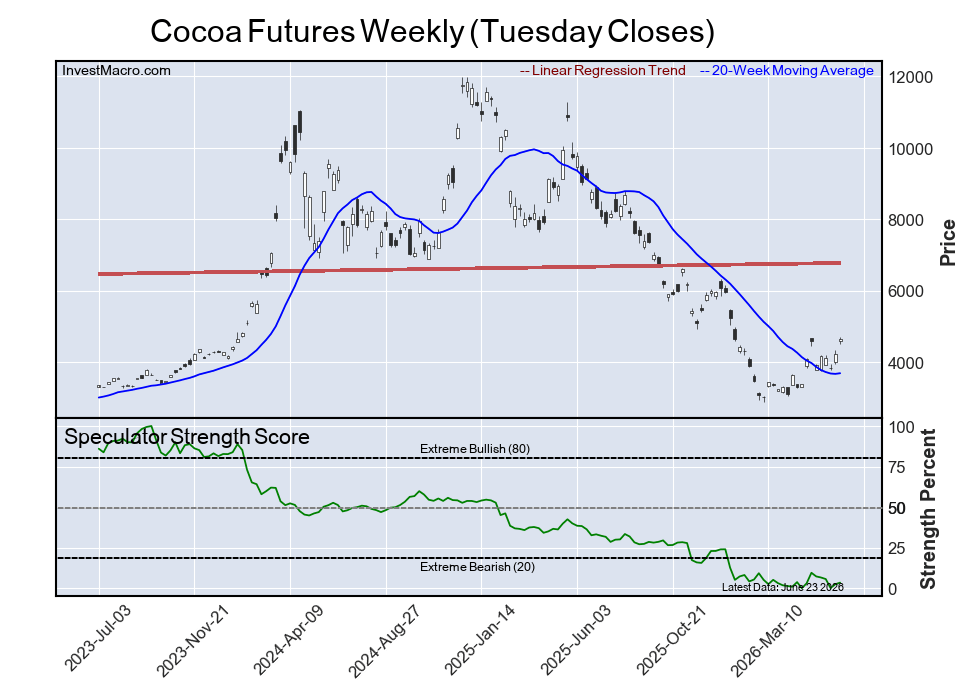
The Cocoa Futures speculator position comes in as this week’s fourth most bearish extreme standing as the Cocoa speculator level is at just a 3 percent score of its 3-year range.
The six-week trend for the speculator strength score was a retreat of -6 percentage points this week and the speculator position was -19,789 net contracts this week with an advance of 1,091 contracts in the weekly speculator bets.
3-Month Secured Overnight Financing Rate
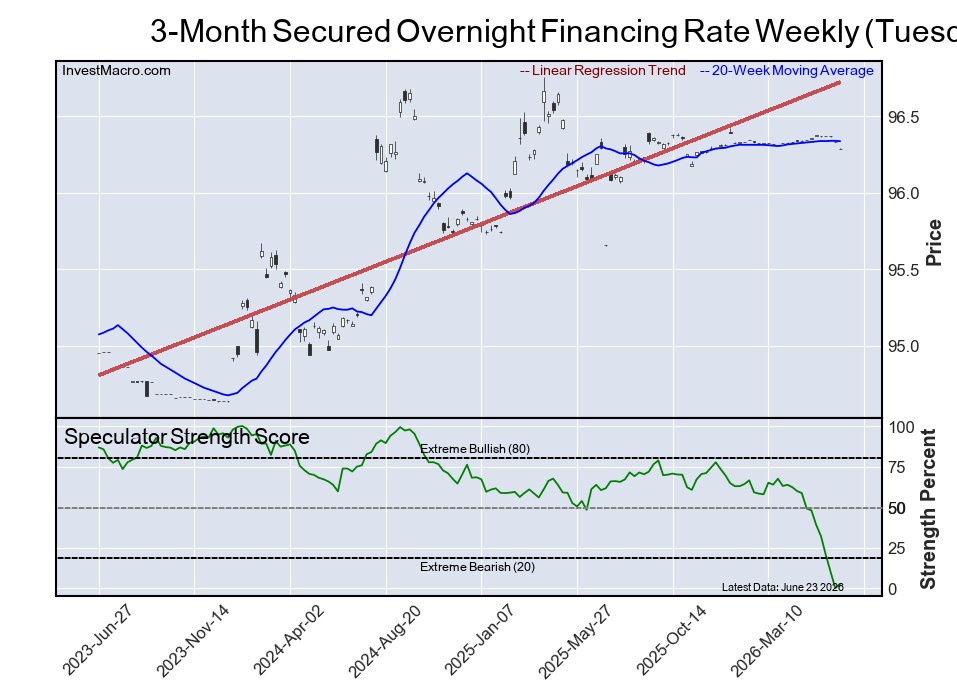
Lastly, the 3-Month Secured Overnight Financing Rate speculator position comes in as the fifth most bearish extreme standing for this week with the SOFR 3-Months speculator level at a 3 percent score of its 3-year range.
The six-week trend for the speculator strength score was a decrease by -45 percentage points this week while the speculator position was -2,808,392 net contracts this week with an addition of 100,586 contracts in the weekly speculator bets.
Article By InvestMacro – Receive our weekly COT Reports by Email
*COT Report: The COT data, released weekly to the public each Friday, is updated through the most recent Tuesday (data is 3 days old) and shows a quick view of how large speculators or non-commercials (for-profit traders) were positioned in the futures markets.
The CFTC categorizes trader positions according to commercial hedgers (traders who use futures contracts for hedging as part of the business), non-commercials (large traders who speculate to realize trading profits) and nonreportable traders (usually small traders/speculators) as well as their open interest (contracts open in the market at time of reporting).See CFTC criteria here.
All information and opinions on this website and contained in this article are for general informational purposes only and do not constitute investment advice.


 The Dames Point Bridge spans a river in Jacksonville, Fla.


