Two important events for oil markets today

By Han Tan Chief Market Analyst at Exinity Group

Oil markets will be closely monitoring these events on this final day of March:

  1. OPEC+ meeting

    This alliance of 23 oil-producing nations are set to decide how much more oil to pump out and export to the world for May 2022.

    OPEC+ had been gradually raising output by an additional 400,000 barrels per day each month. They’re widely expected to decide the same today for May’s output levels.

    And today’s meeting could be another quickie. Their previous meeting held online earlier this month lasted just 13 minutes. So blink and you could miss it. 

  2. US President Joe Biden may announce the release of 180 million barrels (or 1 million barrels a day) of oil from US strategic reserves.

    Such a move is intended to bring down gasoline prices in the US.

    A release of 180 million barrels, spread out over the coming months, would be significantly larger than the previous two releases from US strategic reserves (30 million announced  in March 2022, and 50 million in November 2021).

    Those two previous announcements had little impact on oil markets given their relatively small size.

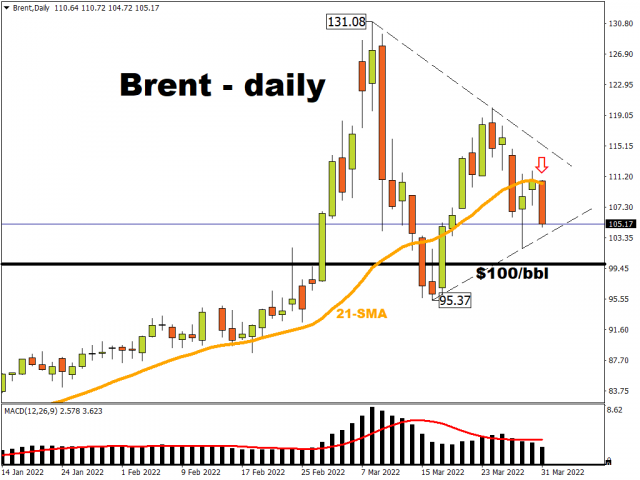
Both US crude and Brent oil prices are pulling back by over 5% today at the mere suggestion that more US oil could flood the markets.
 

Let’s go back to some basic economics to understand to better understand why oil prices are reacting this way today and why these events matter for markets.

Here’s how supply and demand impacts prices:

  • When supply falls short of demand (scarcity), prices tend to rise.
  • When there’s an oversupply (supply exceeds demand), prices tend to fall.

Why have oil prices been surging?

The main reason why oil prices have been skyrocketing in recent months is because there is not enough supply to meet the world’s demand for oil.

The world is clamouring for more oil as the global economy continues recovering from the pandemic (more people are jetting off on vacations abroad, daily commutes to work/school runs/social gatherings are ramping up, more of the world’s factories are coming back online, etc.)

According to the IEA, global demand for oil is just a couple million barrels short of pre-pandemic levels of around 100 million bpd.

But oil has been hard to find, due to:

  • Russian oil being sanctioned by the US and the UK.

Although the EU has refrained from such a drastic move for the time being, such a risk could resurface the longer the Ukraine invasion continues. As things stand, Russian oil is already struggling to find buyers around the world, as countries fear the potential repercussions of sanctions.

  • Lack of spare capacity at OPEC+ members.

Years of underinvestment as well as political instability have led to a severe lack of spare capacity for oil-production in countries such as Nigeria, Angola and Libya. Only the likes of Saudi Arabia, the UAE, and Iraq have sizeable spare capacity of a combined 3 million barrels per day or so.

  • But OPEC+ may not be able to pump out more even if they wanted to due to political sensitivities.

Given Russia’s status as an influential member within OPEC+, the alliance may not want to invoke Russia’s wrath by pumping out more oil. Raising the collective OPEC+ output would be seen as bowing to pressure from the US administration. After all, President Biden had attempted (unsuccessfully) since last year to encourage OPEC+ to pump more oil to bring prices down.

How would this reported US strategic reserves release impact prices?

If White House unleashes 180 million barrels into the US economy, that means there is more incoming supply to meet demand.

This brings prices into more of an equilibrium and helps prices moderate (as we’re witnessing now).

Of course, the exact details have yet to be announced. But given the markets’ forward-looking nature, traders tend to react first based on assumptions.

And whether prices can stay at these levels very much depends on the details released by the White House.

  • If the headline figure is significantly LESS than 180 million barrels, then oil prices could swiftly rebound (less incoming supply than expected, meaning demand still exceeds supply)
  • If the headline figure is significantly MORE than 180 million barrels (after all, the US has about 568 million barrels of oil in its strategic reserves), then prices could fall even further!
  • Markets will also want to see whether the White House intends to replenish its strategic reserves.

    If markets discover that the US government will be forced later to buy back what oil it had already unleashed from its strategic reserves, then that might only have a fleeting impact on prices.

    In other words, if markets get the sense that this extra supply is only a temporary band-aid, and not a lasting solution, then Brent and US crude prices could look past today’s announcement (again, forward-looking) and may not stay down for long.

Also, note that such a move by the White House may also put the pressure on other US allies around the world, such as the UK, Japan, and South Korea to release oil from their respective strategic reserves as well.

Although these non-US amounts will likely be a lot smaller, such a coordinated move could offer more relief to a world that’s desperate for more oil, while helping prices moderate lower.

But a massive release from the US strategic reserves could in turn trigger a response from OPEC+.

To be clear, OPEC+ today is widely expected to stick with its “gradual” approach to restoring oil output (400k bpd hike per month).

Still, the alliance has built a penchant for making shock announcements since the pandemic.

A shock OPEC+ announcement today, or at the next meeting, to halt its pans to raise output could see prices recovering sharply upwards (less supply to meet global demand).

Overall, we still find ourselves in a world where there still isn’t enough oil to meet global demand.

And that should keep oil prices supported around $100, barring a major shocker today.

However, if either the OPEC+ decision or the White House announcement today upends that global supply-demand calculation, that could inject even more volatility into oil prices as we enter the second quarter of what has already been an eventful 2022.


Disclaimer: The content in this article comprises personal opinions and should not be construed as containing personal and/or other investment advice and/or an offer of and/or solicitation for any transactions in financial instruments and/or a guarantee and/or prediction of future performance. ForexTime (FXTM), its affiliates, agents, directors, officers or employees do not guarantee the accuracy, validity, timeliness or completeness, of any information or data made available and assume no liability as to any loss arising from any investment based on the same.


Forex-Time-LogoArticle by ForexTime

ForexTime Ltd (FXTM) is an award winning international online forex broker regulated by CySEC 185/12 www.forextime.com

“Buy on the cannons, sell on the trumpets”?

By The Market Research Team, ForexTime

This well-worn phrase is meant to go back to the early 1800s and is attributed to London financier Lord Rothschild which suggests that the start of a war is a good time to invest in the stock market. Conversely, the end of a war is a good time to sell. We saw a lot of optimism in risk sentiment yesterday about the potential progress in peace talks, but markets are more circumspect this morning, especially Western governments around any possible Russian de-escalation.

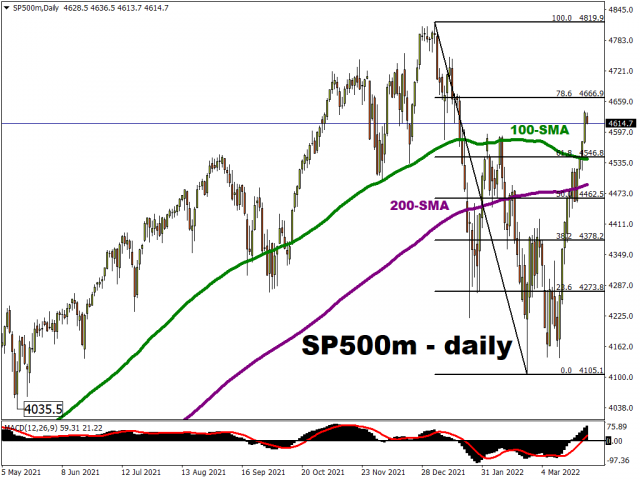
Interestingly, if we look at US equities, then the bottom in the S&P 500 was exactly on the first day of the Russian invasion in late February. The index has climbed over 12% since then, through both the 200-day simple moving average at 4491.3 and more recently the 100-day at 4542.1.

Is it time to sell the news?

The next resistance is the last major Fibonacci level, the 78.6% retracement of this year’s high to low move, at 4666.9. Support should initially come at the long-term moving averages.

We note that Wall Street’s “fear gauge”, the VIX, has dropped significantly lower that it was a week before the invasion when markets were priced on the assumption that there would be no war. The relatively smooth downward course of this indicator is also grabbing some analysts’ attention.

In short, stock traders are behaving like they were given a clear reason two or three weeks ago that the market was going to be fine.


Dollar slumps as euro surges

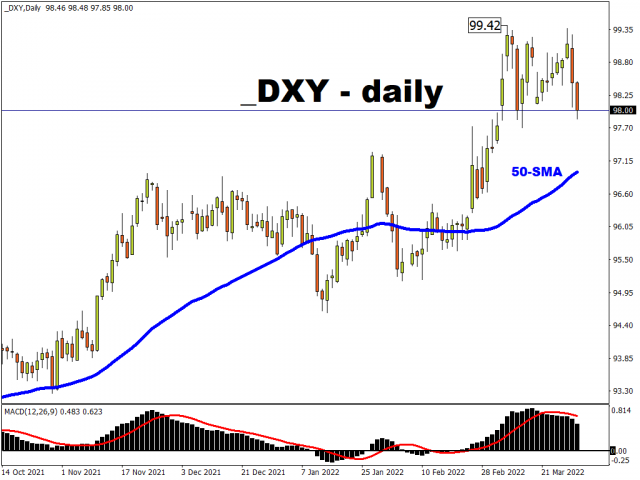
Yesterday’s big FX moves saw some unwinding of defensive long dollar positions. The buck has been sold over the past few sessions after closing in on 100 and the year-to-date high at 99.42 on the DXY.

At some point, traders will pay more attention to interest rate differentials which is normally a key driver for FX price action. This means buyers could emerge for the greenback thanks to the Fed accelerating the pace of their tightening of interest rates and policy stimulus.

We get ADP payrolls today as a forerunner to the nonfarm payrolls data and both are expected to support bigger near-term Fed rate hikes.

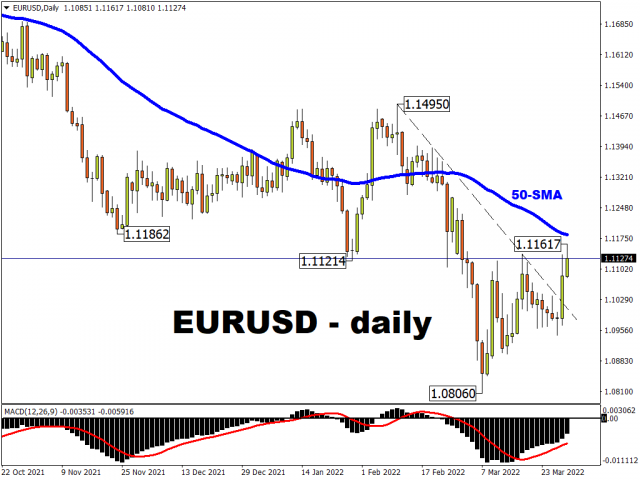
That said, EUR/USD is continuing to move north today amid rising German inflation driven by higher energy prices. This may be keeping alive the market’s expectations for ECB tightening, with around 60bps worth of rate hikes priced by money markets by the end of the year.

The major has broken the near-term downward trendline from the February highs. Prices are currently trading just around the halfway point of that move at 1.1150. Next resistance is the 50-day simple moving average at 1.11834 and the November low at 1.11862.


Disclaimer: The content in this article comprises personal opinions and should not be construed as containing personal and/or other investment advice and/or an offer of and/or solicitation for any transactions in financial instruments and/or a guarantee and/or prediction of future performance. ForexTime (FXTM), its affiliates, agents, directors, officers or employees do not guarantee the accuracy, validity, timeliness or completeness, of any information or data made available and assume no liability as to any loss arising from any investment based on the same.


Forex-Time-LogoArticle by ForexTime

ForexTime Ltd (FXTM) is an award winning international online forex broker regulated by CySEC 185/12 www.forextime.com
Putin’s roubles-for-gas demand is no serious threat to US dollar reserve status – here’s why

By Kim Kaivanto, Lancaster University 

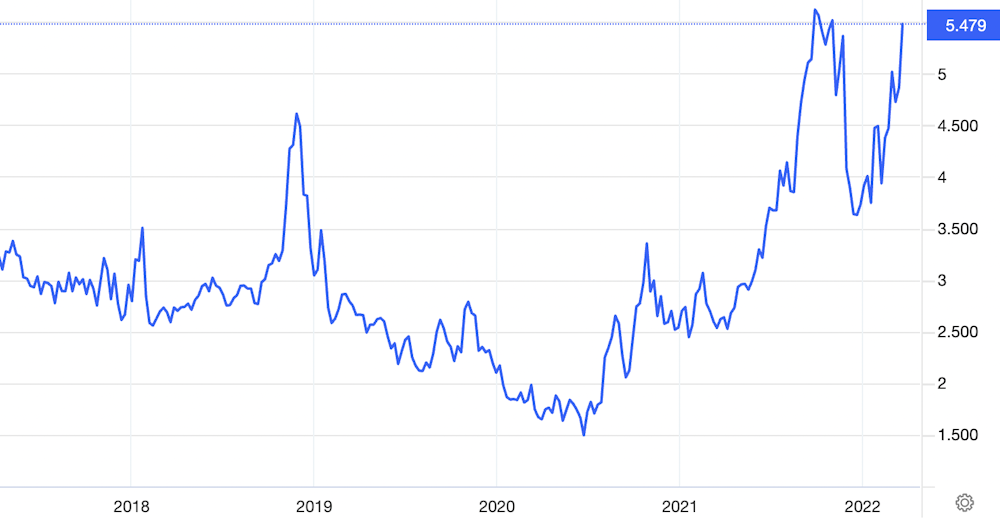
President Vladimir Putin’s demand that “unfriendly countries” henceforth pay for Russian gas in roubles has had several immediate effects. With the Europeans given one week to switch to paying in the Russian currency, it has driven up the price of natural gas, making it more expensive for them to maintain the sanctions regime.

The rouble has strengthened against the US dollar since the announcement from ₽107 to ₽99. And if European nations accede to Russia’s terms, the demand for roubles will increase and accordingly further strengthen the currency’s value in the foreign exchange market.

The moves put pressure on European countries to backslide on enforcing financial sanctions, since using roubles would presumably force them to buy the currency from sanctioned Russian banks. And it can be seen as a ploy to split Germany and Italy off from the sanctions alliance, since they are particularly dependent on Russian gas.

The early indications are that divide and rule may not be working: the Germans have announced they will reduce their dependency on Russian gas to as little as 10% (compared to over 50% today) by summer 2024. But since Russia is implicitly threatening to cut off Europe’s gas supply immediately unless it starts paying in roubles, the more pressing question is what the ramifications look like today.

Natural gas price (UK spot, pence/therm)

UK natural gas price chart
Trading Economics

It is not clear that Russia can legally change the terms of existing long-term gas-supply contracts with a unilateral announcement. The existing contracts already stipulate the currency in which payment is to be settled (currently Gazprom, which dominates Russian supply to Europe, settles 58% of its European gas sales in euros, 39% in US dollars, and 3% in pounds sterling). Accordingly, German economy minister Robert Habeck has said that the roubles-for-gas demand amounts to breach of contract.

If European countries choose to argue this change, there are legal avenues for resolving the dispute as stipulated in each contract (the legal jurisdiction, and the court or dispute resolution arrangements). The trouble is that none may be viable in practice.

Between 2005 and 2010 a series of gas disputes between Russia and Ukraine were ultimately resolved by the Arbitration Institute of the Stockholm Chamber of Commerce (SCC) in Sweden. But given that Russia has included all EU member states on its list of 48 “unfriendly states”, it is questionable whether it would accept Swedish SCC arbitration as independent now. The same goes for the UK and Switzerland, which are also world centres for arbitration and dispute resolution. Hence the dispute is probably not going to be resolved via legal argument.

The threat to the dollar

This latest demand from Russia is unprecedented. Even during the cold war, the Soviet Union did nothing to interrupt gas supplies to Europe. Perhaps this is why Putin added that this demand only concerns the currency of payment, and that contractual volumes and prices will continue to be honoured.

The demand can be seen as an extension of Russia’s attempt (along with China) to “de-dollarise” its economy, which has been ongoing since western countries introduced sanctions on Russia over Crimea in 2014. This has included increasingly trading with countries such as India and China in either euros or local currencies; reducing central bank holdings of US dollar reserves; and cutting dollar assets out of its national sovereign wealth fund. China has meanwhile developed an international payments messaging system called CIPS, which is a way of avoiding using the western Swift system.

China and Russia are uncomfortable with the prevailing reserve-currency status of the US dollar, which means it is the main currency used in international trade and held by central banks. Important commodities such as oil, and global services such as air transport, are priced in the American currency. It also makes it cheaper for the US to borrow on international financial markets, giving it an advantage over other countries.

Crucially, the US can impose economic sanctions on almost all trade settled in dollars. They do this by ordering so-called correspondent banks that hold accounts at the Federal Reserve not to transact with, say, their Russian counterparts. This cuts off one of the main ways of obtaining the US dollars necessary to participate in international trade.

Another issue is that it is easy and relatively cheap for countries around the world to borrow in dollars, but if the value of the dollar relative to other countries rises, the borrower’s debts become worth more in their own currency. The dollar is liable to rise when, for example, the Federal Reserve decides to put up interest rates, so countries with dollar-denominated debts are at the mercy of US monetary policy.

Russia’s de-dollarisation push has not been entirely unsuccessful. The share of its trade denominated in euros rose above 50% for the first time in the first quarter of 2020. The Europeans themselves have not been against trading more with the Russians in euros: the fact that Gazprom’s European supply contract is majority-denominated in euros can be credited to Putin’s de-dollarisation drive. This has helped to achieve a modest increase in Russia’s share of euro-denominated trade with the EU overall.

Meanwhile, the Saudis have been negotiating with the Chinese about potentially pricing their oil trading in yuan instead of dollars. As Saudi’s largest oil customer, that would take another bite out of the dollar’s importance as the reserve currency.

Having said all that, the big picture is that de-dollarisation by Russia and China has had only a modest effect on the US dollar’s dominant position. The dollar continues to be used in nearly nine in every ten forex transactions. It makes up the vast majority of all global export invoicing, and nearly three-fifths of all central bank reserves across the world.

So while Russia’s latest move is certainly part of a wider strategy that has had some success, we are nowhere near a tipping point. Even if the Europeans end up buying Russian gas in roubles for a while, that is not going to fundamentally change how the world economy works.The Conversation

About the Author:

Kim Kaivanto, Senior Lecturer in Economics, Lancaster University

This article is republished from The Conversation under a Creative Commons license. Read the original article.


Trade The NFP Live! 01-04-2022

By Orbex

Get ready to trade the NFP LIVE with a seasoned analyst!

Our resident market strategist David Kindley will be going live to give you exclusive insights into this month’s non-farm payrolls data release.

Excluding the first results for 2022, non-farm payrolls seem to be on a roll, with more and more positive results each time. Especially with a whooping 678K jobs added last month!

So, what can the markets expect this time around? Will the data keep up on its upward trajectory?

Join David as he takes you through his pre and post data release analysis, diving into FX Majors, Indices, Commodities, and Metals!

Why should you attend?

  • Explore the NFP and its possible outcomes.
  • Learn new techniques to help you identify trading opportunities
  • Develop your knowledge of market patterns under the guidance of a seasoned analyst
  • Join the trading community and ask all your questions!

We look forward to seeing you on the other side.

Join us LIVE on Zoom at 12 PM GMT!


Orbex-LogoArticle by Orbex

Orbex is a fully licensed broker that was established in 2011. Founded with a mission to serve its traders responsibly and provides traders with access to the world’s largest and most liquid financial markets. www.orbex.com

China’s PMIs: A Return To Contraction?

By Orbex

China is experiencing an uptick in covid cases, so it’s not surprising that this will have an impact on the economy.

The question is, how much?

This is particularly relevant for commodity currencies, like the AUD and NZD which rely on Chinese buying. Japan also relies considerably on exports to China, but primarily for machine goods. So, we want to be paying close attention to the Purchasing Managers Indices out of China to see if imports will continue to be strong.

Most notably, on Monday China announced a temporary lockdown on Shanghai. The latest region to announce a three-day lockdown was Xuzhou City in the Jiangsu region just north of Shanghai. If the virus spreads, this could lead to a full lockdown in the country’s second-largest economic region. The region is the center for China’s high-tech products, including electronics.

While this might have a smaller impact on imports, it could mean further supply chain problems (and inflation) in major markets in the US and Europe.

There are other things brewing

The spread of covid is also creating a regulatory hurdle for the country. Chinese stocks were already impacted as the US imposed stricter auditing measures for firms looking to trade in New York. With questions about the financial viability of many of the large firms given their exposure to the housing market, there has been a renewed demand for auditing.

But many of those companies are unlikely to be able to file audited results by the end of the month. Specifically, they are arguing that they can’t complete the process because of covid. The situation risks further downgrades by rating agencies. That said, Fitch was the latest to express concern over the lack of receipt of auditing files.

Relying on imports

Loss of credit status would likely make it harder for Chinese firms to buy from funds overseas, and restrict access to foreign capital. The PBOC is on an easing track, while the US and Europe are likely to continue raising rates. The yield gap between the currencies could lead to a weaker yuan and easier Chinese exports.

But, a weaker yuan would make it harder for Chinese firms to buy raw materials overseas and could weigh on commodity prices. The war in Ukraine has created the opportunity for some Chinese firms to acquire discounted raw materials from Russia. And this is also impacting the demand for materials from Australia.

If factories must shut down for temporary lockdowns, purchasing managers might be less willing to build inventory. So, if Manufacturing PMIs drop below 50 (meaning they expect an economic contraction), then commodity currencies could suffer a bit.

What to look out for

Analysts project the official NBS Manufacturing PMI to come in at 49.9, down from 50.2 prior. Although practically speaking there is little change, the drop below 50 could have a bigger psychological effect.

The private Caixin Manufacturing PMI survey on Friday could also have a similar change, moving to 50.0 compared to 50.4 prior. That’s not a major move.

If it misses by just one decimal though, it could fall below that important psychological level. In turn, that would confirm a less optimistic outlook just before the weekend.

Trading the news requires access to extensive market research – and that’s what we do best. Open your Orbex account now.


Orbex-LogoArticle by Orbex

Orbex is a fully licensed broker that was established in 2011. Founded with a mission to serve its traders responsibly and provides traders with access to the world’s largest and most liquid financial markets. www.orbex.com

What is an inverting yield curve and does it mean we’re heading for a recession?

By Luciano Rispoli, University of Surrey 

– One key predictor of downturns in the economy is what is known as the yield curve. This typically refers to the market for what the US government borrows, by issuing bonds and other securities that mature over different time horizons ranging from weeks to 30 years.

Each of these securities has its own yield (or interest rate), which moves up and down in inverse proportion to the security’s market value – so when bonds are trading at high prices, their yields will be low and vice versa. You can draw a chart that plots the yields of securities at each maturity date to see how they relate to one another, and this is known as the yield curve.

In normal times, as a compensation for higher risk, investors expect expect higher rates of interest for money they lend over a longer time horizon. To reflect this, the yield curve normally slopes up. When it instead slopes down – in other words, when it inverts – it is a sign that investors are more pessimistic about the long term than short term: they think a downturn or a recession is coming soon.

This is because they expect the Federal Reserve, the US central bank, is going to cut short-term interest rates in future to stimulate a struggling economy (as opposed to raising rates to cool down an economy that is overheating).

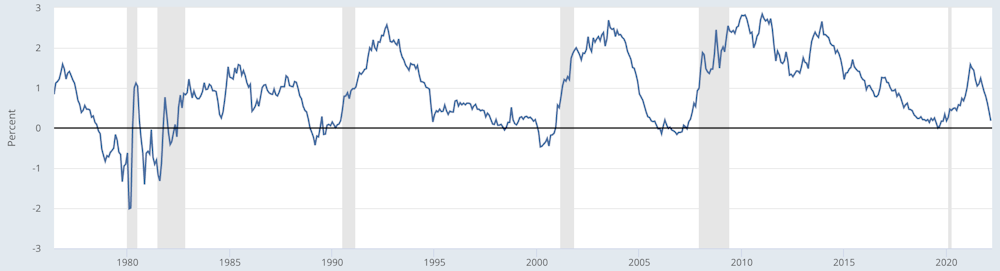
Most closely watched is the relationship between two-year and ten-year US treasury debt. The so-called spread between these two metrics can be seen in the chart below, with the grey areas indicating recessions that have tended to follow shortly after.

Spread between two-year and ten-year treasuries

Spreads between 2-year and 10-year bonds
St Louis Fed

As you can see, the yields of these two securities are getting very close to being the same, and the trend suggests that the two-year will soon have a higher yield – meaning the curve is inverting. The key question is, does an inverted yield curve hint at an upcoming downturn? Not necessarily. Let me explain why.

Inflation expectations

One complication is that bond yields don’t only reflect what investors think about future economic growth. They also buy or sell debt securities depending on what they think is going to happen to inflation. It’s generally assumed that prices will increasingly rise in the years ahead, and investors need to be compensated for bearing that risk, since higher inflation will erode their future purchasing power. For this reason, bond yields contain an element of inflation premium, normally with an increasingly higher premium for bonds with longer maturity dates.

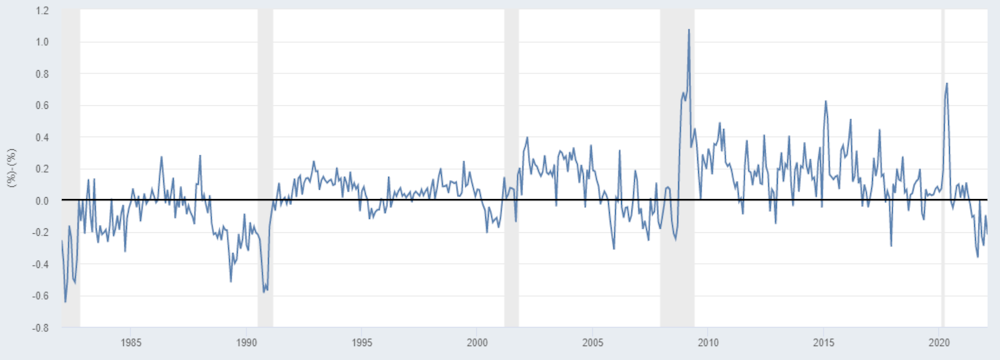
The following chart shows the spread between the inflation expectations built into 10-year and 2-year treasuries. The fact that it is in negative territory suggests the market thinks that inflation may fall, and this may also explain why yields on longer-dated treasuries are lower than on shorter-dated ones. And although inflation would fall in the event of an economic slowdown or recession, there could be a situation where inflation fell but the economy remained buoyant. Hence a yield curve inversion doesn’t have to mean that we are up against an imminent recession.

Inflation expectations (ten-year vs two-year treasuries)

Chart of the spread between inflation expectations in 10-yr and 2-yr treasuries
St Louis Fed

Quantitative easing

Another factor that is potentially affecting the yield curve is the Federal Reserve’s moves to buy government debt as part of its quantitative easing programme (QE). The idea behind QE is that by buying long-term bonds, the Fed is able to keep long-term interest rates low, which decreases the rates on mortgages and other loans, thereby stimulating the economy. Conversely, when sold, lending rates will go up and economic activity will be reduced.

Earlier in March, the Fed started raising the benchmark US interest rate and stopped the asset purchases under the QE programme that it launched in 2020 in response to the COVID pandemic. But it also indicated that it would only start selling these assets after several months of hiking the benchmark rate. Since the benchmark rate is a short-term rate, the yield curve inverting might indicate market expectations that short-term interest rates will be higher than long-term ones for the foreseeable future.

Which yield curve should we consider?

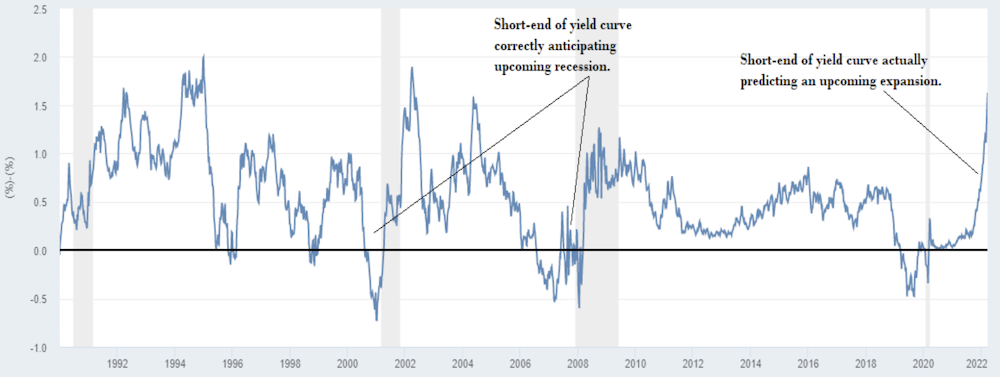
It is also sometimes argued that two-year/ten-year spreads are not the most useful ones to watch, and that instead one should focus on yields at the shorter end of the yield curve. In this set up, if you look at the difference in yields between two-year and three-month treasuries, it is actually steepening: in other words, it is hinting that economic growth is going to increase in the short term.

Economists sometimes argue that these near-term yield curve movements have stronger predictive power than those further out. At the very least, the fact that these are saying something different shows the need to be careful because different data about treasury yields can depict a different (or even opposite) picture depending on what time horizon you are considering.

Spread between two-year and three-month treasury yields

Chart comparing 2-year and 3-month treasury yields over time
St Louis Fed

To summarise, it doesn’t necessarily follow that an inverted yield curve will be followed by a recession. It certainly could mean that, in which case unemployment would likely rise and inflation would potentially come down more quickly than many are expecting. But for now, it’s too early to say. The debt market is certainly signalling that change is coming, though it’s often easier to say in hindsight what it meant than at the present time.The Conversation

About the Author:

Luciano Rispoli, Teaching Fellow in Economics, University of Surrey

This article is republished from The Conversation under a Creative Commons license. Read the original article.


DXY Double Zigzag To Complete Cycle Wave Z

By Orbex

DXY

The current DXY structure hints at the development of a large triple zigzag w-x-y-x-z of the cycle degree.

The intervening wave x ended, in a triple Ⓦ-Ⓧ-Ⓨ-Ⓧ-Ⓩ zigzag of the primary degree formation.

At the time of writing, a cycle actionary wave z is under construction. The internal structure of the wave z suggests a double Ⓦ-Ⓧ-Ⓨ zigzag. The first two parts of the double zigzag look fully complete. The primary wave Ⓨ is still in the process of development. It could take the form of a double zigzag (W)-(X)-(Y) of the intermediate degree.

Bulls can continue to push the price to the level of 101.972. The target is determined using the Fibonacci extension tool. At the specified level, wave z will be at 100% of the previous actionary wave y.

DXY

Alternatively, the cycle actionary wave y was longer than in the main variant and has the form of a primary triple zigzag. At the time of writing, it has ended.

In the near future, the market will continue to move in a downward direction, building a cycle intervening wave x. It will most likely take the form of a primary double zigzag.

Finally, prices could fall to the level of 97.10, where wave x will be at 23.6% of wave y.


Orbex-LogoArticle by Orbex

Orbex is a fully licensed broker that was established in 2011. Founded with a mission to serve its traders responsibly and provides traders with access to the world’s largest and most liquid financial markets. www.orbex.com

Intraday Market Analysis – Gold Tests Critical Support

By Orbex

USDCHF tests support

USDCHF

The US dollar edged lower as traders ditched its safe-haven appeal.

The pair met strong support at 0.9260 over the 30-day moving average. A break above the immediate resistance at 0.9340 prompted short-term sellers to cover their positions, opening the door for potential bullish continuation.

A break above 0.9370 could bring the greenback back to the 12-month high at 0.9470. 0.9260 is major support in case of hesitation and its breach could invalidate the current rebound.

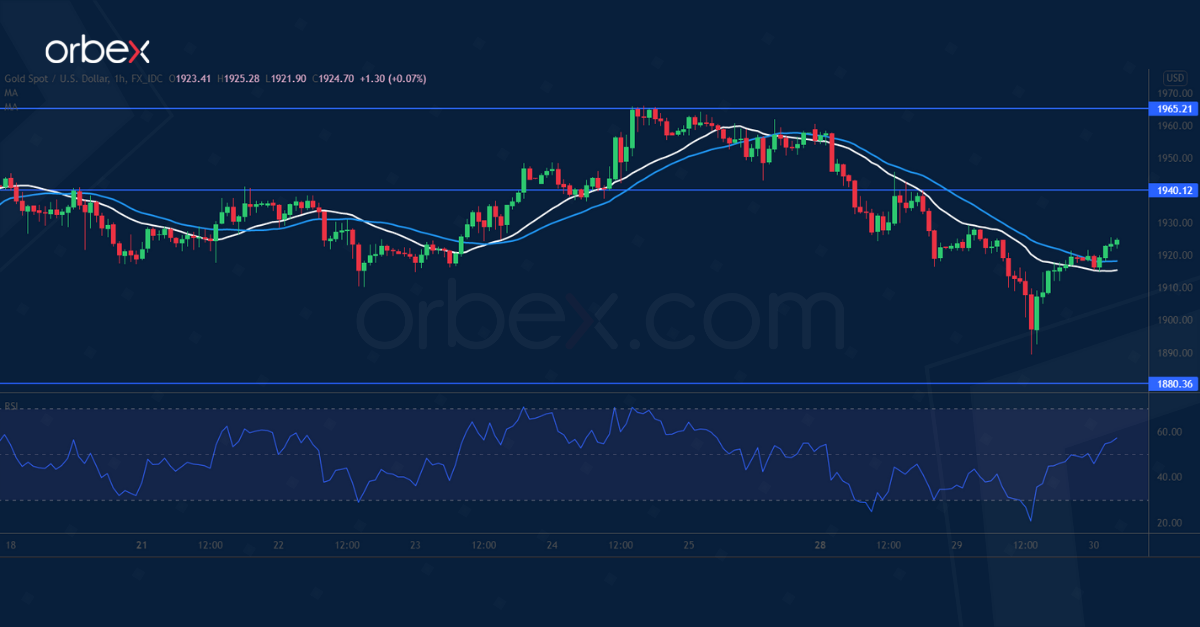
XAUUSD struggles for support

XAUUSD

Gold struggles as risk appetite returns amid ceasefire talks. A fall below 1940 forced those hoping for a swift rebound to bail out.

On the daily chart, gold’s struggle to stay above the 30-day moving average suggests a lack of buying power. Sentiment grows cautious as the metal tentatively breaks the psychological level of 1900.

A drop below 1880 could make bullion vulnerable to a broader sell-off to 1850. An oversold RSI attracted some bargain hunters, but buyers need to lift offers around 1940 before they could expect a rebound.

UK 100 heads towards recent peak

UK 100

The FTSE 100 continues upward as Russia promises to de-escalate. A bullish close above the origin of the February sell-off at 7550 has put the index back on track.

Sentiment has become increasingly upbeat over a series of higher highs. The lack of selling pressure would send the index back to this year’s high at 7690.

A bullish breakout may resume the uptrend in the medium term. As the RSI shot into the overbought zone, profit-taking could drive the price down temporarily and 7460 would be the closest support.


Orbex-LogoArticle by Orbex

Orbex is a fully licensed broker that was established in 2011. Founded with a mission to serve its traders responsibly and provides traders with access to the world’s largest and most liquid financial markets. www.orbex.com

Murrey Math Lines 30.03.2022 (USDJPY, USDCAD)

Article By RoboForex.com

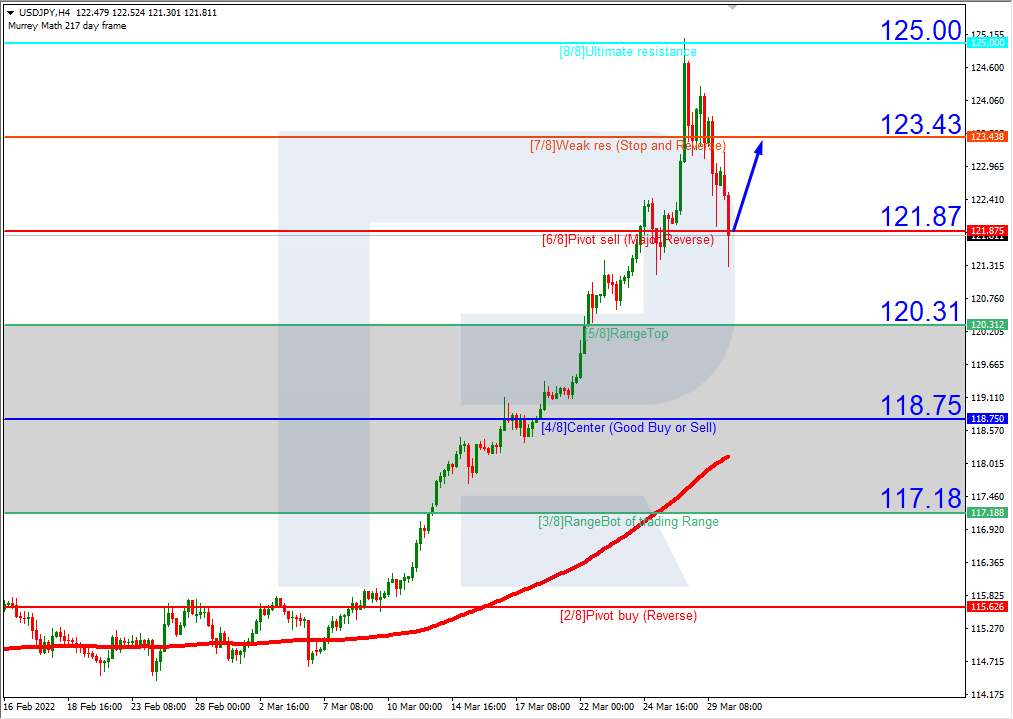
USDJPY, “US Dollar vs. Japanese Yen”

In the H4 chart, USDJPY is trading above the 200-day Moving Average, thus indicating a possible ascending tendency. In this case, the price is expected to break 6/8 and then continue growing and reach the resistance at 7/8. However, this scenario may no longer be valid if the price breaks the support at 5/8 to the downside. After that, the instrument may correct down to 4/8.

USDJPYH4
Risk Warning: the result of previous trading operations do not guarantee the same results in the future

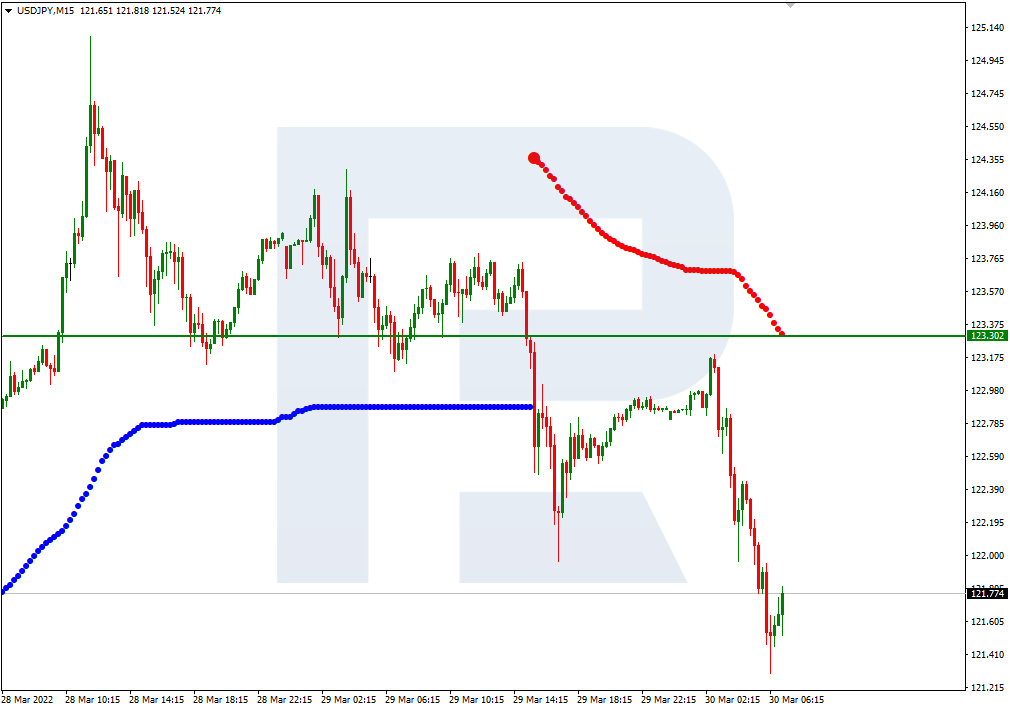
As we can see in the M15 chart, the upside line of the VoltyChannel indicator is pretty far away from the price, that’s why the pair may continue trading upwards only after breaking 6/8 in the H4 chart.

USDJPY_M15
Risk Warning: the result of previous trading operations do not guarantee the same results in the future

USDCAD, “US Dollar vs Canadian Dollar”

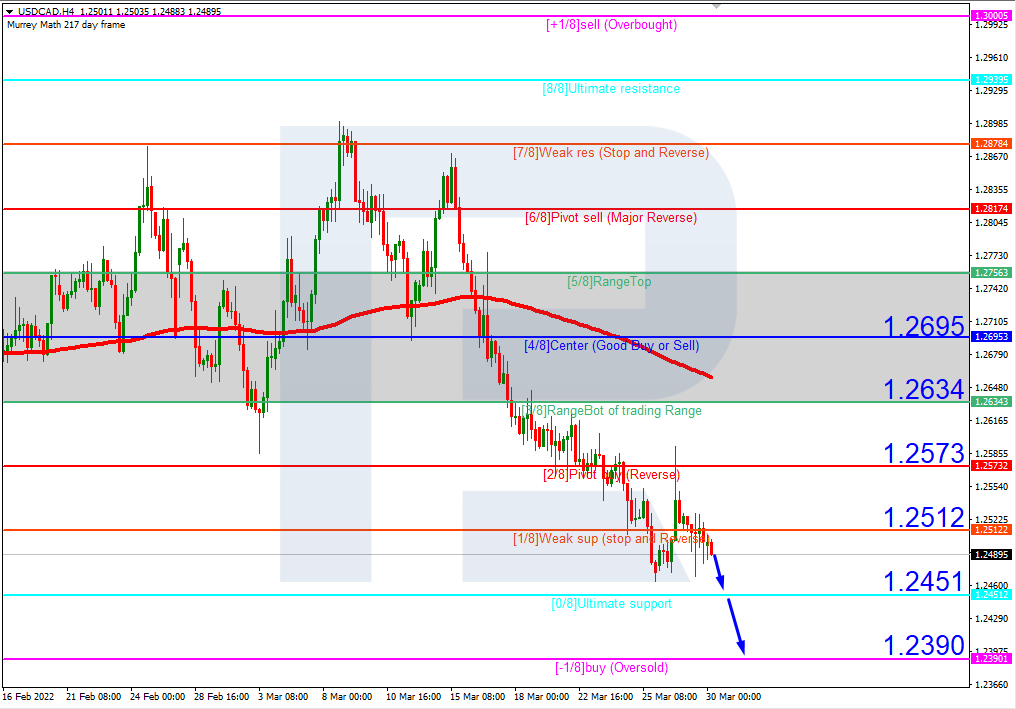
As we can see in the H4 chart, USDCAD is trading below the 200-day Moving Average to indicate a possible descending tendency. In this case, the price is expected to continue falling towards the support at -1/8. Still, this scenario may no longer be valid if the price breaks the resistance at 1/8 to the upside. After that, the instrument may reverse and move upwards to reach 3/8.

USDCAD_H4
Risk Warning: the result of previous trading operations do not guarantee the same results in the future

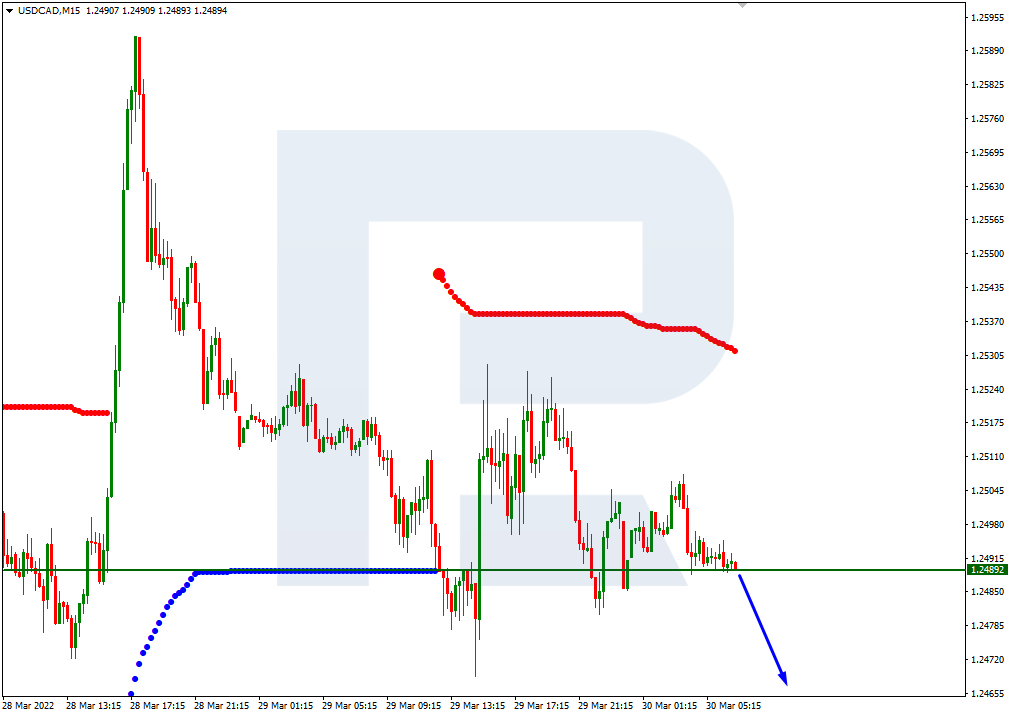
In the M15 chart, the pair may break the downside line of the VoltyChannel indicator and, as a result, continue trading downwards.

USDCAD_M15

Article By RoboForex.com

Attention!
Forecasts presented in this section only reflect the author’s private opinion and should not be considered as guidance for trading. RoboForex LP bears no responsibility for trading results based on trading recommendations described in these analytical reviews.

The cryptocurrency market digest (BTC, ETH). Overview for 30.03.2022

Article By RoboForex.com

The BTC continues rising steadily; on Wednesday, it is trading at $47,296. Yesterday, it even broke $48,200. The last several days were quite positive for the crypto market. Positive momentum in the BTC is supported by the strengthening of American stock indices.

From the technical point of view, the BTC may break $47,500 and fix above it in the nearest future, while the next upside target may be at $51,000. A more ambitious goal is moving up to $60,000.

The crypto market has two extremely volatile trading sessions ahead, which include geopolitics and the labour market data from the US. Strong numbers may push stock indices upwards and the BTC should follow them.

The total capitalisation of the cryptomarket is currently estimated at $2.2 trillion, while the BTC capitalisation is a bit above $900 billion.

Bitcoin chart online

ETH: chances to reach $3,500 rise

A positive vibe in the crypto market is expanding. The ETH price is going up as the token remains within the bullish channel. On Wednesday, it is trading at $3,389, thus confirming the next upside target to be at $3,500. At the moment, the ETH is moving at its 2-month highs.

Ethereum chart online

Coinbase will take a foothold

Coinbase intends to complete the deal to buy 2TM, which has been discussed since the beginning of the year. The deal is expected to be completed in April. This acquisition will allow Coinbase to become much stronger in Latin America and Europe.

Zilliqa: the future in metaverses

The Zilliqa token leaped up 170% over a week. Investors are buying it in anticipation of a gaming platform in the Metapolis metaverse where they can use these coins. In the nearest future, such areas will become more and more popular, that’s why Zilliqa has good prospects.

The Zilliqa capitalisation reached $1.6 billion.

Article By RoboForex.com

Attention!
Forecasts presented in this section only reflect the author’s private opinion and should not be considered as guidance for trading. RoboForex LP bears no responsibility for trading results based on trading recommendations described in these analytical reviews.