Intraday Market Analysis – USD Seeks Support

By Orbex

GBPUSD attempts to rebound

GBPUSD

The US dollar went sideways as February’s PCE fell short of expectations. The pair met stiff selling pressure around 1.3300, a supply zone next to the 30-day moving average.

A break below 1.3120 may have cast doubt on the viability of the previous rebound after short-term buyers rushed to the exit. 1.3220 is now a fresh resistance and buyers’ failure to lift these offers could send the pound into a deeper correction.

Price action may revisit the psychological level of 1.3000 if it drops below 1.3070.

NZDUSD sees a limited pullback

NZDUSD

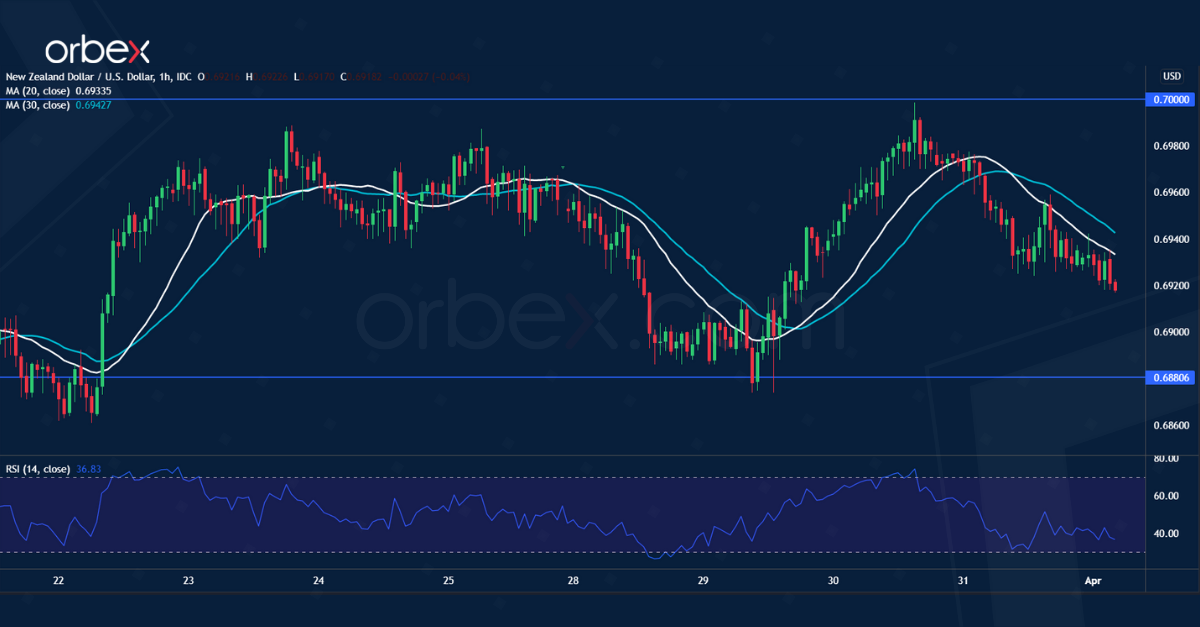
The New Zealand dollar falls back as risk appetite subdues. The pair hit resistance under the psychological level of 0.7000 after it broke to a new high.

The RSI’s overbought condition in this supply zone led buyers to take profit, driving the kiwi lower momentarily. Trend followers may see the retracement as a buying opportunity.

Sentiment would stay bullish as long as the pair is above the previous low at 0.6880. A bearish breakout may dent short-term optimism and send the kiwi to 0.6790.

US 30 keeps high ground

US 30

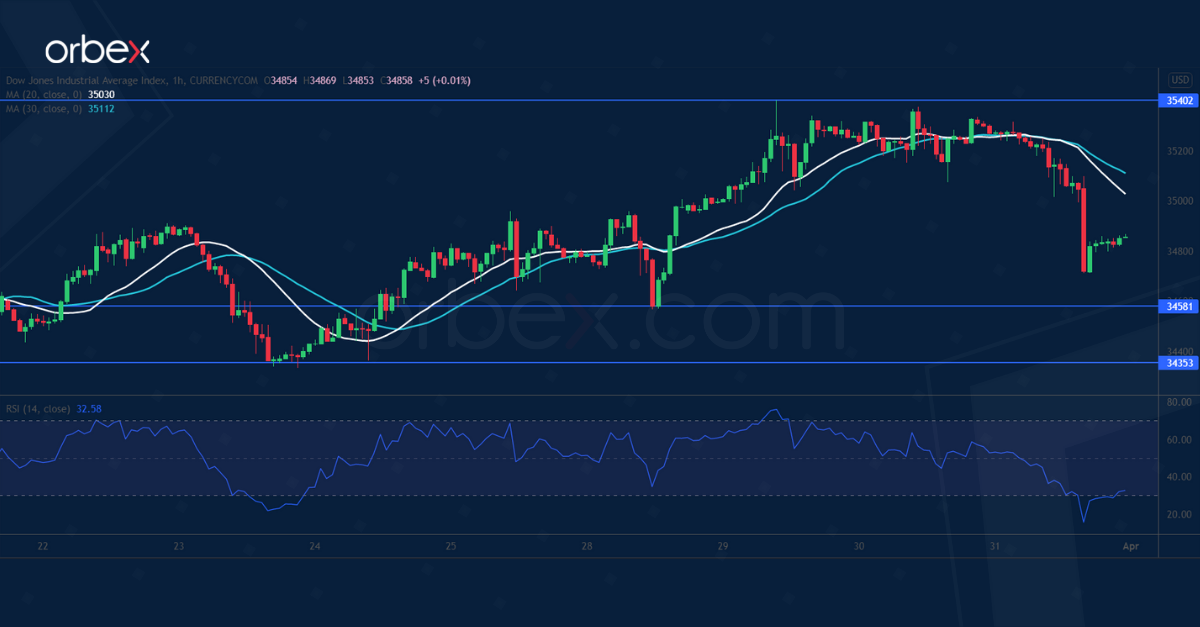
The Dow Jones 30 retreats on profit-taking as the first quarter draws to an end. A bullish MA cross on the daily chart suggests that the rebound is picking up steam.

The index hit resistance around 35400 and went horizontal, allowing the bulls to take a breather. Buyers may find relief as the RSI tanks into the oversold area.

A rebound would propel the Dow to February’s high at 35870, where a bullish breakout could resume the uptrend in the medium term. The demand area between 34350 and 34580 is an important level.


Orbex-LogoArticle by Orbex

Orbex is a fully licensed broker that was established in 2011. Founded with a mission to serve its traders responsibly and provides traders with access to the world’s largest and most liquid financial markets. www.orbex.com

The cryptocurrency market digest (BTC, DOGE, SHIB). Overview for 01.04.2022

Article By RoboForex.com

The BTC couldn’t continue the rising impulse to $51,000 on Friday – it corrected down to $44,858 instead. The correction was one of the possible scenarios, especially as American stock indices went down.

From the technical point of view, there is nothing dramatic. However, the correction might push the BTC down to $44,200 or even $42,500.

Bulls will be back as soon as the external background calms down and the major cryptocurrency gets rid of being “overbought”.

The BTC decline made all key altcoins fall as well. For example, the ETH lost 4% over the last 24 hours, while ADA and DOT – 7%. The least significant decline was in SOL, less than 1%.

Bitcoin chart online

Dogecoin: everything is “red”

Dogecoin (DOGE) dropped over 7% in the last day. There was no negative fundamental news, so one may assume that the coin reacts to the overall situation in the sector. the closest downside target in the asset is 0.1281.

Dogecoin chart online

Shiba Inu: nothing to write home about

The price of the popular mem coin is also falling, although it is looking better than the others. Recently, the Shiba Inu team gave some clues to its metaverse project, which are very popular right now. However, the project was already criticized: Dogecoin’s cofounder Billy Markus believes that the option to sell virtual land in the metaverse will generate profits for the company but won’t make users and the project valuable.

OpenSea: join a queue for NFTs

As early as April, the OpenSea platform might offer a chance to buy Solana-based NFTs. As of now. the platform supports Ethereum, Klatyn, and Polygon. The exact date hasn’t been announced yet. However, the fact that Solana will be available in the largest NFT platform is really positive for the industry in general, and for its own token in particular.

Article By RoboForex.com

Attention!
Forecasts presented in this section only reflect the author’s private opinion and should not be considered as guidance for trading. RoboForex LP bears no responsibility for trading results based on trading recommendations described in these analytical reviews.

The Analytical Overview of the Main Currency Pairs on 2022.04.01

by JustForex

The EUR/USD currency pair

Technical indicators of the currency pair:
  • Prev Open: 1.1155
  • Prev Close: 1.1065
  • % chg. over the last day: -0.90 %

The number of new jobless claims in the US was 202,000, while analysts expected 196,000. In February, US household spending increased by 0.2%, while a 0.5% growth was expected. As for personal income, it increased by 0.5%, as expected. If incomes grow faster than expenses, this is a good sign for the economy, especially for stock indices. But a negative factor for the dollar index. In February, Eurozone unemployment fell to 6.8% from 6.9%. Eurozone inflation data will be released today. Analysts forecast inflation to rise from 5.9% to 6.6% year on year. Reducing unemployment along with rising inflation are prerequisites for the monetary policy tightening on the part of the ECB.

Trading recommendations
  • Support levels: 1.1037, 1.1017, 1.0963, 1.0917, 1.0887, 1.0823, 1.0633
  • Resistance levels: 1.1149, 1.1196, 1.1291

From the technical point of view, the trend on the EUR/USD currency pair on the hourly time frame has changed to bullish. At the moment, the price has corrected and is trading between the moving averages. The MACD indicator is in the negative zone. Under such market conditions, it is better to look for buy trades on intraday timeframes from the support level of 1.1037. Sell trades should be considered from the resistance level of 1.1149, but only after the additional confirmation.

Alternative scenario: if the price breaks down through the 1.1017 support level and fixes below, the uptrend will likely be broken.

EUR/USD
News feed for 2022.04.01:
  • – French Manufacturing PMI (m/m) at 10:50 (GMT+3);
  • – German Manufacturing PMI (m/m) at 10:55 (GMT+3);
  • – Eurozone Manufacturing PMI (m/m) at 11:00 (GMT+3);
  • – Eurozone Consumer Price Index (m/m) at 12:00 (GMT+3);
  • – US Nonfarm Payrolls (m/m) at 15:30 (GMT+3);
  • – US Unemployment Rate (m/m) at 15:30 (GMT+3);
  • – US ISM Manufacturing PMI (m/m) at 17:00 (GMT+3).

The GBP/USD currency pair

Technical indicators of the currency pair:
  • Prev Open: 1.3129
  • Prev Close: 1.3142
  • % chg. over the last day: +0.10%

The news that the US intends to release up to 180 million barrels of oil from its strategic reserves in six months is a negative factor for the British pound, as the pound is directly correlated with Brent oil quotes, which in turn is highly correlated with the US WTI oil quotes. Given the Fed’s aggressive policies, the British pound could lose much of its position if the Bank of England does not continue to raise interest rates. Currently, the Bank of England has decided to suspend monetary policy tightening.

Trading recommendations
  • Support levels: 1.3117, 1.3074, 1.3015, 1.2989, 1.2863
  • Resistance levels: 1.3161, 1.3244, 1.3274

On the hourly time frame, the GBP/USD currency pair trend is bullish. The price movement pattern is beginning to show a flat structure. The MACD indicator became inactive. Under such market conditions, buy trades should be considered from the support level of 1.3117, but better with confirmation. Sell deals should be considered from the resistance level of 1.3244, but only with short targets.

Alternative scenario: if the price breaks down through the 1.3074 support level and fixes below, the mid-term uptrend will likely be broken.

GBP/USD
News feed for 2022.04.01:
  • – UK Manufacturing PMI (m/m) at 11:30 (GMT+3).

The USD/JPY currency pair

Technical indicators of the currency pair:
  • Prev Open: 121.84
  • Prev Close: 121.69
  • % chg. over the last day: -0.12%

The fundamental picture for the Japanese Yen remains unchanged. The monetary policy of the Bank of Japan is now “ultra-soft” and is aimed at decreasing the national currency rate (USD/JPY growth). Due to the Сentral Bank of Japan’s work in the debt market, the Japanese Yen is now temporarily strengthening. However, the mid-term outlook remains unchanged – analysts see a continuation of the uptrend, as the monetary policy of the US and Japanese central banks are now diametrically opposed.

Trading recommendations
  • Support levels: 120.88, 119.52, 117.72
  • Resistance levels: 122.83, 123.44,125.22

The medium-term trend on the USD/JPY currency pair is bullish. The price corrected to the moving averages. The MACD indicator has become positive. Under such market conditions, it is best to look for buy deals, expecting the continuation of the uptrend. First of all, it is worth considering the support level of 120.88, but with additional confirmation. For sell deals, a resistance level of 122.83 or 123.44 may be considered, but only after the sellers’ initiative.

Alternative scenario: If the price fixes below 119.52, the uptrend will likely be broken.

USD/JPY
News feed for 2022.04.01:
  • – Japan Final Manufacturing PMI (m/m) at 03:30 (GMT+3).

The USD/CAD currency pair

Technical indicators of the currency pair:
  • Prev Open: 1.2479
  • Prev Close: 1.2505
  • % chg. over the last day: +0.21%

The Canadian dollar is a commodity currency and is highly dependent on the movement of oil prices and the dollar index. OPEC+ will stick to its current plan to increase oil production, as OPEC+ ministers see a balanced oil market and increased volatility through the geopolitics. The next OPEC+ ministerial meeting will take place on May 5. After OPEC+ did not raise its production plan, the US said it would release a record 1 million barrels of oil a day from its strategic reserve for six months. This move will limit the rise in oil prices, which in combination with the rise in the dollar index may lead to an increase in the USD/CAD currency pair. The only thing that can prevent this is the monetary policy of the Central Bank of Canada, which, like the Fed, is preparing for a tightening.

Trading recommendations
  • Support levels: 1.2486, 1.2453
  • Resistance levels: 1.2563, 1.2655, 1.2713, 1.2754, 1.2851

In terms of technical analysis, the USD/CAD currency pair trend is bearish. The MACD indicator has become inactive, but the pressure on buyers remains. Trade only with short targets, since on the USD/CAD currency pair fundamentally, there are no prerequisites for the medium-term trend, as the dollar index in the medium term also has the support of the Fed. Under such market conditions, it is better to look for buy trades on the lower timeframes from the support level of 1.2486, but it is better with additional confirmation. For sell deals, it is better to consider the resistance level of 1.2563.

Alternative scenario: if the price breaks through and consolidates above 1.2654, the downtrend will likely be broken.

USD/CAD
News feed for 2022.04.01:
  • – Canada Manufacturing PMI (m/m) at 16:30 (GMT+3).

by JustForex


This article reflects a personal opinion and should not be interpreted as an investment advice, and/or offer, and/or a persistent request for carrying out financial transactions, and/or a guarantee, and/or a forecast of future events.

Germany’s DAX: What You Can Learn from the 2007 Top

Why investors should be aware of a divergence between stock prices and consumer confidence

By Elliott Wave International

Among the scores of stock market indicators, there’s at least one that may be off many investors’ radar screens.

And, that is the trend in consumer confidence. Specifically, a peak in consumer confidence tends to precede a peak in the stock market.

With that in mind, back on Nov. 25, the Telegraph said:

Consumer confidence has dropped sharply in Germany. …

A few days later, the December Global Market Perspective, a monthly Elliott Wave International publication which offers coverage of 50-plus worldwide financial markets, provided a retrospective of Germany’s DAX and consumer confidence with this chart and commentary:

As the DAX approached its July 2007 peak 14 years ago, a telling divergence popped up between stock prices and consumer confidence. The GfK Consumer Confidence indicator, which surveys about 2,000 households every month, reversed in December 2006, seven months before the DAX reversed. Consumer confidence fell for three months, and then rallied to a secondary but lower peak in July 2007, coinciding with the stock market’s final top on July 13, 2007. Only then did the bottom fall out.

Market history usually does not repeat exactly, however, do know that the DAX is trading lower than it was at the time of that big drop in consumer confidence, which the Telegraph reported in November.

The key takeaway is that consumer confidence tends to trend with stocks.

Indeed, here’s one of the more recent headlines about consumer confidence in Germany (Dow Jones Newswire, Feb. 23):

German Consumer Confidence Is Expected to Continue Its Downward Trend

Does this mean that a big crash is just ahead for Germany’s main stock index?

Well, you can get a good idea of what to expect next for the DAX as you look at the index’s long-term Elliott wave labeling in the March Global Market Perspective. Inside the same issue, you’ll find analysis of the DAX’s price-to-sales ratio, as well as the price-to-book ratio.

If you’d like to learn about labeling Elliott waves on a stock market chart, you are encouraged to read Frost & Prechter’s Elliott Wave Principle: Key to Market Behavior. Here’s a quote:

All waves may be categorized by relative size, or degree. The degree of a wave is determined by its size and position relative to component, adjacent and encompassing waves. [R.N.] Elliott named nine degrees of waves, from the smallest discernible on an hourly chart to the largest wave he could assume existed from the data then available. He chose the following terms for these degrees, from largest to smallest: Grand Supercycle, Supercycle, Cycle, Primary, Intermediate, Minor, Minute, Minuette, Subminuette. Cycle waves subdivide into Primary waves that subdivide into Intermediate waves that in turn subdivide into Minor waves, and so on. The specific terminology is not critical to the identification of degrees, although out of habit, today’s practitioners have become comfortable with Elliott’s nomenclature.

You may be interested in knowing that you can access the entire online version of the book — free!

That’s right — all that’s required for free access is a Club EWI membership — which is also free. In case you don’t know, Club EWI is the world’s largest Elliott wave educational community, and members enjoy complimentary access to an abundance of Elliott wave resources on financial markets, investing and trading — with zero obligation.

Get started right away by following this link: Elliott Wave Principle: Key to Market Behavior — free and instant access now.

This article was syndicated by Elliott Wave International and was originally published under the headline Germany’s DAX: What You Can Learn from the 2007 Top. EWI is the world’s largest market forecasting firm. Its staff of full-time analysts led by Chartered Market Technician Robert Prechter provides 24-hour-a-day market analysis to institutional and private investors around the world.

The US announced a record release of its oil reserves, inflation in Europe at record levels

by JustForex

On Thursday, global stock indices fell amid fears of recession, and Russia’s invasion of Ukraine boosted sales. Oil prices fell more than $6 after the US announced a record release of its strategic reserves. The Dow Jones index (US30) decreased by 1.56% yesterday, the S&P 500 index (US500) lost 1.57%, and the NASDAQ technology index (US100) fell by 1.54%. Analysts see a stock market downturn over the next two quarters as record inflation in the US forces the Fed to aggressively raise interest rates, which will eventually lead to higher government bond yields, the rising dollar index, and lower stock indices. Investors need to balance their portfolios.

“The inverted Treasury yield curve is one of the signals that future US stock earnings will be disappointing,” said Nicholas Colas, co-founder of DataTrek Research. The inversion of the US yield curve is seen as a reliable signal that a recession may follow within a year or two.

The economic slowdown, rising inventories, declining demand, and lower household purchasing power will further reduce inflationary pressures in the second half of the year. As a result, the Fed will stop aggressively raising rates. Therefore, the new portfolio purchase agreement should be considered at the end of the third or beginning of the fourth quarter of 2022, but not earlier.

On Wednesday, European stock markets were mostly decreasing. Yesterday, German DAX (DE30) fell by 1.31%, French CAC 40 (FR40) lost 1.21%, Spanish IBEX 35 (ES35) decreased by 1.23%, British FTSE 100 (UK100) lost 0.83%. Following the negative inflation data from Spain and Germany, inflation data also showed a record price increase in France in March and increased to 7% year on year in Italy. Inflation data for the Eurozone will be released today. Analysts forecast an increase in inflation from 5.9% to 6.6% year on year. Reducing unemployment along with rising inflation are prerequisites for tightening the ECB monetary policy.

The US Treasury Department is considering imposing sanctions on any individuals or organizations involved in the aerospace, maritime, and electronic sectors of the Russian economy.

Russia has banned entry to high-ranking EU and US officials responding to sanctions.

Putin said he had signed a decree on the rules of gas trade with unfriendly countries. They will have to open ruble accounts in Russian banks. Existing gas supply contracts will be terminated if buyers from unfriendly countries do not comply with the new payment terms. The new rules will take effect on April 1. Existing contracts for the purchase of Russian gas will be terminated if buyers refuse to pay in rubles. The UK, France, and Germany have already indicated that they are not going to pay in rubles for gas. Gas prices in Europe have accelerated and jumped up to almost $1450.

At the end of the meeting, OPEC+ will adhere to its existing plan to increase oil production. OPEC+ ministers see a balanced oil market, and the volatility is increased due to geopolitics. The next meeting of OPEC+ ministers will take place on May 5. After OPEC+ did not raise its production plan, the US said it would release 1 million barrels of oil daily from its strategic reserve for six months. In total, it is planned to release up to 180 million barrels over six months, which, if implemented, will be the largest release from the reserve since its creation in 1975. This step will limit the rise in oil prices.

Gold is rising again, but investors should be aware that gold is inversely correlated to government bond yields, the movement of which depends on the Fed’s monetary policy. As the Fed hikes rates aggressively this year, the dollar index and the government bond yields will rise, and gold and silver prices will fall. The current rise in gold is speculative amid rising inflation in the US and Europe.

The Russian ruble strengthened for the ninth session in a row, trading at about 83 rubles per dollar, while stocks jumped due to the removal of some restrictions on short-selling. The ruble’s exchange rate dynamics are currently created artificially. The currency, which was in free circulation until the end of February, is now governed by capital control, a ban on the purchase of cash dollars and euros, and other administrative measures. Analysts are confident that the Central Bank of Russia will not be able to maintain such a course for long.

Asian markets traded in negative territory yesterday. Japan’s Nikkei 225 (JP225) decreased by 0.73%, Hong Kong’s Hang Seng (HK50) lost 1.06%, and Australia’s S&P/ASX 200 (AU200) ended the day down by 0.20%. China has decided to restrict visas for some US officials in response to US visa restrictions for some Chinese officials. Shares of Chinese company Baidu plummeted 7.5% due to the threat of delisting. The SEC warned Baidu of delisting from US stock exchanges due to audit data. A curfew has been imposed in Sri Lanka after protests over the economic crisis turned violent. Hundreds of protesters gathered near the president’s private residence in the Colombo suburb late Thursday night and were dispersed by police using tear gas and water cannons.

Main market quotes:

S&P 500 (F) (US500) 4,530.41 -72.04 (-1.57%)

Dow Jones (US30) 34,678.35 -550.46 (-1.56%)

DAX (DE40) 14,414.75 -191.30 (-1.31%)

FTSE 100 (UK100) 7,515.68 -63.07 (-0.83%)

USD Index 98.37 +0.58 (+0.59%)

Important events for today:
  • – Japan Final Manufacturing PMI (m/m) at 03:30 (GMT+3);
  • – China Caixin Manufacturing PMI (m/m) at 04:45 (GMT+3);
  • – Switzerland Consumer Price Index (m/m) at 10:30 (GMT+3);
  • – French Manufacturing PMI (m/m) at 10:50 (GMT+3);
  • – German Manufacturing PMI (m/m) at 10:55 (GMT+3);
  • – Eurozone Manufacturing PMI (m/m) at 11:00 (GMT+3);
  • – UK Manufacturing PMI (m/m) at 11:30 (GMT+3);
  • – Eurozone Consumer Price Index (m/m) at 12:00 (GMT+3);
  • – US Nonfarm Payrolls (m/m) at 15:30 (GMT+3);
  • – US Unemployment Rate (m/m) at 15:30 (GMT+3);
  • – Canada Manufacturing PMI (m/m) at 16:30 (GMT+3);
  • – US ISM Manufacturing PMI (m/m) at 17:00 (GMT+3).

by JustForex


This article reflects a personal opinion and should not be interpreted as an investment advice, and/or offer, and/or a persistent request for carrying out financial transactions, and/or a guarantee, and/or a forecast of future events.
$50,000 on target: FOMO & fundamentals to drive new Bitcoin bull run

By George Prior

The Fear Of Missing Out (FOMO) and fundamentals are going to be the main drivers of Bitcoin’s latest price run, says the CEO of one of the world’s largest independent financial advisory, asset management and fintech organisations.

The comments from deVere Group’s Nigel Green, a long-time, high-profile Bitcoin bull come as the world’s largest cryptocurrency hit its highest level since Jan 2 on Monday.

He says: “Bitcoin is up nearly 25% in the last 10 days, smashing through the $35,000-$45,000 band where it has been lodged since January. It’s now edging nearer to the important $50,000 level [$48,200 at the time of writing, 11.40 BST].

“Should it also surge through this key price marker, we expect the current bull run would become supercharged as crypto FOMO would kick in– as it typically does when Bitcoin prices shoot up.”

The deVere CEO continues: “The $50,000 mark will act as a reminder to those who haven’t been paying full attention that digital currencies are inevitably the future of money.

“This is now becoming clear even to institutional investors – including credit unions, banks, large funds such as mutual or hedge funds, venture capital funds, insurance companies, and pension funds – as well as governments and multinational corporations.

“As such, prices are set to skyrocket over the long-term – and both institutional and retail investors will not want to miss out on the ‘early advantage’ edge.

“Watching others make decent returns during a good rally may make you feel obligated to join in and get in on the gains.”

“However, even though the desire to get on the bandwagon can be strong, it is typically not a sound way to make investment decisions and is usually ill-advised

“But in this case, the fundamentals of Bitcoin, the cryptocurrency’s intrinsic characteristics are, indeed, sound.”

There is, he says, inherent value of digital, borderless, global currencies for trade and commerce purposes in our increasingly digitalised economies in which businesses operate in more than one jurisdiction.

In addition, recent serious geopolitical issues have put a spotlight on Bitcoin’s other key traits, which include being decentralized, permissionless, censorship-resistant and unconfiscatable.

Nigel Green concludes: “The world is racing towards a digital revolution and as investors increasingly pay attention to this, the long-term trajectory for Bitcoin, surely, has to be upward.”

About:

deVere Group is one of the world’s largest independent advisors of specialist global financial solutions to international, local mass affluent, and high-net-worth clients.  It has a network of more than 70 offices across the world, over 80,000 clients and $12bn under advisement.

Japanese Candlesticks Analysis 31.03.2022 (EURUSD, USDJPY, EURGBP)

Article By RoboForex.com

EURUSD, “Euro vs US Dollar”

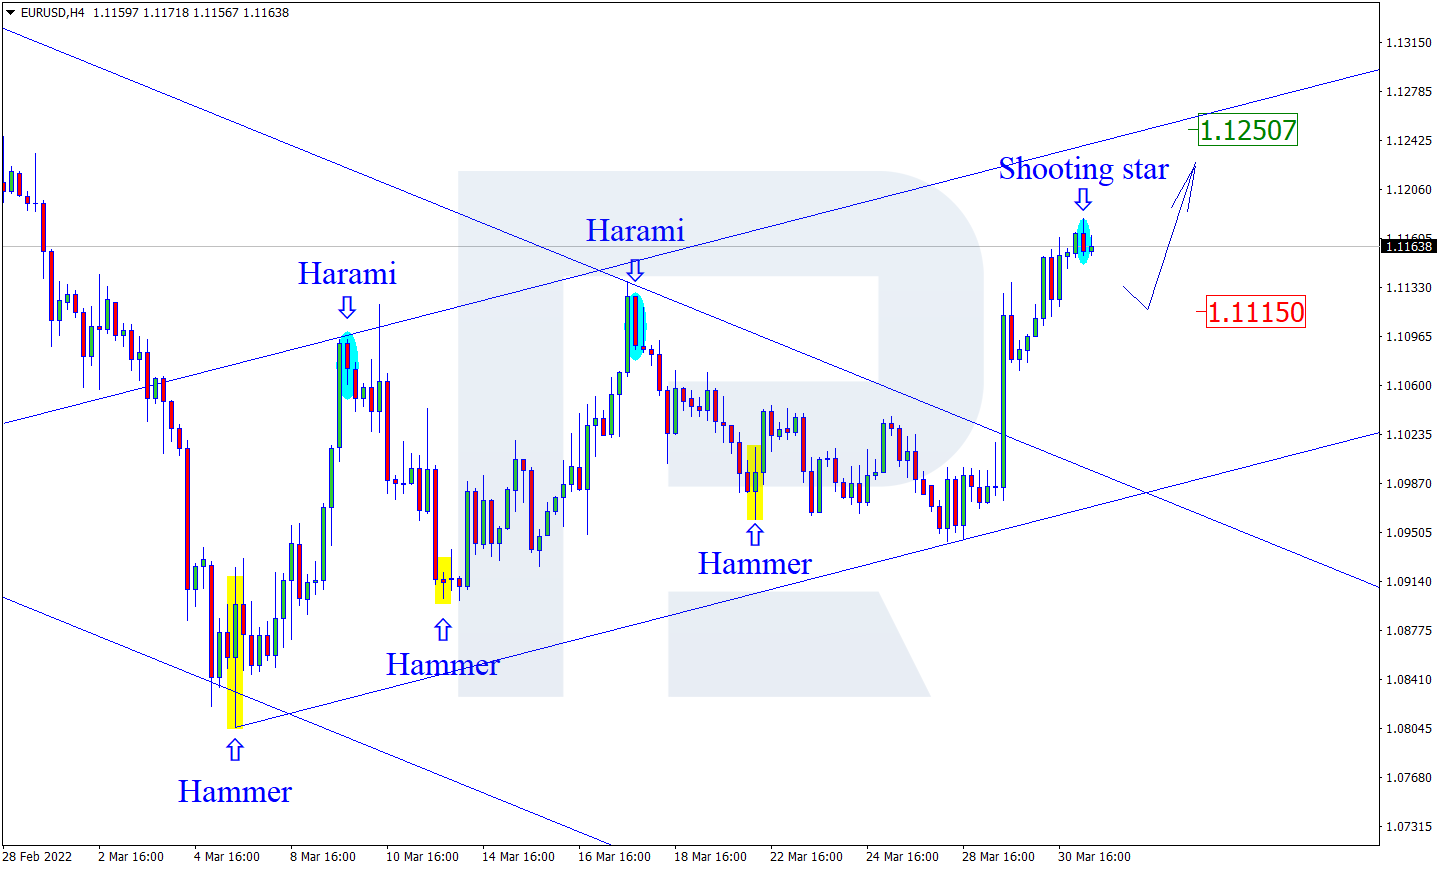
As we can see in the H4 chart, the asset has formed a Shooting Star reversal pattern close to the resistance area. At the moment, EURUSD is reversing in the form of a new descending impulse. In this case, the downside target may be at 1.1115. However, an alternative scenario implies that the price may grow to reach 1.1250 and continue the downtrend without any corrections towards the support level.

EURUSD
Risk Warning: the result of previous trading operations do not guarantee the same results in the future

USDJPY, “US Dollar vs Japanese Yen”

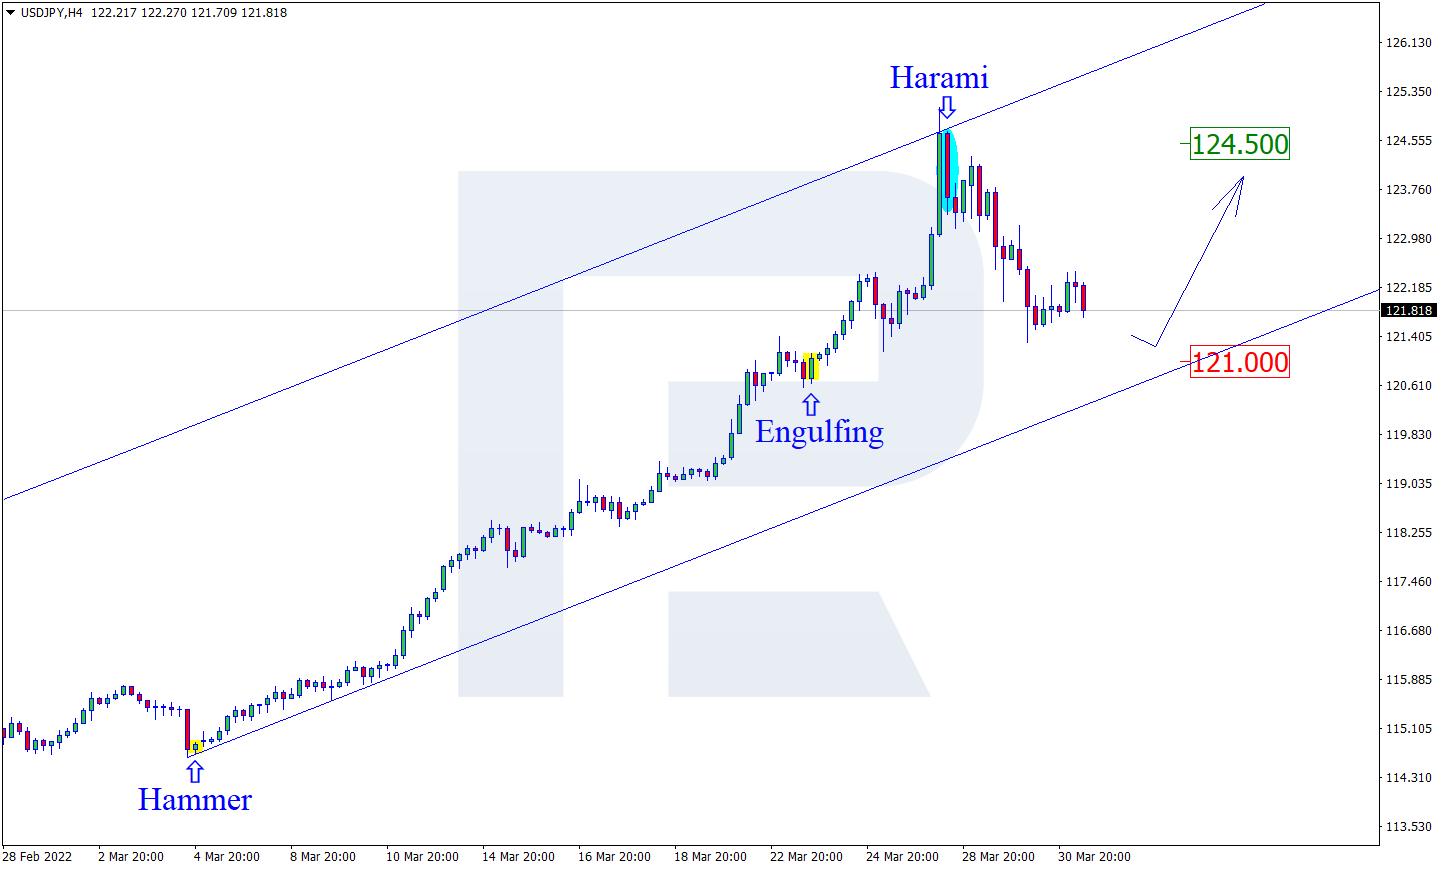
As we can see in the H4 chart, USDJPY has formed a Harami pattern not far from the resistance level. At the moment, the asset may reverse and start a new descending impulse. In this case, the downside correctional target may be at 121.00. At the same time, an opposite scenario implies that the price may grow to reach 124.50 without testing the support area.

USDJPY
Risk Warning: the result of previous trading operations do not guarantee the same results in the future

EURGBP, “Euro vs Great Britain Pound”

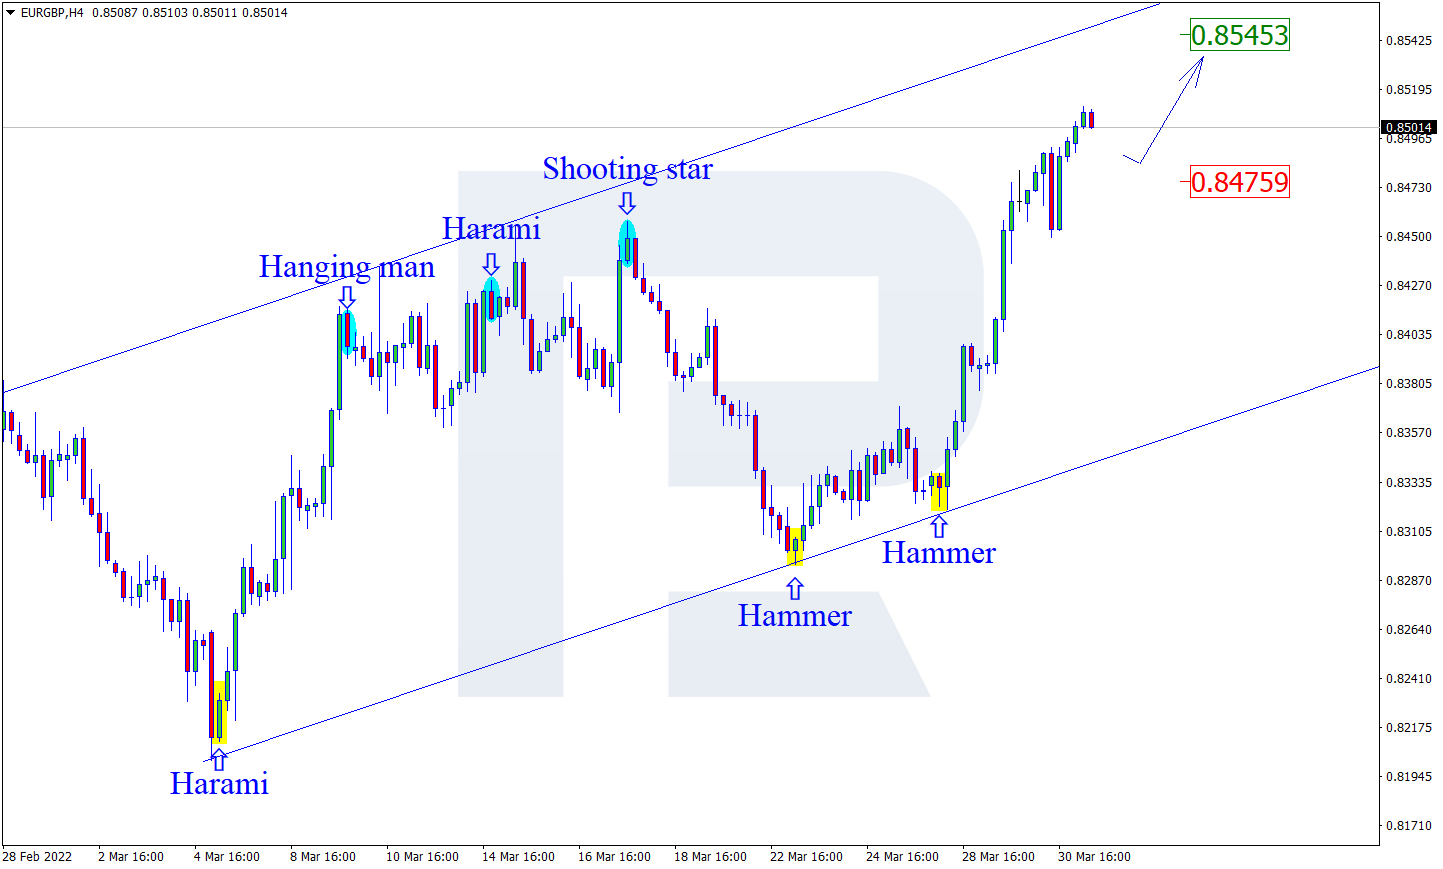
As we can see in the H4 chart, after forming a Hammer reversal pattern near the support area, EURGBP is reversing and may start another ascending wave. In this case, the upside target may be at 0.8545. Later, the market may test the resistance level, break it, and continue the ascending tendency. Still, there might be an alternative scenario, according to which the asset may correct to reach 0.8475 first and then resume trading upwards.

EURGBP

Article By RoboForex.com

Attention!
Forecasts presented in this section only reflect the author’s private opinion and should not be considered as guidance for trading. RoboForex LP bears no responsibility for trading results based on trading recommendations described in these analytical reviews.

Murrey Math Lines 31.03.2022 (USDCHF, GOLD)

Article By RoboForex.com

USDCHF, “US Dollar vs Swiss Franc”

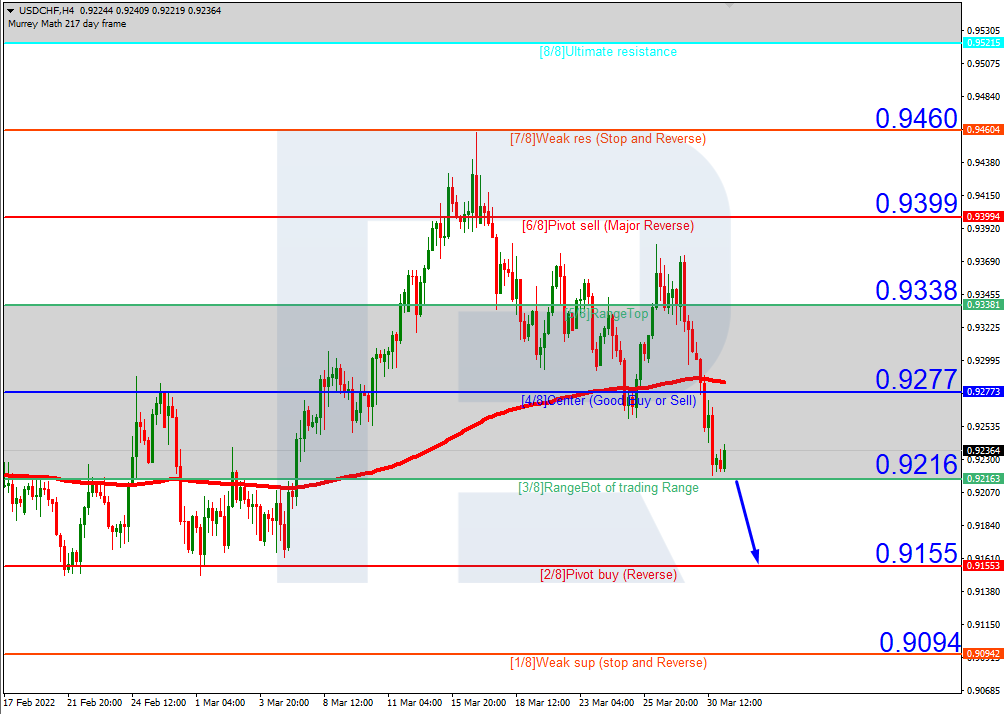
In the H4 chart, after breaking the 200-day Moving Average, USDCHF is trading below it to indicate a possible descending tendency. In this case, the price is expected to break 3/8 and then continue falling to reach the support at 2/8. However, this scenario may be cancelled if the price breaks the resistance at 4/8 to the upside. After that, the instrument may reverse and grow towards 5/8.

USDCHFH4
Risk Warning: the result of previous trading operations do not guarantee the same results in the future

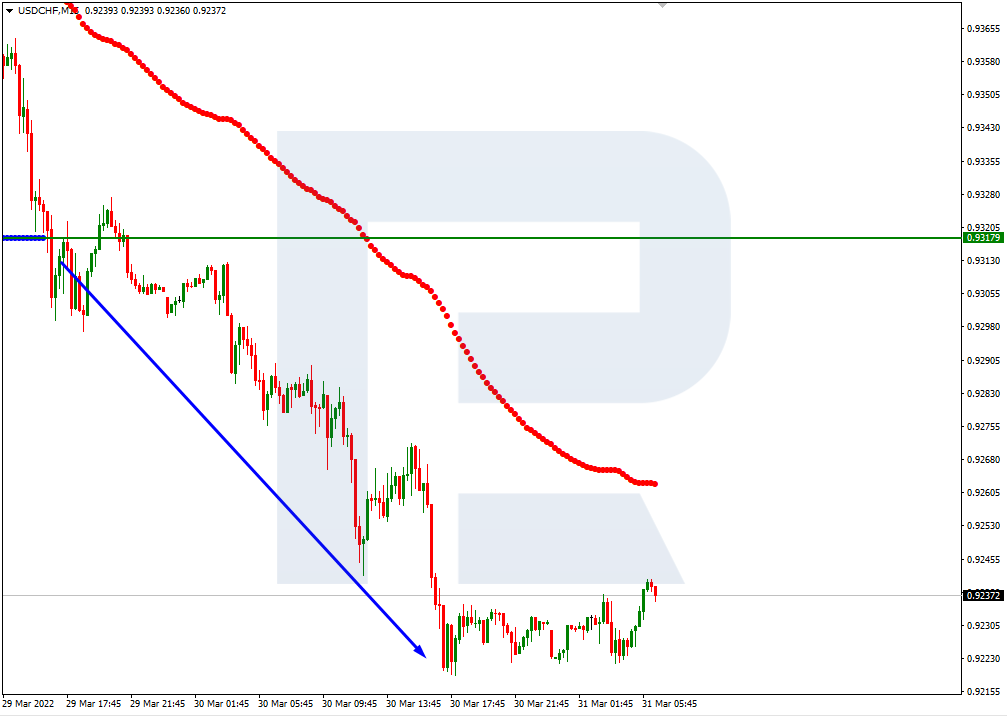
As we can see in the M15 chart, the pair has broken the downside line of the VoltyChannel indicator and, as a result, may continue trading downwards.

USDCHF_M15
Risk Warning: the result of previous trading operations do not guarantee the same results in the future

XAUUSD, “Gold vs US Dollar”

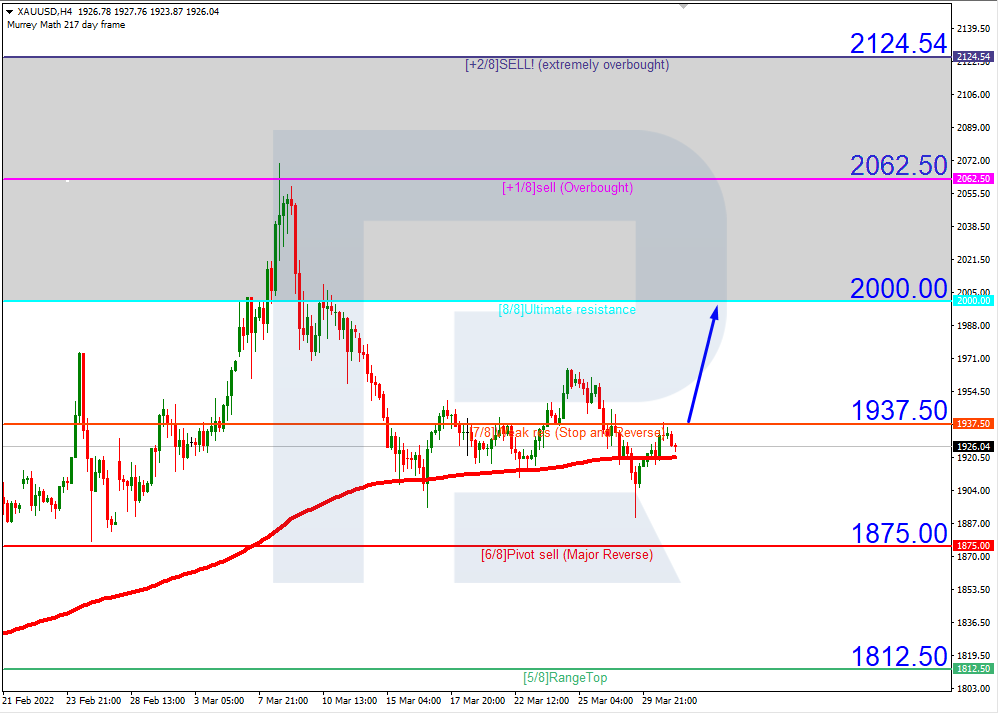
As we can see in the H4 chart, XAUUSD is trading above the 200-day Moving Average, thus indicating a further ascending tendency. In this case, the price is expected to break 7/8 and continue moving upwards to reach the resistance at 8/8. However, this scenario may no longer be valid if the price breaks the support at 6/8 to the downside. After that, the instrument may reverse and form a new descending wave towards 5/8.

XAUUSD_H4
Risk Warning: the result of previous trading operations do not guarantee the same results in the future

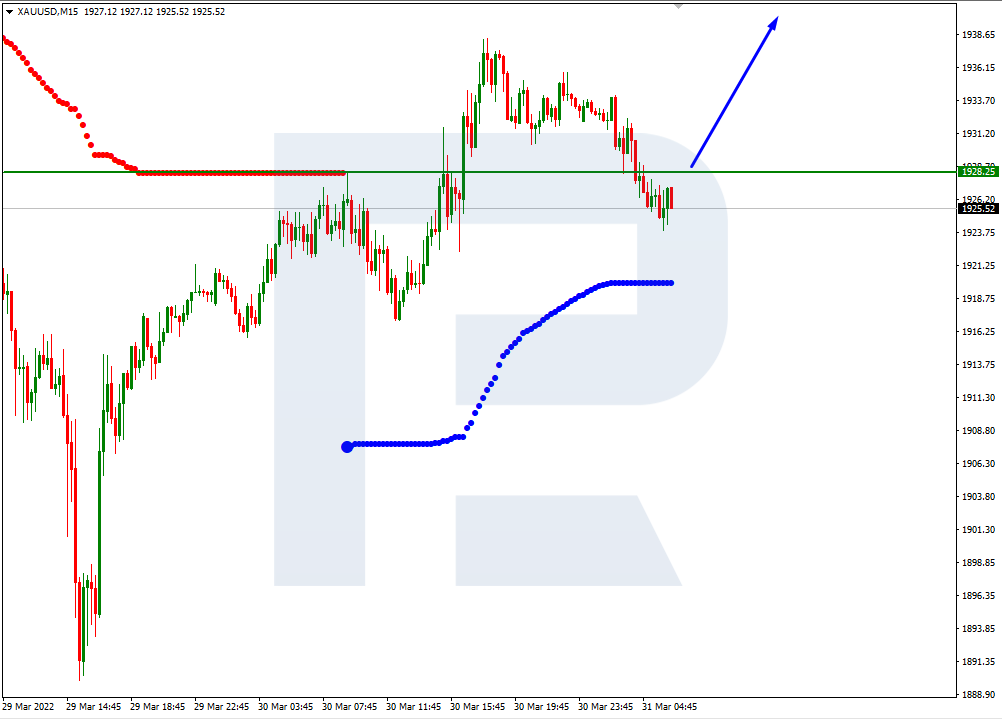
In the M15 chart, the pair may break the upside line of the VoltyChannel indicator and, as a result, continue growing.

XAUUSD_M15
Risk Warning: the result of previous trading operations do not guarantee the same results in the future

Article By RoboForex.com

Attention!
Forecasts presented in this section only reflect the author’s private opinion and should not be considered as guidance for trading. RoboForex LP bears no responsibility for trading results based on trading recommendations described in these analytical reviews.

The Analytical Overview of the Main Currency Pairs on 2022.03.31

by JustForex

The EUR/USD currency pair

Technical indicators of the currency pair:
  • Prev Open: 1.1086
  • Prev Close: 1.1157
  • % chg. over the last day: +0.64%

Spain’s consumer price index jumped from 7.6% to 9.8% year on year. This is the highest value in 30 years. Inflation if Germany rose in March to its highest level in more than 40 years due to higher prices for natural gas and oil products. The annual consumer price index was 7.3% against 5.1% in February. Such a jump in inflation in the EU countries may force the ECB to reconsider its monetary policy towards tightening. That is why the European currency is reacting higher as investors are already considering a tightening scenario. The higher the interest rates, the stronger the national exchange rate.

Trading recommendations
  • Support levels: 1.1136, 1.1037, 1.1017, 1.0963, 1.0917, 1.0887, 1.0823, 1.0633
  • Resistance levels: 1.1196, 1.1291

From the technical point of view, the EUR/USD currency pair trend on the hourly time frame has changed to bullish. The price confidently broke through the priority change level and consolidated above the moving averages. The MACD indicator is in the positive zone, the buyers’ pressure has intensified. Under such market conditions, it is better to look for buy trades on intraday timeframes from the support levels of 1.1037 or 1.1018 around the moving averages. Sell trades should be considered from the support level of 1.1196, but only after a false breakout and only with short targets.

Alternative scenario: if the price breaks down through the 1.1017 support level and fixes below, the uptrend will likely be broken.

EUR/USD
News feed for 2022.03.31:
  • – German Retail Sales at 09:00 (GMT+3);
  • – German Unemployment Rate (m/m) at 10:55 (GMT+3);
  • – Eurozone Unemployment Rate (m/m) at 12:00 (GMT+3);
  • – US Initial Jobless Claims (w/w) at 15:30 (GMT+3);
  • – US Core PCE Price Index (m/m) at 15:30 (GMT+3);
  • – US FOMC Member Williams Speech at 16:00 (GMT+3);
  • – US Chicago PMI (m/m) at 16:45 (GMT+3);
  • – US Natural Gas Storage (w/w) at 17:30 (GMT+3).

The GBP/USD currency pair

Technical indicators of the currency pair:
  • Prev Open: 1.3083
  • Prev Close: 1.3135
  • % chg. over the last day: +0.39%

UK GDP grew by 1.3% in Q4, a growth of 1% was expected. But economic indicators now have little effect on the economy. Geopolitics and the health of the dollar index came out on top. And as geopolitical tensions persist in Eastern Europe and the US Federal Reserve intends to aggressively tighten monetary policy, these factors combine to hurt the British pound.

Trading recommendations
  • Support levels: 1.3117, 1.3074, 1.3015, 1.2989, 1.2863
  • Resistance levels: 1.3181, 1.3244, 1.3274

On the hourly time frame, the GBP/USD currency pair trend is bullish. The price movement pattern starts to show a flat structure. The MACD indicator became inactive. Under such market conditions, buy trades should be considered from the support level of 1.3117, but better with confirmation. For sell deals, it is better to consider the resistance level of 1.3161, but only with short targets.

Alternative scenario: if the price breaks down through the 1.3074 support level and fixes below, the mid-term uptrend will likely be broken.

GBP/USD
News feed for 2022.03.31:
  • – UK GDP (q/q) at 09:00 (GMT+3).

The USD/JPY currency pair

Technical indicators of the currency pair:
  • Prev Open: 122.87
  • Prev Close: 121.82
  • % chg. over the last day: -0.86%

The monetary policy of the Bank of Japan is now “ultra-soft” and is aimed at decreasing the national currency rate (USD/JPY growth). But against the backdrop of the dollar index, and also thanks to the work of the Central Bank of Japan on the debt market, the Japanese yen is now temporarily strengthening. The medium-term forecast remains unchanged – analysts see a continuation of the uptrend.

Trading recommendations
  • Support levels: 120.88, 119.52, 117.72
  • Resistance levels: 122.83, 123.44,125.22

The medium-term trend on the USD/JPY currency pair is bullish. But amid the decline in the dollar index, the price began a corrective movement. The MACD indicator has become negative. Under such market conditions, it is best to look for buy deals, expecting the continuation of the uptrend. First of all, it is worth considering the support level of 120.88, but with additional confirmation. For sell deals, a resistance level of 122.83 or 123.44 may be considered, but only after the sellers’ initiative.

Alternative scenario: If the price fixes below 119.52, the uptrend will likely be broken.

USD/JPY
News feed for 2022.03.31:
  • – Japan Industrial Production (m/m) at 02:50 (GMT+3).

The USD/CAD currency pair

Technical indicators of the currency pair:
  • Prev Open: 1.2491
  • Prev Close: 1.2481
  • % chg. over the last day: -0.08%

The Canadian dollar is a commodity currency and is highly dependent on the movement of oil prices and the dollar index. The weekly drop-in crude oil inventories were accompanied by the release of almost the same amount of oil from the US reserves, which led to a slight decrease in oil prices yesterday. As a result, the USD/CAD pair jumped yesterday, despite a decline in the dollar index. OPEC+ producing countries will meet today. However, analysts do not expect anything substantial from this meeting and are confident that OPEC+ will not increase oil production since high oil prices are beneficial to almost all producing countries except the US.

Trading recommendations
  • Support levels: 1.2453
  • Resistance levels: 1.2563, 1.2655, 1.2713, 1.2754, 1.2851

In terms of technical analysis, the USD/CAD currency pair trend is bearish. The MACD indicator has become positive. The buyer’s pressure has increased. Trade only with short targets, since on the USD/CAD currency pair fundamentally, there are no prerequisites for the medium-term trend, as the dollar index in the medium-term also has the support of the Fed. Under such market conditions, it is better to look for buy trades on the lower timeframes from the support level of 1.2453, but it is better with additional confirmation. For sell deals, it is better to consider the resistance level of 1.2563.

Alternative scenario: if the price breaks through and consolidates above 1.2654, the downtrend will likely be broken.

USD/CAD
News feed for 2022.03.31:
  • – OPEC+ Meeting at 13:00 (GMT+3);
  • – Canada GDP (m/m) at 15:30 (GMT+3).

by JustForex


This article reflects a personal opinion and should not be interpreted as an investment advice, and/or offer, and/or a persistent request for carrying out financial transactions, and/or a guarantee, and/or a forecast of future events.
Amid record inflation in Europe, investors expect ECB to tighten policy

by JustForex

In April, private-sector job growth was surprisingly positive, but fourth-quarter GDP was revised down unexpectedly by a tenth of a percentage point. Investors also continue to monitor the US debt market. Yield spreads on 10- and 2-year Treasury bonds continue to show inversion, raising serious concerns about an impending recession. The Federal Reserve may be tightening policy too aggressively in the near term, and analyst houses are already predicting the next three 0.5% interest rate hikes.

“Given the state of the economy, inflation at its highest level in 40 years, and an unemployment rate close to a record low, it is appropriate to move quickly to neutral policy,” Kansas City Fed President Esther George said on Wednesday. Thomas Barkin, Head of the Federal Reserve Bank of Richmond, said he was ready to raise rates by half a point at the next meeting.

US indices decreased yesterday. The Dow Jones (US30) lost 0.19%, the S&P 500 (US500) fell by 0.63%, and the NASDAQ technology index (US100) decreased by 1.21%.

On Wednesday, European stock markets were mostly down, losing some of the gains of the previous session amid skepticism about the likely success of the latest peace talks between Ukraine and Russia. German DAX (DE30) decreased by 1.45% yesterday, French CAC 40 (FR40) lost 0.74%, Spanish IBEX 35 (ES35) decreased by 0.74%, and only British FTSE 100 (UK100) added 0.55%. Inflation in Germany increased in March to its highest level in more than 40 years due to higher prices for natural gas and oil products. The annual consumer price index was 7.3% compared to 5.1% in February. Such a jump in inflation in the EU countries may force the ECB to reconsider its monetary policy towards tightening. Now in Europe, there is a sale of European short-term bonds. This means that investors are already betting that higher-than-expected inflation will force the European Central Bank to raise interest rates. But despite rising inflation, Germany is preparing to cut Russian gas supplies by activating the first phase of its national contingency plan. The composite index of business and consumer confidence in the Eurozone fell to 108.5 from 113.9 in March, according to the European Commission.

The weekly drop-in crude oil inventories were accompanied by the release of almost the same amount of oil from the US Strategic Oil Reserves. The United States and its allies plan to impose new sanctions on more sectors of the Russian economy, including military supply chains. The OPEC+ countries will meet today. According to several sources, major oil producers are likely to stick to their planned target of increasing production by about 432,000 bpd.

Asian markets traded without a single trade yesterday. Japan’s Nikkei 225 (JP225) decreased by 0.80%, Hong Kong’s Hang Seng (HK50) added 1.39%, and Australia’s S&P/ASX 200 (AU200) increased by 0.67%. China’s manufacturing PMI fell to 49.5 points in March from 50.2 points the previous month, according to the State Bureau of Statistics (SBS). A PMI value above 50 points indicates an increase in activity in the sector, while a lower value indicates a weakening of activity. In Australia, building permits increased by 43.5% month-over-month, while private sector lending increased by 0.6% month-over-month in February.

Analysts say global stock indices are bracing for the worst quarter in 2 years as Russia’s invasion of Ukraine puts upward pressure on commodity prices, forcing the global central banks to revise their monetary policy.

Main market quotes:

S&P 500 (F) (US500) 4,602.45 -29.15 (-0.63%)

Dow Jones (US30) 35,228.81 -65.38 (-0.19%)

DAX (DE40) 14,606.05 -214.28 (-1.45%)

FTSE 100 (UK100) 7,578.75 +41.50 (+0.55%)

USD Index 97.83 -0.58 (-0.59%)

Important events for today:
  • – Japan Industrial Production (m/m) at 02:50 (GMT+3);
  • – China Manufacturing PMI (m/m) at 04:30 (GMT+3);
  • – China Non-Manufacturing PMI (m/m) at 04:30 (GMT+3);
  • – UK GDP (q/q) at 09:00 (GMT+3);
  • – German Retail Sales at 09:00 (GMT+3);
  • – German Unemployment Rate (m/m) at 10:55 (GMT+3);
  • – Eurozone Unemployment Rate (m/m) at 12:00 (GMT+3);
  • – OPEC+ Meeting at 13:00 (GMT+3);
  • – Canada GDP (m/m) at 15:30 (GMT+3);
  • – US Initial Jobless Claims (w/w) at 15:30 (GMT+3);
  • – US Core PCE Price Index (m/m) at 15:30 (GMT+3);
  • – US FOMC Member Williams Speech at 16:00 (GMT+3);
  • – US Chicago PMI (m/m) at 16:45 (GMT+3);
  • – US Natural Gas Storage (w/w) at 17:30 (GMT+3).

by JustForex


This article reflects a personal opinion and should not be interpreted as an investment advice, and/or offer, and/or a persistent request for carrying out financial transactions, and/or a guarantee, and/or a forecast of future events.