The Analytical Overview of the Main Currency Pairs on 2022.03.30

by JustForex

The EUR/USD currency pair

Technical indicators of the currency pair:
  • Prev Open: 1.0978
  • Prev Close: 1.1086
  • % chg. over the last day: +0.98%

Inflation data will be published in Germany and Spain today. Analysts expect Spain’s consumer price index to rise by 0.4%, while Germany’s inflation will add 1.6% over the month. The ECB currently has no plans to change its monetary policy until the end of 2022. But if inflation in Europe continues to accelerate, the ECB will be forced to reconsider its plans. Therefore, investors should also not miss the speech of ECB head Christine Lagarde today.

Trading recommendations
  • Support levels: 1.1037, 1.1017, 1.0963, 1.0917, 1.0887, 1.0823, 1.0633
  • Resistance levels: 1.1136, 1.1291

From the technical point of view, the EUR/USD currency pair trend on the hourly time frame has changed to bullish. The price confidently broke through the priority change level and consolidated above the moving averages. The MACD indicator is in the positive zone, the buyers’ pressure has intensified. Under such market conditions, it is better to look for buy trades on intraday timeframes from the support level of 1.1037. Sell trades should be considered from the support level of 1.1136, but only after a false breakout and only with short targets.

Alternative scenario: if the price breaks down through the 1.0963 support level and fixes below, the uptrend will likely be broken.

EUR/USD
News feed for 2022.03.30:
  • – Eurozone ECB President Lagarde Speaks at 11:00 (GMT+3);
  • – Germany Consumer Price Index (m/m) at 15:00 (GMT+3);
  • – US ADP Nonfarm Employment Change (m/m) at 15:15 (GMT+3);
  • – US GDP (q/q) at 15:30 (GMT+3);
  • – US FOMC Member George Speaks at 20:00 (GMT+3).

The GBP/USD currency pair

Technical indicators of the currency pair:
  • Prev Open: 1.3084
  • Prev Close: 1.3093
  • % chg. over the last day: +0.07%

The British pound also strengthened yesterday, but not as much as the euro. The debt market continues to see a falling spread between the US and UK government bonds yield, hurting the British pound. But against the backdrop of the weakening of geopolitical tensions in Eastern Europe and due to the dollar index decline, the GBP/USD currency pair may show a wave of growth. But the medium-term fundamental picture is still on the side of the dollar index.

Trading recommendations
  • Support levels: 1.3106, 1.3074, 1.3015, 1.2989, 1.2863
  • Resistance levels: 1.3181, 1.3244, 1.3274

On the hourly time frame, the GBP/USD currency pair trend is bullish. The price failed to break through the priority change level. The price made a false breakdown, followed by the buyers’ initiative. The MACD indicator became inactive. Under such market conditions, buy trades should be considered from the support level of 1.3106, but better with confirmation. For sell deals, it is better to consider the resistance level of 1.3181, but only with short targets.

Alternative scenario: if the price breaks down through the 1.3074 support level and fixes below, the mid-term uptrend will likely be broken.

GBP/USD
There is no news feed for today.

The USD/JPY currency pair

Technical indicators of the currency pair:
  • Prev Open: 123.76
  • Prev Close: 122.87
  • % chg. over the last day: -0.72%

Japan’s Finance Minister Shunichi Suzuki said the government will keep a close eye on the national currency to prevent a “bad” weak yen that hurts the economy. The Bank of Japan’s monetary policy is now “ultra-soft,” because Japan wants to slightly accelerate inflation, one of the lowest in the world. Due to the fall of the dollar index and the Central Bank of Japan’s work in the debt market, the Japanese yen might temporarily strengthen.

Trading recommendations
  • Support levels: 120.88, 119.52, 117.72
  • Resistance levels: 122.83, 123.44, 125.22

The medium-term trend on the USD/JPY currency pair is bullish. But amid the decline in the dollar index, the price began a corrective movement. The MACD indicator has become negative. Under such market conditions, it is best to look for buy deals, expecting the continuation of the uptrend. First of all, it is worth considering the support level of 120.88, but with additional confirmation. For sell deals, a resistance level of 122.83 or 123.44 may be considered, but only after the sellers’ initiative.

Alternative scenario: If the price fixes below 119.52, the uptrend will likely be broken.

USD/JPY
News feed for 2022.03.30:
  • – Japan Retail Sales (m/m) at 02:50 (GMT+3).

The USD/CAD currency pair

Technical indicators of the currency pair:
  • Prev Open: 1.2518
  • Prev Close: 1.2501
  • % chg. over the last day: -0.14%

Currencies such as the Canadian dollar and the Australian dollar are commodity currencies that are highly dependent on oil price movements and the dollar index. Yesterday, oil prices began to recover, and the dollar index fell. This led to a decline in USD/CAD quotes, as rising oil prices strengthen the Canadian currency. The monetary policy of the Central Bank of Canada is aimed at tightening, contributing to the strengthening of the Canadian currency.

Trading recommendations
  • Support levels: 1.2481, 1.2453
  • Resistance levels: 1.2563, 1.2655, 1.2713, 1.2754, 1.2851

In terms of technical analysis, the USD/CAD currency pair trend is bearish. The MACD indicator has become inactive, signs of divergence are still present. Trade only with short targets, since on the USD/CAD currency pair fundamentally, there are no prerequisites for the medium-term trend, as the dollar index in the medium term also has the support of the Fed. Under such market conditions, it is better to look for buy trades on the lower timeframes from the support level of 1.2481 or 1.2453, but it is better with additional confirmation. For sell deals, it is better to consider the resistance level of 1.2563.

Alternative scenario: if the price breaks through and consolidates above 1.2654, the downtrend will likely be broken.

USD/CAD
News feed for 2022.03.30:
  • – US Crude Oil Reserves (w/w) at 17:30 (GMT+3).

by JustForex


This article reflects a personal opinion and should not be interpreted as an investment advice, and/or offer, and/or a persistent request for carrying out financial transactions, and/or a guarantee, and/or a forecast of future events.

Investors are optimistic amid little progress in talks between Ukraine and Russia

by JustForex

The S&P 500 increased on Tuesday as rising hopes for a de-escalation of the Ukraine-Russia conflict helped stocks shrug off further bond market signals of a potential recession. All three US indices closed in green territory yesterday. The Dow Jones Index (US30) gained 0.97%, the S&P 500 Index (US500) increased by 1.23%, and the NASDAQ Technology Index (US100) added 1.84%.

The yield on 10-year Treasury bonds temporarily fell below the 2-year Treasury yield for the first time since 2019. Such an event is called a yield curve inversion. It’s should be noted that a yield curve inversion has preceded every recession in the past 40 years.

The US Federal Reserve is trying to weigh what strategy to choose to suppress inflation in a way that does not stop economic growth. Many analysts believe that it will be difficult to find a middle ground here, and the US Fed will have to sacrifice economic recovery to reduce inflation. This week’s employment data will also be taken into account by the Fed when deciding at the May meeting. Bank of America is forecasting three consecutive 50 basis point interest rate hikes.

Yesterday, major European indices jumped significantly against the background of the first steps in the negotiations between Ukraine and Russia. The German DAX (DE30) jumped by 2.79%, French CAC 40 (FR 40) added 3.08%, Spanish IBEX 35 (ES35) increased by 2.98%, British FTSE 100 (UK100) gained 0.86%. Germany’s consumer confidence index fell to a 14-month low amid the Russian-Ukrainian conflict. The consumer confidence index in France also declined. Spain’s consumer price index unexpectedly jumped from 7.6% to 9.8% year on year. This is the highest value in 30 years. Rising inflation in European countries may force the ECB to revise monetary policy towards tightening.

Some progress was made during the talks in Istanbul between Ukraine and Russia. Ukraine is secured in a non-bloc and non-nuclear status without foreign military bases but with security guarantees from guarantor countries (UN Security Council+ states) under the principle of NATO Article 5. Among the guarantors are the countries of the UN Security Council, the United States, France, Turkey, Germany, Canada, Poland, and Israel. With such guarantees, which are equivalent to article 5 of NATO, Ukraine will also not join military-political alliances. But nothing should contradict Ukraine’s right to join the EU. The issue of Crimea is resolved non-military through a bilateral negotiation process, which is given 15 years. The issue of ORLO (LNR and DNR) is resolved separately at the level of the meeting of the presidents of Ukraine and Russia.

Russia is taking two steps to de-escalate the conflict in Ukraine. The Russian Ministry of Defense stated that Russia had decided to reduce hostilities in the Kyiv and Chernihiv directions. However, this does not mean a ceasefire. The General Staff of the Armed Forces of Ukraine believes that the withdrawal of Russian-fascist troops is probably a rotation of individual units and is intended to mislead the military leadership of the Armed Forces of Ukraine (AFU) and create a false image that the occupiers abandoned the plot to encircle the city of Kyiv. At the same time, British intelligence reports that having been convinced of the impossibility of encircling Kyiv, Russia decided to reduce its activity in this direction and transfer part of its forces to the Donetsk and Lugansk sectors of the front to get the South-East of Ukraine and create for itself a land corridor to the Crimea. At the same time, US sources indicate that Russia is not withdrawing troops, but is moving them around Kyiv.

Despite some negotiations, the shelling of Ukraine from the territory of Belarus has become more frequent. Almost all missile launches on Ukrainian territory yesterday were made from Belarus, from the areas of Mozyr and Khoiniki.

Every day Russia confirms that it is a terrorist state. By starting the war in Ukraine, Putin has already created a global food crisis. Deputy Secretary of State Wendy Sherman said Russia’s war in Ukraine has led to critical food shortages in Ukraine, and the effects of the “global food crisis” are being felt around the world.

Sherman also noted that Russia attacked at least three civilian ships carrying supplies from the Black Sea. The Russian Navy is blocking access to Ukrainian ports, depriving Ukraine of its ability to export grain and preventing 94 food ships from entering the Mediterranean Sea. It should also be noted that in Ukraine, the Russians are purposefully destroying food warehouses, thereby increasing the humanitarian catastrophe.

Asian markets closed higher yesterday. Japan’s Nikkei 225 (JP225) gained 1.10% yesterday, Hong Kong’s Hang Seng (HK50) added 1.12% and Australia’s S&P/ASX 200 (AU200) ended the day with +0.70%. Asian stock indices are also generally growing today. The exception is the Japanese market, where negative investor sentiment was caused by fears of a new outbreak of COVID-19 disease. Retail sales in Japan fell 0.8% in February from the same month a year earlier. The fall was recorded for the first time since last September.

Main market quotes:

S&P 500 (F) (US500) 4,631.60 +56.08 (+1.23%)

Dow Jones (US30) 35,294.19 +338.30 (+0.97%)

DAX (DE40) 14,820.33 +402.96 (+2.79%)

FTSE 100 (UK100) 7,537.25 +64.11 (+0.86%)

USD Index 98.42 -0.67 (-0.68%)

Important events for today:
  • – Japan Retail Sales (m/m) at 02:50 (GMT+3);
  • – Eurozone ECB President Lagarde Speaks at 11:00 (GMT+3);
  • – Germany Consumer Price Index (m/m) at 15:00 (GMT+3);
  • – US ADP Nonfarm Employment Change (m/m) at 15:15 (GMT+3);
  • – US GDP (q/q) at 15:30 (GMT+3);
  • – US Crude Oil Reserves (w/w) at 17:30 (GMT+3);
  • – US FOMC Member George Speaks at 20:00 (GMT+3).

by JustForex


This article reflects a personal opinion and should not be interpreted as an investment advice, and/or offer, and/or a persistent request for carrying out financial transactions, and/or a guarantee, and/or a forecast of future events.

How the “Great Resignation” Ties in with a Financial Peak

Insights into “a peak in social optimism of monumental proportions”

By Elliott Wave International

Some people probably remember that country song by Johnny Paycheck from the late ’70s — “Take This Job and Shove It.”

Many of those in the younger generations may not have heard of it given the song was released more than 40 years ago. However, many of them caught the spirit of it just the same as they quit their jobs in droves in what has been called the “Great Resignation.”

You may recall similar headlines to these:

  • One Third Of Millennials Plan To Quit Their Jobs After The Pandemic … (April 6, 2021, Forbes)
  • Study: Gen Z, Millennials Driving ‘The Great Resignation’ (Aug. 26, 2021, U.S. News)

Indeed, in the last three quarters of 2021, 33 million Americans quit their jobs, and many of them did so without other job prospects.

But what has been driving this “quitting spree”?

Put succinctly, the desire for better working conditions and the optimistic idea that they can be had just around the corner.

Here’s how the Elliott Wave Financial Forecast, a monthly publication which provides analysis of key U.S. financial markets, described this mindset in October:

Here’s the Grand-Supercycle kicker shown on the cover of a recent issue of Time magazine: “There Are 9.2 Million Open Jobs” and “Nobody Wants Them.” Only at a peak in social optimism of monumental proportions would so many choose to “Chill Out” amidst such an abundance of opportunity.

Interestingly, the tops in the Dow Industrials and S&P 500 occurred just three months later in early January.

On Feb. 15, a New York Times article said:

An idealistic generation has set about demanding a utopian world. More diversity, more attention to structural racism, better hours, better boundaries, better leave policies, better bosses.

However, with stocks in a downtrend and optimism fading, here’s an update on the “Great Resignation.”

This is a March 13 Fox Business headline:

‘Great Resignation’: Over 70% of workers regret quitting their jobs

It seems that the majority of people who quit their jobs are learning the harsh reality that very few workplaces even approach an idealist’s version of “utopia.”

Expect this pessimism, as reflected by the Elliott wave model, to increase in all of society, including financial markets.

In case you’re unfamiliar with the Elliott wave model, get insights by reading Frost & Prechter’s Elliott Wave Principle: Key to Market Behavior. Here’s a quote:

The Wave Principle is governed by man’s social nature, and since he has such a nature, its expression generates forms. As the forms are repetitive, they have predictive value.

Here’s the good news: You can read the entire online version of the book — 100% free!

All that’s required for free access is a Club EWI membership. Club EWI is the world’s largest Elliott wave educational community and members enjoy complimentary access to a wealth of Elliott wave resources on investing and trading.

Club EWI is free to join and members are under no obligations.

Get started by following this link: Elliott Wave Principle: Key to Market Behavior — free and unlimited access.

This article was syndicated by Elliott Wave International and was originally published under the headline How the “Great Resignation” Ties in with a Financial Peak. EWI is the world’s largest market forecasting firm. Its staff of full-time analysts led by Chartered Market Technician Robert Prechter provides 24-hour-a-day market analysis to institutional and private investors around the world.

Soaring crude prices make the cost of pretty much everything else go up too because we almost literally eat oil

By Veronika Dolar, SUNY Old Westbury 

The price of oil has been spiking in recent weeks in response to concerns that the war in Ukraine will significantly reduce supply. But what happens in oil markets never stays in oil markets.

The price of U.S. crude oil jumped to a 13-year high of US$130 of on March 6, 2022. It has come down but has been trading above $110 since March 17. That’s over 60% higher than it was in mid-December, before fears of a Russian invasion began to mount.

Of course, this has pushed up the cost of gasoline, which hit an average of $4.32 per gallon in the U.S. on March 14. But it’s less well understood how rising energy prices leak into the prices consumers pay for toys, electronics, food and almost every other product you could think of.

Energy is becoming one of the main causes of inflation, by which I mean a sustained, generalized increase in the prices of goods and services in an economy. The latest data shows prices are rising at an annualized pace of 7.9%, the highest in 40 years.

In my economics classes, I like to joke to my students that we eat petroleum. Students have a hard time imagining drinking crude oil or gasoline, but in fact it’s both figuratively and almost literally true – and I’m not even referring to how humans ingest about a credit card’s worth of oil-based plastic every week.

Let me explain.

Planes, packages and polyester

Oil prices affect the prices of other goods and services in a few significant ways.

The most obvious is that petroleum powers the vast majority of cars, planes and other vehicles that move stuff around. About 71% of the 6.6 billion barrels of petroleum the U.S. consumed in 2020 was used for various types of fuels, such as gas, diesel and jet fuel.

This pushes up transportation costs and makes shipping everything from refrigerator components to everyday items like toothpaste more expensive. Businesses can choose to absorb the cost – for example, if their market is highly competitive – but usually pass it on to customers.

But oil is also a key ingredient in much of the stuff people buy, both in the packaging and in the products themselves, especially food. That’s where most of the other 29% of the oil Americans use comes in.

Petrochemicals derived from petroleum are used to manufacture clothes, computers and more. For example, the quantity of oil-based polyester in clothing has doubled since 2000. Over half of all fibers produced around the world are now made from petroleum, requiring over 1% of all oil consumed.

In addition, the cosmetic industry is heavily dependent on petroleum since items such as hand cream, shampoo and most makeup are made out of petrochemicals. And like with many products, all those creams and beauty liquids are put in single-use plastic containers made from oil.

Similarly, the vast majority of toys produced today are made out of plastic.

Crude in our cookies

The food industry is especially sensitive to the price of energy, more so than any other sector because petroleum is such a key component of its supply chain at every step of the way, from planting and harvesting through processing and packaging.

Interestingly, the biggest usage of petroleum in industrial farming is not transportation or fueling machinery but rather the use of fertilizers. Vast amounts of oil and natural gas go into fertilizers and pesticides that are used to produce and protect grains, vegetables and fruits.

That’s one of the reasons it takes 283 gallons of oil to raise one 1,250-pound steer. And it’s why even a loaf of bread requires an unusually high amount of energy.

Oil is also an ingredient in the food we consume. The main food product that comes from petroleum is known as mineral oil. It’s commonly used to make foods last longer because petroleum doesn’t go rancid. Packaged baked goods like cookies and pizza often contain mineral oil as a way of preserving their shelf life.

Petrochemicals are also used to make food dyes, which can be found in cereals and candy.

Paraffin wax, a colorless or white wax made from petroleum, is used in the production of some chocolates and sprayed onto fruits to slow down spoilage and give them a glossy finish. It also helps chocolates stay solid at room temperature.

And plastic is a vital part of food packaging because it is relatively cheap, durable and lightweight, it provides protection and is sanitary.

Oil inflation and the Fed

The importance of oil to the U.S. economy has been a big concern since the oil crisis of 1973, when prices spiked, prompting calls to conserve energy.

Since then, the amount of oil consumed for every dollar of economic output has declined about 40%. In 1973, for example, it took just under one barrel of oil to produce $1,000 worth of economic output. Today, it takes less than half a barrel. That’s the good news.

The bad is that, because the U.S. economy is now 18 times bigger than it was in 1973, it requires a lot more oil to function.

That’s why the surging price of oil is now the main driver of inflation – and why the Federal Reserve is preparing for some big increases in interest rates to fight it.

About the Author:

Veronika Dolar, Assistant Professor of Economics, SUNY Old Westbury

This article is republished from The Conversation under a Creative Commons license. Read the original article.


What is the Best Way You Can Withdraw Your Crypto In AED?

The digitalization of monetary systems has left the world in awe, and many have taken it in their stride. Money is no longer on paper and has a vast difference from what it used to be. One of the major variants being Cryptocurrency.

Not many countries worldwide have come to terms with the concept of cryptocurrency. There are various reasons associated with that but if your interest lies within the digital abyss then UAE is one of the best options out there. UAE offers easy access to cryptocurrency and other forms of digital assets. The country has built its rapport through bringing transparency and ease in its banking system. UAE offers you the opportunity to cash-out funds free of restrictions. So,  if you are in the country and looking for ways to withdraw crypto in AED, you are at the right spot at the right time.

With a stable political condition, UAE stands to benefit the most when it comes to fintech. In the year 2022, the UAE market is predicted to rely solely on digital payments with an estimated total transaction of US$26,773m. If facts and figures interest you, then hold on tight as the neo banking segment within UAE has been predicted to show a revenue growth of 44.8% in 2023. Don’t forget that life is a volatile thing in the bustle, and you could need cash anytime. This is where we slide in to help you learn how to withdraw crypto in UAE.

How to cash out crypto in AED?

If you are looking for ways to withdraw crypto in the form of cash (AED, preferably), then there are few methods to do so but here are two famous methods used widely. These include

  • Through exchange services
  • Through private personnel

If you are planning to withdraw your crypto through a private person then this could be risky in terms of finances because people have faced many scams through this. So it is always recommended to go with a trusted person or through exchanges because not only do you get the best rates but also it is safe and secure.

Exchanges cut their fees but it guarantees your money’s safety and security. So it’s definitely worth it. However on exchanges there are further many methods like P2P or through credit and debit card. So in BTC you are doing private deals on exchanges with other sellers or buyers but the exchange acts as a third party in your deal. But using a credit or debit card to deal in crypto directly with exchange is more secure so I will recommend that.

So here are the best exchanges where you can withdraw your crypto in AED:

● BitOasis

The creme de la creme of the UAE cryptocurrencies exchanges is BitOasis. Headquartered in the UAE with a wide variety of users all across the world, this exchange platform is one of a kind. If you are a novel player in the field or have been involved in professional trading, To cash out crypto in AED through BitOasis. Because Bitoasis is the local exchange then it could be more secure and fast in terms of your assets withdrawal.  Bitoasis comes with a multi-signature security wallet which offers great security to your funds and assets.

Rain

Rain would also be the best choice because it is also a local crypto exchange that offers withdrawal of your funds or assets in AED to your bank account. Rain is also a licensed crypto exchange just like Bitoasis which comes with bank graded security online and offline to make sure your assets and funds are secure.

● Binance

This exchange platform allows you to trade cryptocurrencies and cash them out or sell them where needed. You can also choose to store your digital currency in the Wallet provided by Binance. The company supports over 500 cryptocurrencies with the option for virtual tokens.Binance is well-known in crypto space but it is not a local exchange so it is again recommended to go with local exchange when withdrawing funds in AED in UAE or middle east.

In a nutshell

Digital money is the talk of the town and is the most innovative thing you can ever experience. If you are in UAE, then these services are the best that you can opt for to convert crypto into AED. Not only are the service charges lower in UAE, but also the methods are safe, quick and secure. Happy Crypto-ing!


Can my electric car power my house? Not yet for most drivers, but vehicle-to-home charging is coming

By Seth Blumsack, Penn State 

As manufacturers introduce new models of electric vehicles, demand for them is growing steadily. New EV sales in the U.S. roughly doubled in 2021 and could double again in 2022, from 600,000 to 1.2 million. Auto industry leaders expect that EVs could account for at least half of all new U.S. car sales by the end of the decade.

EVs appeal to different customers in different ways. Many buyers want to help protect the environment; others want to save money on gasoline or try out the latest, coolest technology.

In areas like California and Texas that have suffered large weather-related power failures in recent years, consumers are starting to consider EVs in a new way: as a potential electricity source when the lights go out. Ford has made backup power a selling point of its electric F-150 Lightning pickup truck, which is due to arrive in showrooms sometime in the spring of 2022. The company says the truck can fully power an average house for three days on a single charge.

So far, though, only a few vehicles can charge a house in this way, and it requires special equipment. Vehicle-to-home charging, or V2H, also poses challenges for utilities. Here are some of the key issues involved in bringing V2H to the mainstream.

Gasoline can flow only one way, from pump to car, but with some technical advances, EVs soon will be able to send power back to homes.

The ABCs of V2H

The biggest factors involved in using an EV to power a home are the size of the vehicles’s battery and whether it is set up for “bidirectional charging.” Vehicles with this capacity can use electricity to charge their batteries and can send electricity from a charged battery to a house.

There are two ways to judge how “big” a battery is. The first is the total amount of electric fuel stored in the battery. This is the most widely publicized number from EV manufacturers, because it determines how far the car can drive.

Batteries for electric sedans like the Tesla Model S or the Nissan Leaf might be able to store 80 to 100 kilowatt-hours of electric fuel. For reference, 1 kilowatt-hour is enough energy to power a typical refrigerator for five hours.

A typical U.S. home uses around 30 kilowatt-hours per day, depending on its size and which appliances people use. This means that a typical EV battery can store enough electric fuel to supply the total energy needs of a typical home for a couple of days.

The other way to assess the capacity of an EV battery is its maximum power output in backup power mode. This represents the largest amount of electric fuel that could be delivered to the grid or a house at any given moment. An EV operating in backup mode will typically have a lower maximum power output than when in driving mode. The backup power capacity is important, because it indicates how many appliances an EV battery could power at once.

This figure is not as widely publicized for all EVs, in part because vehicle-to-home charging hasn’t yet been widely deployed. Ford has advertised that its electric F-150 would have a maximum V2H power output of 2.4 kilowatts, potentially upgradable to 9.6 kilowatts – about the same as a single higher-end Tesla Powerwall home energy storage unit.

On the low end, 2.4 kilowatts is enough power to run eight to 10 refrigerators at the same time and could run much of a typical household continuously for a few days – or much more if the electricity is used sparingly. On the high end, a power level of 9.6 kilowatts could run more appliances or higher-powered ones, but that level of usage would drain the battery faster.

Storing power when it’s cheaper

To draw home power from their cars, EV owners need a bidirectional charger and an electric vehicle that is compatible with V2H. Bidirectional chargers are already commercially available, though some can add several thousand dollars to the price of the car.

A limited number of EVs on the market now are compatible with V2H, including the Ford Lightning, Nissan Leaf and Mitsubishi Outlander. General Motors and Pacific Gas & Electric plan to test V2H charging in California in mid-2022 using multiple GM electric vehicles.

Some homeowners might hope to use their vehicle for what utility planners call “peak shaving” – drawing household power from their EV during the day instead of relying on the grid, thus reducing their electricity purchases during peak demand hours. To do this, they might need to install special metering equipment that can control both the discharging of the vehicle battery and the flow of power from the grid to the home.

Peak shaving makes the most sense in areas where utilities have time-of-use electric pricing, which makes power from the grid much more expensive during the day than at night. A peak-shaving household would use cheap electricity at night to charge the EV battery and then store that electricity to use during the day, avoiding high electricity prices.

Utilities and the future of V2H

While V2H capabilities exist now, it will likely be a little while before they see widespread adoption. The market for V2H-compatible electric vehicles will need to grow, and the costs of V2H chargers and other equipment will need to come down. As with Tesla’s Powerwall, the biggest market for V2H will probably be homeowners who want backup power for when the grid fails but don’t want to invest in a special generator just for that purpose.

Enabling homeowners to use their vehicles as backup when the power goes down would reduce the social impacts of large-scale blackouts. It also would give utilities more time to restore service – especially when there is substantial damage to power poles and wires, as occurred during Hurricane Ida in Louisiana in August 2021.

Power companies will still have to spend money building and maintaining the grid to provide reliable service. In some areas, those grid maintenance costs are passed on to customers through peak demand charges, meaning that people without V2H – who will be more likely to have lower incomes – may well bear a greater share of those costs than those with V2H, who will avoid purchasing peak power from the grid. This is especially true if lots of EV owners use rooftop solar panels to charge their car batteries and use those vehicles for peak shaving.

Still, even with V2H, electric vehicles are a huge potential market for electric utilities. Bidirectional charging is also an integral part of a broader vision for a next-generation electric grid in which millions of EVs are constantly taking power from the grid and giving it back – a key element of an electrified future. First, though, energy planners will need to understand how their customers use V2H and how it may affect their strategies for keeping the grid reliable.

About the Author:

Seth Blumsack, Professor of Energy and Environmental Economics and International Affairs, Penn State

This article is republished from The Conversation under a Creative Commons license. Read the original article.


Ichimoku Cloud Analysis 29.03.2022 (GBPUSD, USDCAD, NZDUSD)

Article By RoboForex.com

GBPUSD, “Great Britain Pound vs US Dollar”

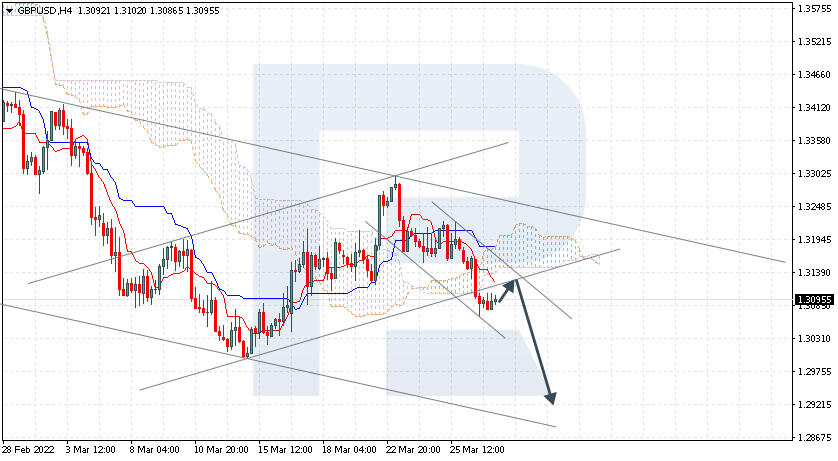
GBPUSD is trading at 1.3095; the instrument is moving below Ichimoku Cloud, thus indicating a descending tendency. The markets could indicate that the price may test Tenkan-Sen and Kijun-Sen at 1.3120 and then resume moving downwards to reach 1.2920. Another signal in favour of a further downtrend will be a rebound from the rising channel’s downside border. However, the bearish scenario may no longer be valid if the price breaks the cloud’s upside border and fixes above 1.3250. In this case, the pair may continue growing towards 1.3345.

GBPUSD
Risk Warning: the result of previous trading operations do not guarantee the same results in the future

USDCAD, “US Dollar vs Canadian Dollar”

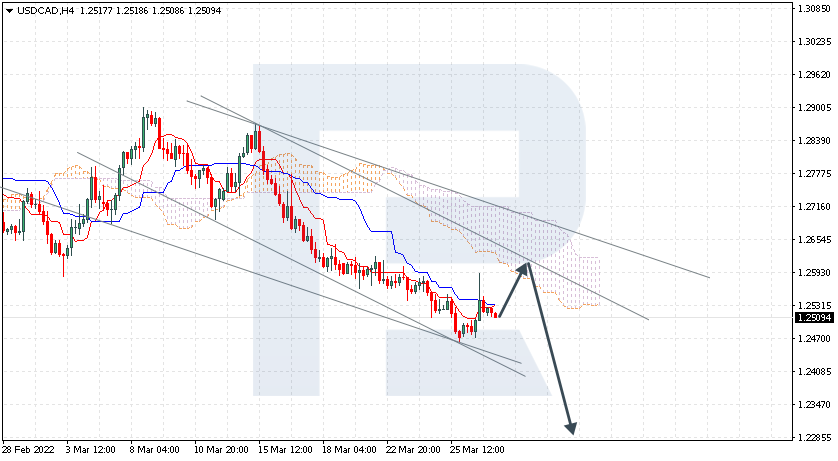
USDCAD is trading at 1.2509; the instrument is moving below Ichimoku Cloud, thus indicating a descending tendency. The markets could indicate that the price may test the cloud’s downside border at 1.2595 and then resume moving downwards to reach 1.2285. Another signal in favour of a further downtrend will be a rebound from the descending channel’s upside border. However, the bearish scenario may no longer be valid if the price breaks the cloud’s upside border and fixes above 1.2725. In this case, the pair may continue growing towards 1.2815.

USDCAD
Risk Warning: the result of previous trading operations do not guarantee the same results in the future

NZDUSD, “New Zealand Dollar vs US Dollar”

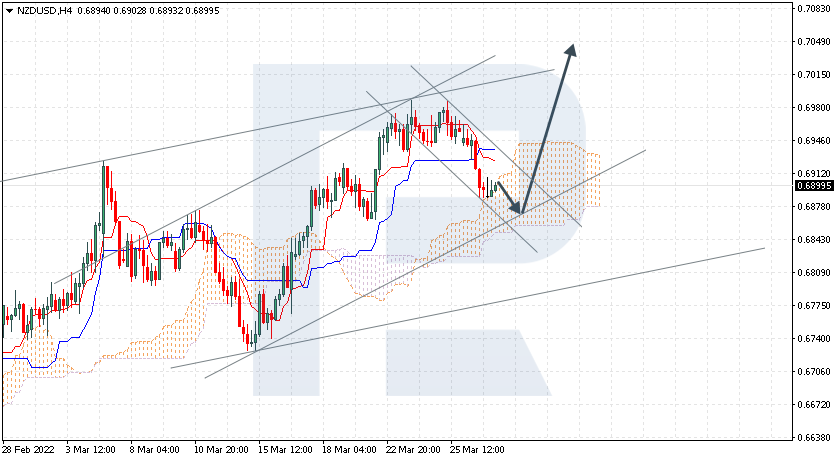
NZDUSD is trading at 0.6899; the instrument is moving above Ichimoku Cloud, thus indicating an ascending tendency. The markets could indicate that the price may test the cloud’s downside border at 0.6870 and then resume moving upwards to reach 0.7045. Another signal in favour of a further uptrend will be a rebound from the rising channel’s downside border. However, the bullish scenario may no longer be valid if the price breaks the cloud’s downside border and fixes below 0.6825. In this case, the pair may continue falling towards 0.6735. To confirm further growth, the asset must break the rising channel’s upside border and fix above 0.6940.

NZDUSD

Article By RoboForex.com

Attention!
Forecasts presented in this section only reflect the author’s private opinion and should not be considered as guidance for trading. RoboForex LP bears no responsibility for trading results based on trading recommendations described in these analytical reviews.

Japanese Candlesticks Analysis 29.03.2022 (XAUUSD, NZDUSD, GBPUSD)

Article By RoboForex.com

XAUUSD, “Gold vs US Dollar”

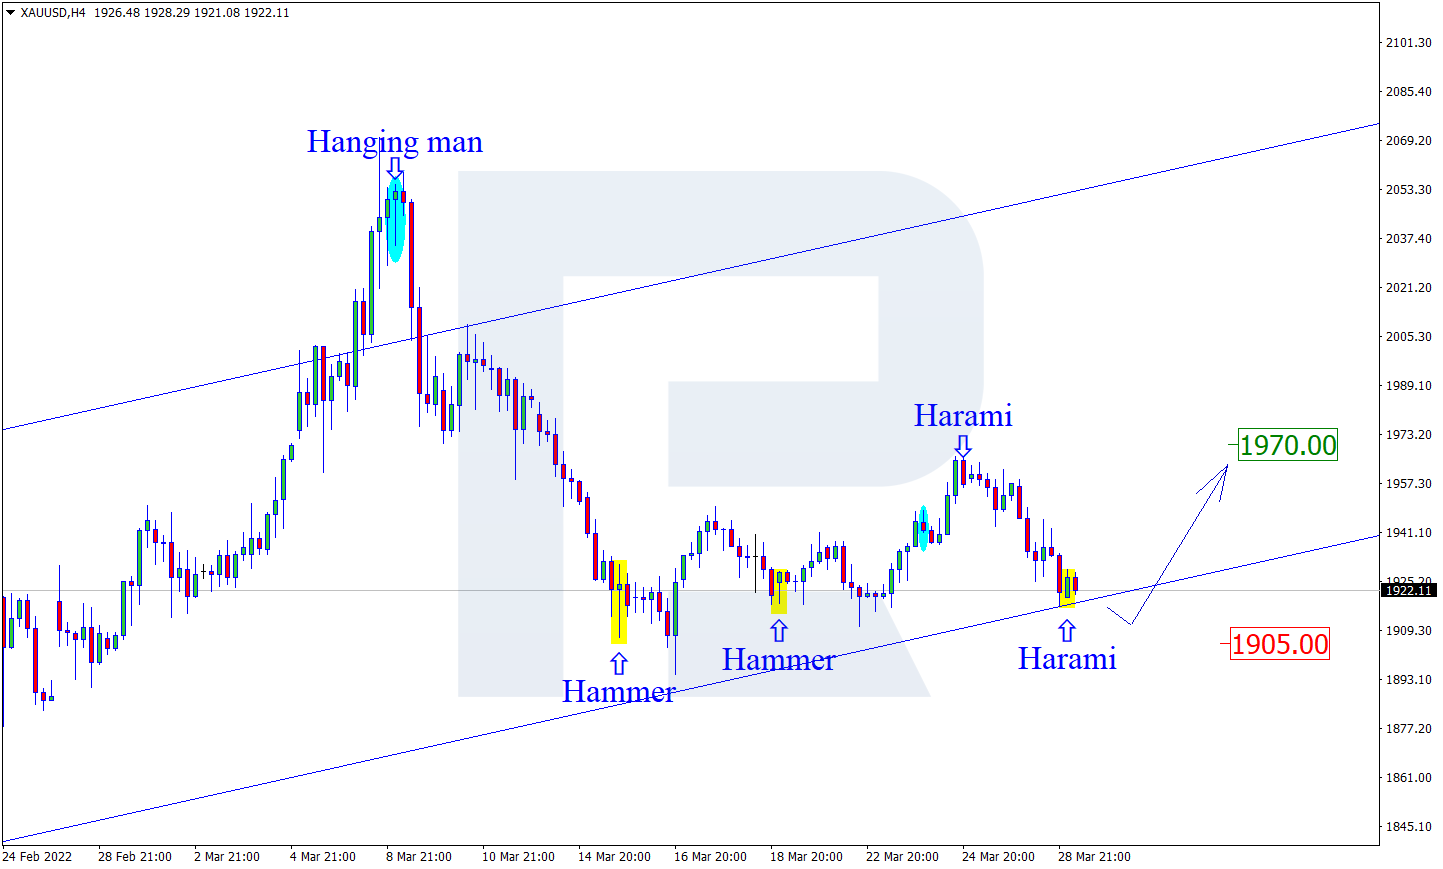
As we can see in the H4 chart, XAUUSD has formed a Harami pattern not far from the support area. At the moment, the asset is reversing in the form a new ascending impulse. In this case, the upside target may be the resistance level at 1970.00. At the same time, an opposite scenario implies that the price may correct to reach 1905.00 before resuming the uptrend.

XAUUSD
Risk Warning: the result of previous trading operations do not guarantee the same results in the future

NZDUSD, “New Zealand vs US Dollar”

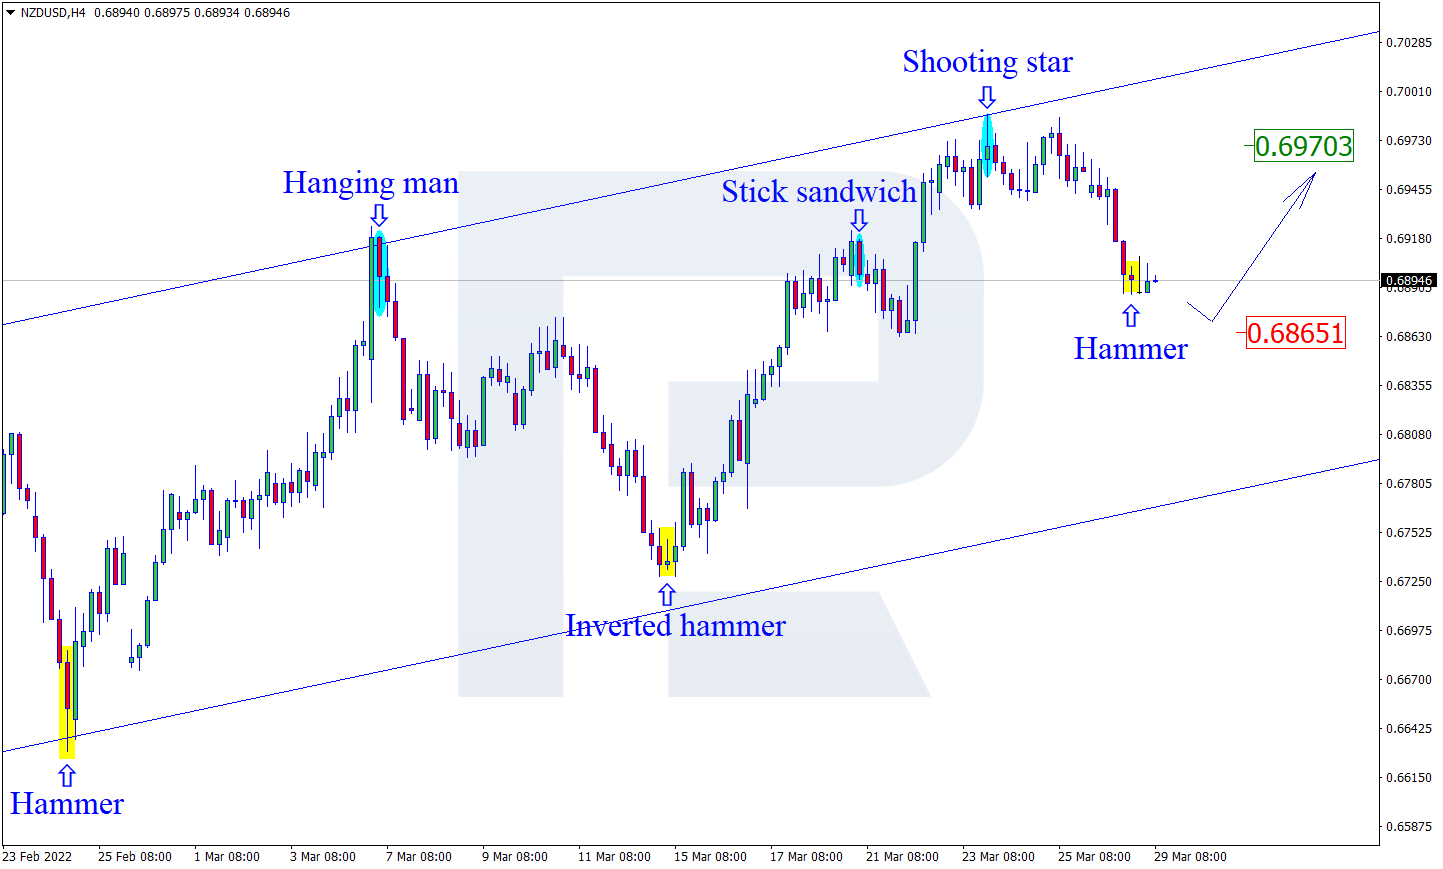
As we can see in the H4 chart, NZDUSD has formed a Hammer reversal pattern close to the support area. At the moment, the asset is reversing and may form another rising impulse. In this case, the upside target is at 0.6970. After that, the asset may break the resistance level and continue moving upwards. However, an alternative scenario implies that the price may correct to reach 0.6865 first and then resume its ascending tendency.

NZDUSD
Risk Warning: the result of previous trading operations do not guarantee the same results in the future

GBPUSD, “Great Britain Pound vs US Dollar”

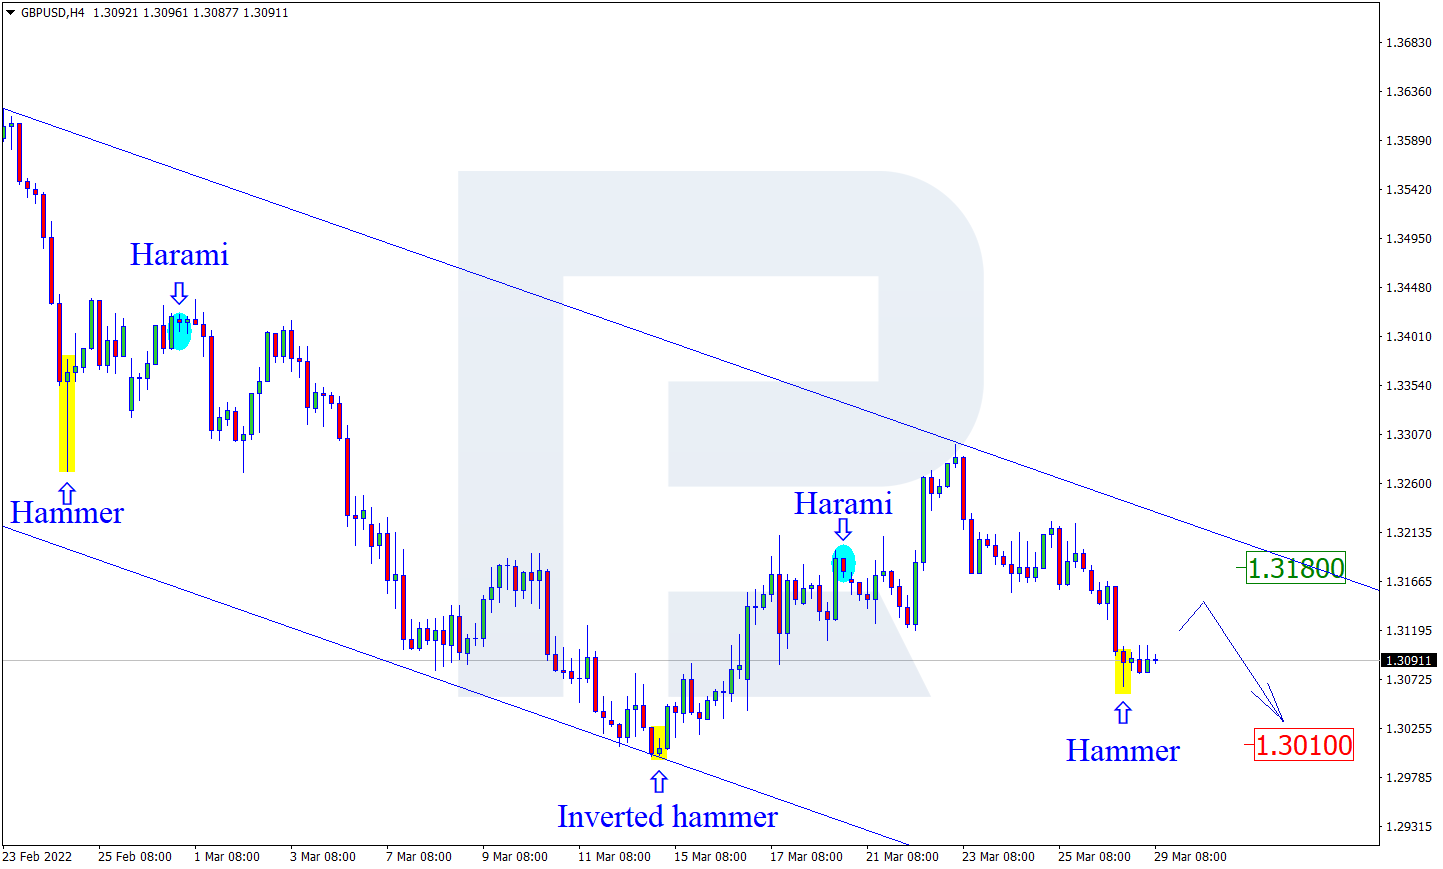
As we can see in the H4 chart, GBPUSD has formed several reversal patterns, such as Harami, near the support area. At the moment, the pair is reversing and may form a new ascending impulse. In this case, the upside target may be at 1.3180. After testing the resistance level, the market may rebound from it and resume trading downwards. Still, there might be an alternative scenario, according to which the asset may fall to reach 1.3010 without any pullbacks.

GBPUSD
Risk Warning: the result of previous trading operations do not guarantee the same results in the future

Article By RoboForex.com

Attention!
Forecasts presented in this section only reflect the author’s private opinion and should not be considered as guidance for trading. RoboForex LP bears no responsibility for trading results based on trading recommendations described in these analytical reviews.

The Analytical Overview of the Main Currency Pairs on 2022.03.29

by JustForex

The EUR/USD currency pair

Technical indicators of the currency pair:
  • Prev Open: 1.0983
  • Prev Close: 1.0986
  • % chg. over the last day: +0.03%

The fundamental picture for the dollar index is now positive, while it is negative for the European currency. This is because the Fed will aggressively raise interest rates this year and most likely next year, while the ECB does not plan to change its monetary policy until the end of 2022. In Europe, conditions are ripe for tightening monetary policy based on an analysis of the ratio of inflation to interest rates. The medium-term forecast is a decrease in EUR/USD.

Trading recommendations
  • Support levels: 1.0963, 1.0917, 1.0887, 1.0823, 1.0633
  • Resistance levels: 1.1007, 1.1037 1.1079, 1.1112, 1.1291

From the technical point of view, the trend on the EUR/USD currency pair on the hourly time frame is still bearish. The MACD indicator is positive, the buyer’s pressure has increased. Under such market conditions, it is better to look for sell trades on the intraday time frames from the resistance level of 1.1007. Buy trades should be considered from the support level of 1.0917, but only with short targets.

Alternative scenario: if the price breaks out through the 1.1037 resistance level and fixes above, the mid-term uptrend will likely resume.

EUR/USD
News feed for 2022.03.29:
  • – US FOMC Member Williams Speech at 16:00 (GMT+3);
  • – US CB Consumer Confidence at 17:00 (GMT+3);
  • – US JOLTs Job Openings (m/m) at 17:00 (GMT+3).

The GBP/USD currency pair

Technical indicators of the currency pair:
  • Prev Open: 1.3172
  • Prev Close: 1.3093
  • % chg. over the last day: -0.60%

The latest Bank of England meeting minutes and politicians’ comments indicate that the Bank of England is ready to take a more dovish stance and stop with further rate hikes. Even despite the growth of inflation, which this year might reach 8%. As a result, the fundamental picture for the GBP/USD currency pair looks extremely vague. On the one hand, the tightening of the US Federal Reserve’s policy will help strengthen the dollar. On the other hand, the Bank of England may change its mind and continue to raise interest rates to fight inflation. As a result, the GBP is in a better position than the EUR but worse than the USD. The medium-term forecast is a decline in GBP/USD.

Trading recommendations
  • Support levels: 1.3074, 1.3015, 1.2989, 1.2863
  • Resistance levels: 1.3138, 1.3244, 1.3274

On the hourly time frame, the GBP/USD currency pair trend is bullish. But yesterday, the price tested the priority change level. The movement was impulsive, and the buyers’ reaction was weak, so there is a high probability of breaking the level of 1.3074 and changing the priority. But the MACD indicator shows the weakness of the sellers. Under such market conditions, buy trades should be looked for from the support level of 1.3074, but better with confirmation in the form of buyers’ initiative. Currently, there is none. The best way to sell is to consider the resistance level of 1.3138, but only with short targets.

Alternative scenario: if the price breaks down through the 1.3074 support level and fixes below, the mid-term uptrend will likely be broken.

GBP/USD
There is no news feed for today.

The USD/JPY currency pair

Technical indicators of the currency pair:
  • Prev Open: 122.03
  • Prev Close: 123.90
  • % chg. over the last day: +1.53%

The monetary policy of the Bank of Japan is now “ultra-soft” because Japan wants to accelerate inflation, which has been one of the lowest in the world. Extremely low inflation is also bad for the economy and is even worse than high inflation in some cases. Given that the US Federal Reserve plans to aggressively raise interest rates at future meetings in 2022, this situation favors the growth of USD/JPY quotes in the mid-term.

Trading recommendations
  • Support levels: 122.74, 122.37, 120.89, 119.96, 119.52, 118.58, 118.06
  • Resistance levels: 125.22

The medium-term trend on the USD/JPY currency pair is bullish. The price breaks through the resistance levels without significant corrections. The lesser the pullbacks, the bigger and faster will be the fall on the corrective movement. The MACD indicator is in the positive zone. There are signs of overbought and divergence in several time frames. Under such market conditions, it is best to look for buy deals after a pullback, as the price has strongly deviated from the moving averages. A support level of 122.37 would be the best, but with additional confirmation. The resistance level of 125.22 can be considered for sell deals, but only after the sellers’ initiative.

Alternative scenario: if the price fixes below 120.89, the uptrend will likely be broken.

USD/JPY
News feed for 2022.03.29:
  • – Japan Unemployment Rate (m/m) at 02:30 (GMT+3).

The USD/CAD currency pair

Technical indicators of the currency pair:
  • Prev Open: 1.2482
  • Prev Close: 1.2517
  • % chg. over the last day: +0.28%

Currencies such as the Canadian dollar and the Australian dollar are commodity currencies highly dependent on oil prices. The rally in the oil market has stalled a bit. Oil corrected slightly yesterday. But the supply shortage is still here. Saudi Arabia cannot provide additional supplies due to the Yemeni Hussein attacks on the country’s oil infrastructure, and the nuclear deal with Iran is still far from over. So fundamentally, analysts predict the strengthening of the Canadian dollar. But since the dollar index is now also supported by the Fed, investors should not expect medium-term trends in the USD/CAD currency pair.

Trading recommendations
  • Support levels: 1.2495, 1.2453
  • Resistance levels: 1.2591, 1.2655, 1.2713, 1.2754, 1.2851

In terms of technical analysis, the USD/CAD currency pair trend is bearish. But because of yesterday’s decline in oil prices, there was a buyers’ reaction in the form of an impulse movement. The MACD indicator has become inactive. It is worth trading only with short targets because on the USD/CAD currency pair, fundamentally, there are no prerequisites for a medium-term trend, as the dollar index also has the support of the Fed in the medium term. Under such market conditions, it is better to look for buy trades on the lower time frames from the support level of 1.2495 or 1.2453, but it is better with additional confirmation. For sell deals, it is better to consider the resistance level of 1.2654.

Alternative scenario: if the price breaks through and consolidates above 1.2654, the downtrend will likely be broken.

USD/CAD
There is no news feed for today.

by JustForex


This article reflects a personal opinion and should not be interpreted as an investment advice, and/or offer, and/or a persistent request for carrying out financial transactions, and/or a guarantee, and/or a forecast of future events.


Negotiations between Ukraine and Russia are taking place in Istanbul today. Investors are optimistic, but analysts are not

by JustForex

Yesterday, all three US indices closed in the green zone. Dow Jones (US30) gained 0.27%, S&P 500 (US500) added 0.71%, the NASDAQ Technology Index (US100) jumped by 1.31% on Monday. US government bond yields remain close to a three-year high as investors gear up for the Federal Reserve’s rate hike campaign. This plays in favor of a stronger dollar index against other currencies.

US President Joe Biden submitted to Congress a budget proposal for the next fiscal year beginning October 1. Under Biden’s budget plan, corporate executives would be required to own the company’s shares they received for several years after purchasing it and would be prohibited from selling shares for several years after the share buyback. This would deprive corporations of using profits to buy back shares for the benefit of executives. The plan also includes $5.79 trillion in defense spending, aid to Ukraine, higher taxes on the richest Americans and companies, and a reduction in the national deficit.

Tesla will seek shareholder approval for a share split to pave the way for dividend payments to shareholders. Yesterday, the company’s shares increased by 8% on this news.

Bloomberg will disconnect Russian users from its terminal. Access to the terminals has already been blocked for several Russian banks that have fallen under Western sanctions.

Major European indices were mostly on the rise yesterday. German DAX (DE30) gained 0.79% yesterday, French CAC 40 (FR 40) added 0.54%, Spanish IBEX 35 (ES35) increased by 0.42%, British FTSE 100 (UK100) decreased by 0.14%. Investors continue to monitor the geopolitical situation in Ukraine. The next round of talks between the delegations of Ukraine and Russia is taking place in Istanbul today. This will be the fourth attempt to find a common language. The last three attempts were unsuccessful. But judging by the preliminary comments of the Ukrainian and Russian Foreign Ministries representatives, the negotiations will not be final, and investors should not expect a settlement agreement. But investors are optimistic because almost everyone involved, including Europe, is losing the war in Ukraine financially and economically. The US and China are in a better position, but even there, the negative economic impact of the war is present.

The EU expanded sanctions against Russia through the “50% rule”. Companies in which two or more sanctioned individuals jointly own the majority of shares are now blacklisted, even if none of them owns more than 50%. The sanctions “50% rule” has been in effect in the US since 2008. It is not yet applied in the EU.

The energy sector has had the most impact on the market as a whole, as concerns that the lockdown in China could dampen demand. On the contrary, peace talks between Ukraine and Russia have somewhat cooled fears of supply disruptions. This situation allowed oil prices to correct, but it should be noted that this is a temporary phenomenon as the market deficit persist.

Asian markets traded without a single trend yesterday. Japan’s Nikkei 225 (JP225) decreased by 0.73% yesterday, Hong Kong’s Hang Seng (HK50) gained 1.31%, and Australia’s S&P/ASX 200 (AU200) added 0.08%. Today, stock indices in the Asia-Pacific region (APR) are rising. Japan’s unemployment rate fell to 2.7% in February from 2.8% a month earlier. Investors are also watching the spread of the coronavirus in Shanghai, one of China’s largest industrial and commercial centers. A nine-day lockdown was imposed the day before, the largest in two years. The Shanghai lockdown will be divided into two phases. Shanghai’s Pudong economic region and surrounding areas will be closed from Monday to Friday in the first phase. The second phase will begin on Friday when the central part of Shanghai will be closed for lockdown. During these periods, residents will be required to stay at home, offices and businesses not considered essential will be closed, and public transport will be suspended. Also, during the lockdown, mass testing for COVID-19 is carried out in the city.

Main market quotes:

S&P 500 (F) (US500) 4,575.52 +32.46 (+0.71%)

Dow Jones (US30) 34,955.89 +94.65 (+0.27%)

DAX (DE40) 14,417.37 +111.61 (+0.78%)

FTSE 100 (UK100) 7,473.14 -10.21 (-0.14%)

USD Index 99.15 +0.36 (+0.37%)

Important events for today:
  • – Japan Unemployment Rate (m/m) at 02:30 (GMT+3);
  • – Australia Retail Sales (m/m) at 03:30 (GMT+3);
  • – US FOMC Member Williams Speech at 16:00 (GMT+3);
  • – US CB Consumer Confidence at 17:00 (GMT+3);
  • – US JOLTs Job Openings (m/m) at 17:00 (GMT+3).

by JustForex


This article reflects a personal opinion and should not be interpreted as an investment advice, and/or offer, and/or a persistent request for carrying out financial transactions, and/or a guarantee, and/or a forecast of future events.