Murrey Math Lines 05.04.2022 (AUDUSD, NZDUSD)

Article By RoboForex.com

AUDUSD, “Australian Dollar vs US Dollar”

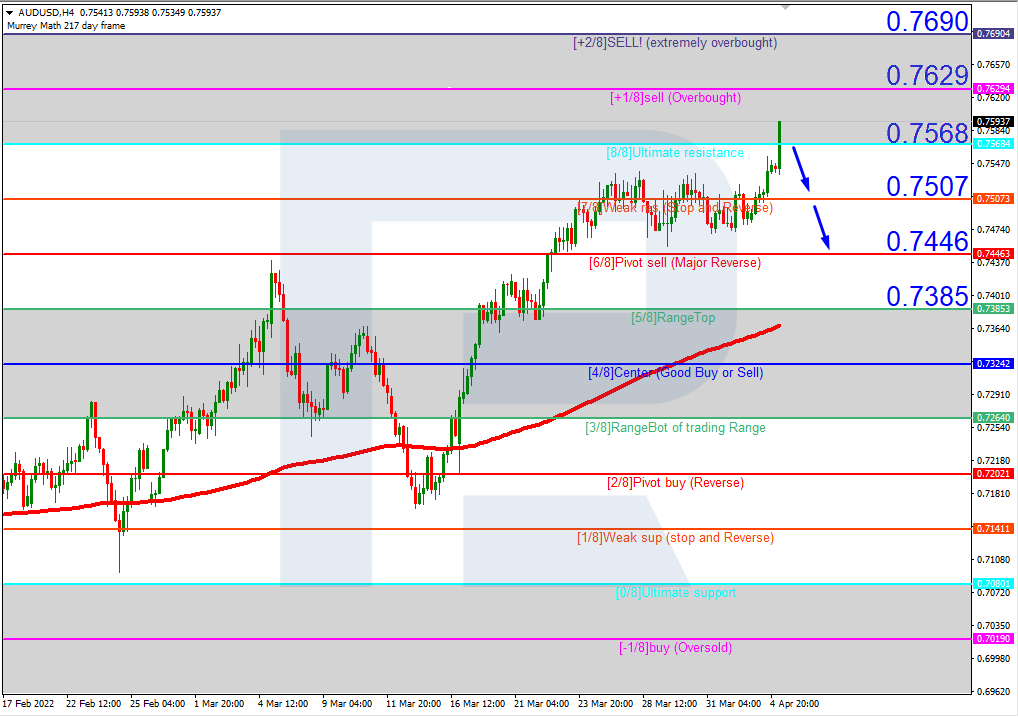
In the H4 chart, AUDUSD is trading inside the “overbought area”. In this case, the price is expected to break 8/8 and then continue falling to reach the support at 6/8. However, this scenario may no longer be valid if the price breaks the resistance at +1/8 to the upside. After that, the instrument may grow towards +2/8.

AUDUSDH4
Risk Warning: the result of previous trading operations do not guarantee the same results in the future

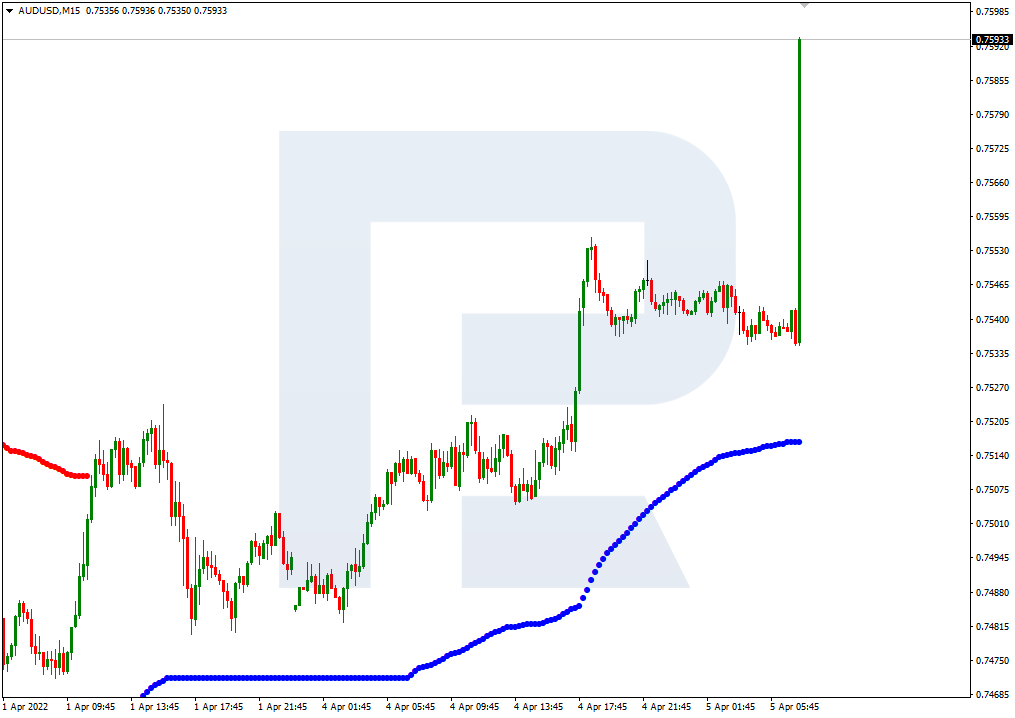
As we can see in the M15 chart, the downside line of the VoltyChannel indicator is pretty far away from the price, that’s why the pair may resume trading downwards only after rebounding from 8/8 in the H4 chart.

AUDUSD_M15
Risk Warning: the result of previous trading operations do not guarantee the same results in the future

NZDUSD, “New Zealand Dollar vs US Dollar”

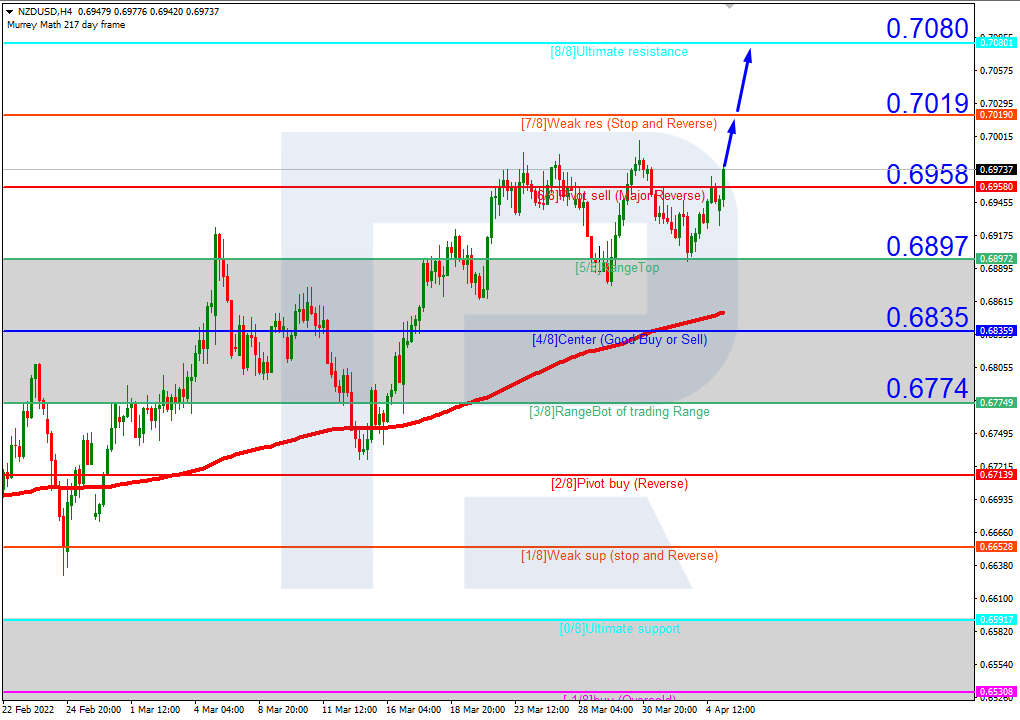
In the H4 chart, NZDUSD is trading above the 200-day Moving Average to indicate an ascending tendency. In this case, the price is expected to test 7/8, break it, and then continue growing to reach the resistance at 8/8. However, this scenario may no longer be valid if the price breaks 5/8 to the downside. After that, the instrument may reverse and fall towards the support at 4/8.

NZDUSD_H4
Risk Warning: the result of previous trading operations do not guarantee the same results in the future

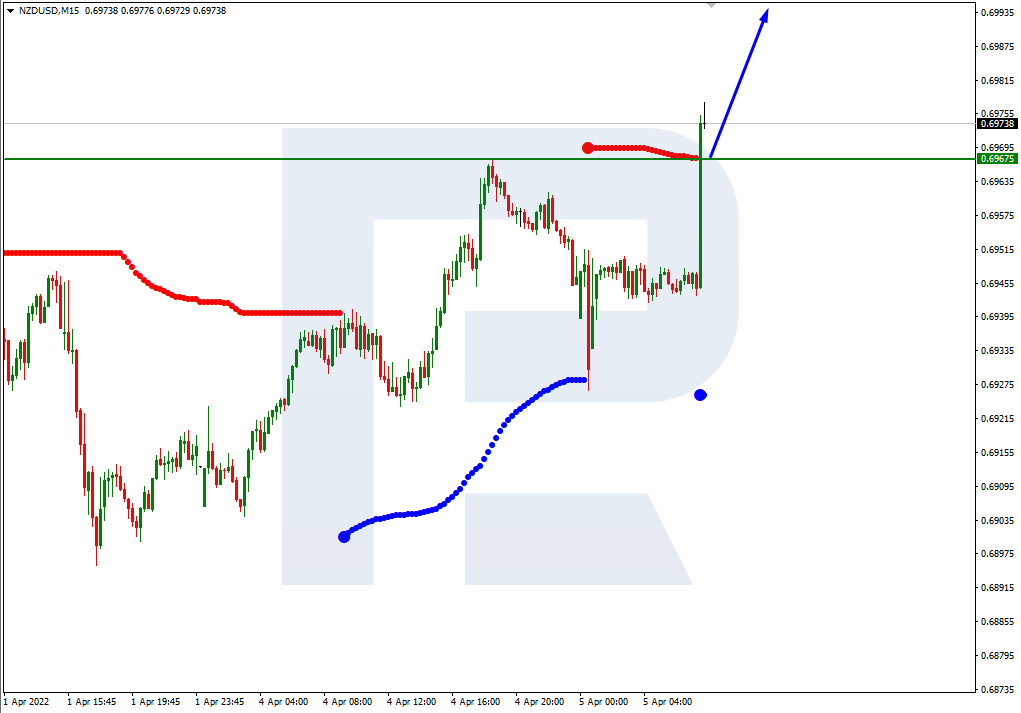
As we can see in the M15 chart, the pair has broken the upside line of the VoltyChannel indicator and, as a result, may continue its growth.

NZDUSD_M15

Article By RoboForex.com

Attention!
Forecasts presented in this section only reflect the author’s private opinion and should not be considered as guidance for trading. RoboForex LP bears no responsibility for trading results based on trading recommendations described in these analytical reviews.

AMZN Has The Cycle Impulse Wave Ended?

By Orbex

AMZN

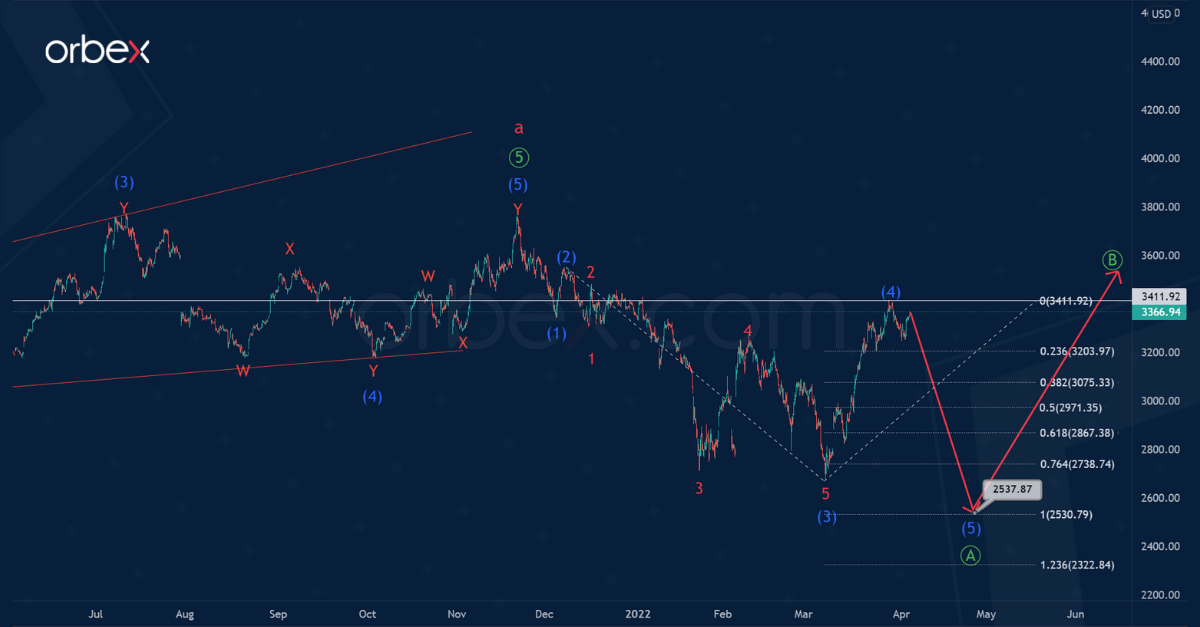
The current AMZN structure suggests the construction of a simple zigzag consisting of sub-waves a-b-c of the cycle degree.

The first major wave a, which includes primary sub-waves ①-②-③-④-⑤, has ended. In the last section of the chart, there is a decrease in the price, which could indicate the beginning of the construction of a bearish correction b. This correction could take the standard zigzag shape Ⓐ-Ⓑ-Ⓒ.

In the near future, there could be a decrease in the final intermediate wave (5), which can end the primary impulse wave Ⓐ near 2537.87. At that level, wave (5) will be equal to the previous impulse (3).

After the primary impulse wave Ⓐ ends, the stock price will begin to rise in correction Ⓑ, as shown on the chart.

AMZN

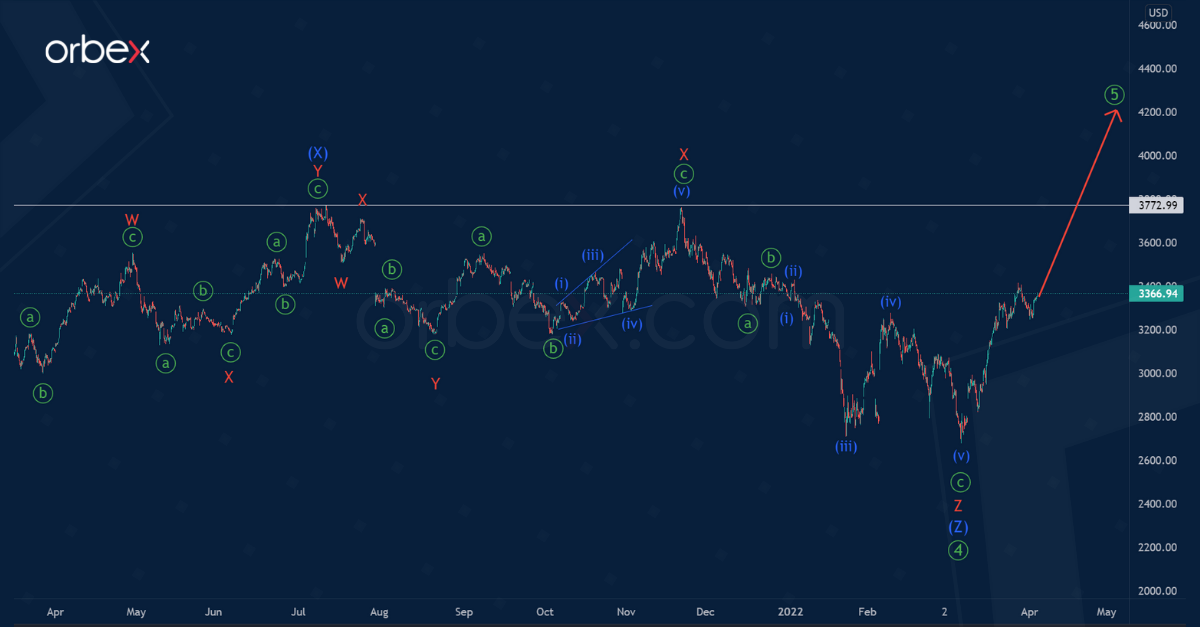
Alternatively, the cycle impulse wave a could still be in the formation stage. Perhaps the construction of the primary correction ④ has recently ended.

On the current chart, we see the final part of this correction. It took the form of an intermediate triple (W)-(X)-(Y)-(X)-(Z) zigzag.

The market will start moving upwards within the final wave ⑤ of the primary degree.

Most likely, prices will rise in price significantly above the high of 3772.99. This is marked by the minor intervening wave X.

Join our responsible trading community – Open your Orbex account now!


Orbex-LogoArticle by Orbex

Orbex is a fully licensed broker that was established in 2011. Founded with a mission to serve its traders responsibly and provides traders with access to the world’s largest and most liquid financial markets. www.orbex.com

The Analytical Overview of the Main Currency Pairs on 2022.04.05

by JustForex

The EUR/USD currency pair

Technical indicators of the currency pair:
  • Prev Open: 1.1037
  • Prev Close: 1.0972
  • % chg. over the last day: -0.59%

ECB spokesman said yesterday that the European bond-buying program (PEPP) could end in July. Inflation in Europe has accelerated, and the ECB does not want to delay the tightening of monetary policy. New sanctions against Russia will also put negative pressure on the European currency.

Trading recommendations
  • Support levels: 1.0963, 1.0917, 1.0887, 1.0823, 1.0633
  • Resistance levels: 1.1027, 1.1075, 1.1135, 1.1196, 1.1291

From the technical point of view, the trend on the EUR/USD currency pair in the hourly time frame has changed to bearish. Yesterday, the price confidently broke through the priority change level and consolidated lower. The MACD indicator is in the negative zone. The price has reached the support level, so it is too late for sell deals. Under such market conditions, traders can look for buy trades on the intraday timeframes from the support level of 1.0963, but only with short targets. Sell trades should be considered from the resistance level of 1.1027 or 1.1075, but only after the additional confirmation.

Alternative scenario: if the price breaks out through the 1.1135 resistance level and fixes above, the uptrend will likely resume.

EUR/USD
News feed for 2022.04.05:
  • – German Services (m/m) PMI at 10:55 (GMT+3);
  • – Eurozone Services (m/m) PMI at 11:00 (GMT+3);
  • – US ISM Services PMI (m/m) at 17:00 (GMT+3).
  • – US FOMC Member Brainard Speaks at 18:05 (GMT+3);
  • – US FOMC Member Williams Speaks at 21:00 (GMT+3).

The GBP/USD currency pair

Technical indicators of the currency pair:
  • Prev Open: 1.3093
  • Prev Close: 1.3114
  • % chg. over the last day: +0.16%

Bank of England Governor Andrew Bailey said yesterday that monetary policy can do little to offset external pressures on prices and therefore cannot significantly offset the decline in household income caused by high inflation. Bailey once again mentioned the term “uncertainty” that the Bank of England would soon face.

Trading recommendations
  • Support levels: 1.3074, 1.3015, 1.2989, 1.2863
  • Resistance levels: 1.3130, 1.3161, 1.3244, 1.3274

On the hourly time frame, the GBP/USD currency pair trend is bullish. The British pound looks more confident than the euro. At the moment, narrowing liquidity in the form of a triangle pattern is forming. The MACD indicator became inactive. Under such market conditions, buy trades should be considered from the support level of 1.3130, but after an actual level breakdown. Sell deals should also be considered from the resistance level of 1.3130 if the price shows a bearish initiative.

Alternative scenario: if the price breaks down through the 1.3074 support level and fixes below, the mid-term uptrend will likely be broken.

GBP/USD
News feed for 2022.04.05:
  • – UK Services PMI (m/m) at 11:30 (GMT+3).

The USD/JPY currency pair

Technical indicators of the currency pair:
  • Prev Open: 122.59
  • Prev Close: 122.73
  • % chg. over the last day: +0.11%

The fundamental picture for the Japanese yen remains unchanged. The monetary policy of the Bank of Japan is now “ultra-soft” and aims to decrease the national currency rate (USD/JPY growth). US bonds show strong growth in the debt market, while Japanese bond yields are at the same level. The mid-term outlook remains unchanged – analysts see a continuation of the uptrend, as the monetary policy of the US and Japanese central banks are now opposed.

Trading recommendations
  • Support levels: 121.83, 120.88, 119.52, 117.72
  • Resistance levels: 123.44, 125.22

The medium-term trend on the USD/JPY currency pair is bullish. The price corrected to the moving averages and formed a narrow price range. The MACD indicator has become inactive. Under such market conditions, it is best to look for buy deals, expecting the continuation of the uptrend. First of all, it is worth considering the support level of 121.83, but with additional confirmation. A resistance level of 123.44 may be considered for sell deals, but only after the sellers’ initiative.

Alternative scenario: If the price fixes below 119.52, the uptrend will likely be broken.

USD/JPY
There is no news feed for today.

The USD/CAD currency pair

Technical indicators of the currency pair:
  • Prev Open: 1.2516
  • Prev Close: 1.2486
  • % chg. over the last day: -0.24%

The Canadian dollar is a commodity currency and is highly dependent on the movement of oil prices and the dollar index. The Bank of Canada Business Outlook Survey showed a slowdown in business investment growth. Canadian companies expect strong wage growth and rising product prices due to strong demand, inflation, and high commodity prices. Analysts believe that the Bank of Canada will likely raise interest rates on April 13.

Trading recommendations
  • Support levels: 1.2453
  • Resistance levels: 1.2520, 1.2563, 1.2655, 1.2713, 1.2754, 1.2851

In terms of technical analysis, the USD/CAD currency pair trend is bearish, but the price is getting a flat structure. The MACD indicator has become inactive. Trade only with short targets, since on the USD/CAD currency pair fundamentally, there are no prerequisites for the medium-term trend, as the dollar index in the medium term also has the support of the Fed. Under such market conditions, it is better to look for buy trades on the lower timeframes from the support level of 1.2453, but it is better with additional confirmation. For sell deals, it is better to consider the resistance level of 1.2520.

Alternative scenario: if the price breaks through and consolidates above 1.2654, the downtrend will likely be broken.

USD/CAD
There is no news feed for today.

by JustForex


This article reflects a personal opinion and should not be interpreted as an investment advice, and/or offer, and/or a persistent request for carrying out financial transactions, and/or a guarantee, and/or a forecast of future events.

The US and Europe are preparing new sanctions against Russia over war crimes in Ukraine

by JustForex

Investors remain concerned about the war in Ukraine, which has sent commodity prices skyrocketing, worsening the outlook for already high inflation. The 10-year US Treasury bond yields rose on Monday, while the 2-year/10-year yield curve remained inverted. The curve inversion is seen as a harbinger of a recession in the next year or two.

But there is another opinion. An inverted Treasury yield curve tells investors more about inflation than recession prospects, says an experienced Wall Street strategist. “The 2/10 inversion of the nominal Treasury bond curve does not mean slower growth, but rather lower inflation in 2023 and beyond,” wrote Barry Knapp, managing partner of Ironsides Economics.

This Summer, the US economy will fall into recession as inflation eats into consumer spending, warns former Fed official Lawrence Lindsey. “Inflation is undermining the purchasing power of consumers, and they will have to cut spending,” he said.

The Dow Jones Index (US30) increased by 0.30% yesterday, the S&P 500 Index (US500) gained 0.81%, and the NASDAQ Technology Index (US100) jumped by 1.90%.

Twitter shares rose 17% yesterday as it became known that Elon Musk bought a 9.2% stake. Tesla shares rose yesterday after the company reported record first-quarter deliveries of electric vehicles on Saturday.

European stock markets were mostly up yesterday. Germany’s DAX (DE30) gained 0.50%, France’s CAC 40 (FR40) jumped by 0.70%, Spain’s IBEX 35 (ES35) added 0.20%, and the British FTSE 100 (UK100) increased by 0.28%.

The US is actively working with Europe to tighten sanctions against Russia. The fifth package of EU sanctions against Russia is likely to affect aviation leasing, imports and exports of jet fuel, metal products, luxury goods, and, possibly, Russian President Vladimir Putin personally. EU countries are still arguing about including an embargo on energy imports from Russia in the sanctions. French President Emanuel Macron called for tough new anti-Russian sanctions: “We need new sanctions against Russia. New sanctions should apply to coal and gasoline.”

Poland, Latvia, Lithuania, and Estonia began the process of total isolation from Russia and Belarus, thereby closing their land routes for the delivery of goods to these countries.

Gold is falling as US government bonds are rising. Analysts expect gold and silver prices to fall in the medium term as the US Federal Reserve tightens monetary policy. The recent rise in gold is purely speculative, as a temporary safe haven for investors from inflation, as well as from the war in Ukraine.

Oil is rising again amid new sanctions against Russia. World oil futures increased more than 3% on Monday. “Geopolitical tensions are likely to keep oil prices higher in the coming days, despite efforts of the US and its allies,” said Tina Teng, market analyst at CMC Markets APAC & Canada, referring to the coordinated output of oil by consuming countries.

Asian markets traded positive yesterday. Japan’s Nikkei 225 (JP225) gained 0.25% yesterday, Hong Kong’s Hang Seng (HK50) jumped by 2.10%, and Australia’s S&P/ASX 200 (AU200) ended the day with +0.27%. Australia’s central bank opened the door for its first interest rate hike on Tuesday. The Reserve Bank of Australia (RBA) kept the interest rate at 0.1%. However, inflation has risen significantly and is likely to continue to rise, while unemployment fell faster than expected to 4.0%. The RBA wants to avoid another recession or let high and potentially damaging inflation persist until 2023. Markets took the change as a move toward a possible tightening and lifted the Australian dollar 0.7% to a nine-month high. Earlier, RBA chief Lowe said that the first hike would come later this year, while markets have long been betting on an earlier hike given the global rise in inflation.

The World Bank lowered its 2022 GDP forecast for East Asia due to the war in Ukraine. China’s economy is expected to grow 5.0% this year, compared to the previous estimate of 5.4%. But growth could slow to 4.0% if conditions worsen and government policies ease.

Main market quotes:

S&P 500 (F) (US500) 4,582.64 +36.78 (+0.81%)

Dow Jones (US30) 34,921.88 +103.61 (+0.30%)

DAX (DE40) 14,518.16 +71.68 (+0.50%)

FTSE 100 (UK100) 7,558.92 +21.02 (+0.28%)

USD Index 98.98 +0.35 (+0.36%)

Important events for today:
  • – Australia RBA Interest Rate Decision at 07:30 (GMT+3);
  • – Australia RBA Rate Statement at 07:30 (GMT+3);
  • – German Services (m/m) PMI at 10:55 (GMT+3);
  • – Eurozone Services (m/m) PMI at 11:00 (GMT+3);
  • – UK Services PMI (m/m) at 11:30 (GMT+3);
  • – US ISM Services PMI (m/m) at 17:00 (GMT+3);
  • – US FOMC Member Brainard Speaks at 18:05 (GMT+3);
  • – US FOMC Member Williams Speaks at 21:00 (GMT+3).

by JustForex


This article reflects a personal opinion and should not be interpreted as an investment advice, and/or offer, and/or a persistent request for carrying out financial transactions, and/or a guarantee, and/or a forecast of future events.

Caution Prevails As Geopolitical Risks Continue

By Lukman Otunuga Senior Research Analyst, ForexTime 

A sense of caution has taken hold of financial markets as investors evaluate the prospects of more sanctions on Russia for the alleged destruction in Bucha, a town on the outskirts of Ukraine’s capital.

Asian shares wobbled on Tuesday morning due to the rising geopolitical risks, while oil benchmarks jumped over 1% on supply-side fears. European and U.S futures fluctuated, pointing to a mixed open despite Wall Street closing higher overnight. In the currency space, the dollar gained for the third straight session yesterday as investors sprinted to safety. But interestingly, trading activity in gold was like watching paint dry.

With geopolitics at the forefront of investors’ minds, the next few days could be rough and rocky for global markets. The devastation in Bucha has prompted not only the European Union but also world leaders to discuss new sanctions on Russia. As ongoing geopolitical risks fuel uncertainty and trigger volatility, this could sap risk sentiment, extending further support to safe haven assets.

The Reserve Bank of Australia (RBA) left interest rates unchanged at 0.1% at its overnight meeting. However, the central bank signaled a growing willingness to raise interest rates soon, by dropping the phrase “the board is prepared to be patient”. The RBA’s hawkish tilt sent the aussie to its highest level in nine months, above 0.76.

FOMC minutes and Fed speeches in focus

This could be a big week for the dollar due to the FOMC meeting minutes as well as scheduled speeches from Fed officials.

The minutes of the FOMC March policy meeting are expected to offer investors fresh insight into how officials view monetary policy, after raising interest rates for the first time since 2018. Market players will also comb through the minutes for details on the plans for balance sheet reduction which could start as soon as May.

Should the minutes strike a hawkish tone with policymakers discussing the possibility of a 50-basis point rate hike in May, this could boost the dollar. Expect the greenback to be influenced by numerous policymakers scheduled to speak this week as well, including Fed Governor Lael Brainard and Philadelphia Fed President Patrick Harker among others.

Commodity spotlight – Oil

Oil benchmarks appreciated over 1% on Tuesday morning as bulls drew strength from supply-side fears due to the Russia-Ukraine conflict. With the European Union working on new sanctions that may target Russia’s oil industry, crude prices could edge up in the near term.

However, last week’s announcement by President Biden to release a mammoth 180 million from the country’s strategic petroleum reserves (SPR) between May and October is taming oil bulls. The idea of the SPR plugging the gaping hole in the absence of Russian oil could cap upside gains in the global commodity. In addition, China’s most populous city Shanghai is under lockdown and given how China is the world’s largest crude consumer, this development may further weigh on prices.

Brent is trading around $109.15 as of writing. A move to the upside could open a path back towards $114.50. If prices slip below $108, then a decline towards $104 could be on the cards.

Disclaimer: The content in this article comprises personal opinions and should not be construed as containing personal and/or other investment advice and/or an offer of and/or solicitation for any transactions in financial instruments and/or a guarantee and/or prediction of future performance. ForexTime (FXTM), its affiliates, agents, directors, officers or employees do not guarantee the accuracy, validity, timeliness or completeness, of any information or data made available and assume no liability as to any loss arising from any investment based on the same.


Forex-Time-LogoArticle by ForexTime

ForexTime Ltd (FXTM) is an award winning international online forex broker regulated by CySEC 185/12 www.forextime.com

Intraday Market Analysis – USD Inches Up

By Orbex

USDJPY consolidates gains

USDJPY

The US dollar gains on the prospect of more sanctions on Russia. On the daily chart, the RSI’s overbought condition led to profit-takings as the bulls became reluctant to outbid each other.

Nonetheless, the direction remains upward, and a pause is necessary for the market to take a breather. The current pullback has found support over 121.30.

A bounce above 123.20 may signal a bullish continuation and extend the price back to 125.00. On the downside, a breakout could cause a correction to 119.40 near the 30-day moving average.

EURGBP struggles for support

EURGBP

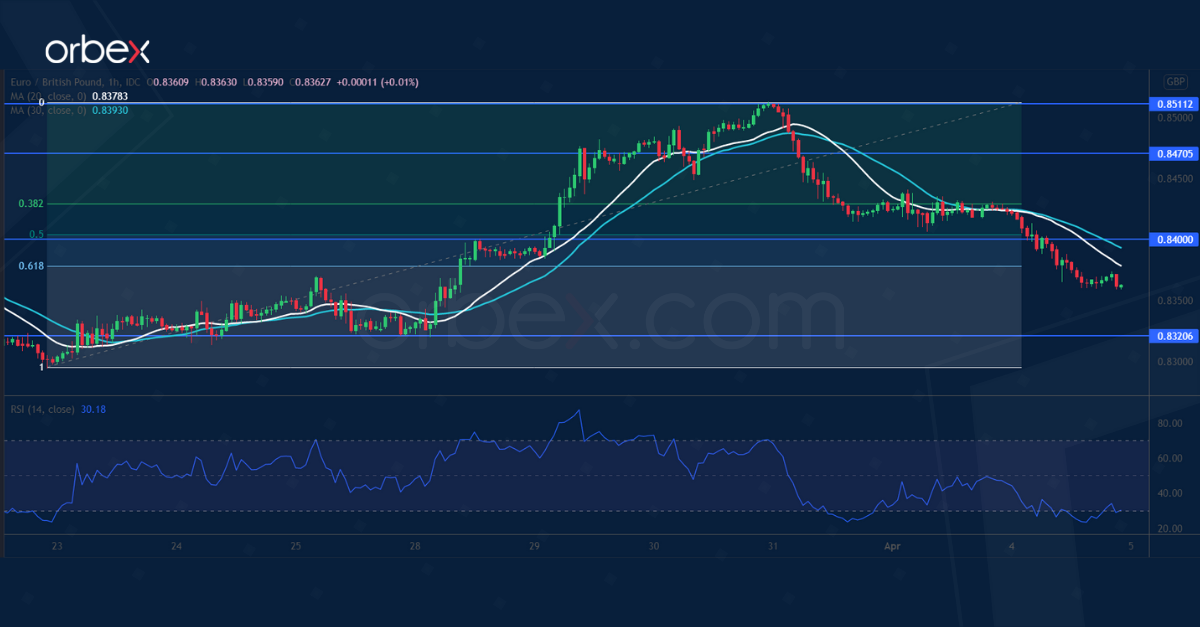
The euro fell as worries over Europe’s energy supply grew. The current pullback could be an opportunity for the bulls to stake in but they will need to push past 0.8400 to regain control.

The 61.8% (0.8380) Fibonacci retracement level has failed to foster buyers’ interest. The RSI’s double dip into the oversold area may attract some bids.

The demand zone between the daily support (0.8300) and 0.8320 is a critical floor to keep the rebound valid. That said, its breach could trigger a sell-off towards 0.8200.

GER 40 takes a breather

DAX

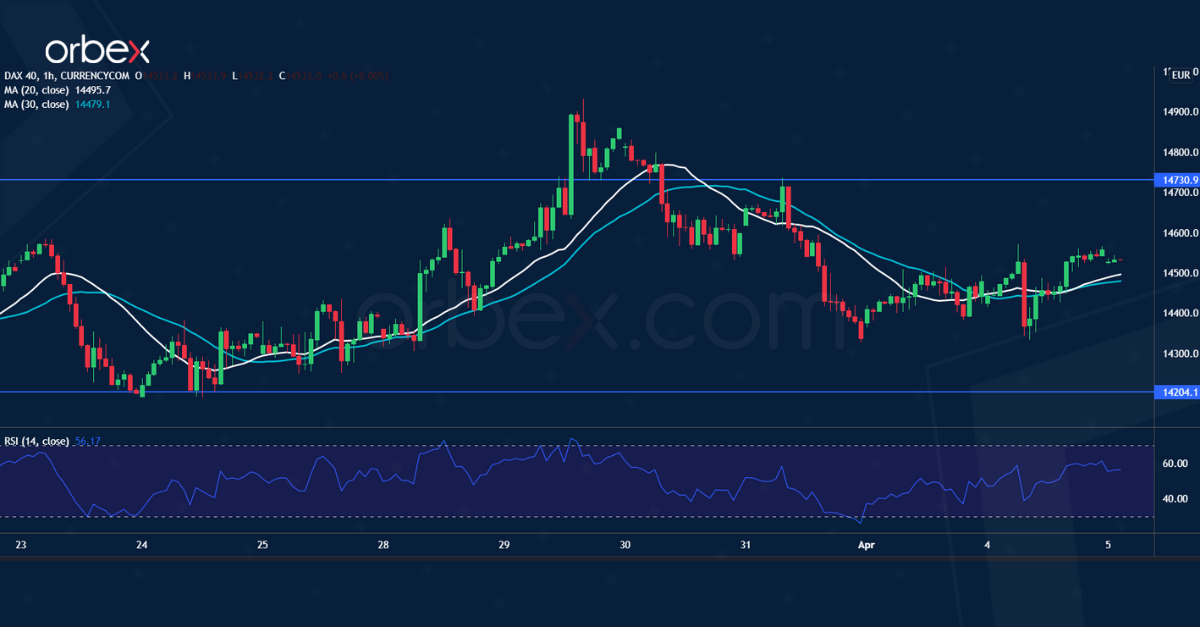
The Dax 40 goes sideways as the EU considers a new set of sanctions. A bullish MA cross on the daily chart suggests an acceleration in the rebound as a sign of improved sentiment.

The index is hovering above the lower end (14200) of the previous consolidation. This level coincides with the 20 and 30-day moving averages, making it an area of interest.

A close above 14730 could extend the rally to the origin of the February liquidation at 15200. This is an important resistance before the uptrend could resume in the medium-term.


Orbex-LogoArticle by Orbex

Orbex is a fully licensed broker that was established in 2011. Founded with a mission to serve its traders responsibly and provides traders with access to the world’s largest and most liquid financial markets. www.orbex.com

Trade Of The Week: Gold Hunts For Fresh Fundamental Spark

By Lukman Otunuga Senior Research Analyst, ForexTime

Monday’s trading activity in gold was like watching paint dry…

The precious metal kicked off the new week in a muted fashion as investors digested last Friday’s US jobs report and ongoing geopolitical tensions.

So why is gold the TOTW?

  1. This could be a volatile week for the precious metal thanks to heightened geopolitical risks, the FOMC meeting minutes, and speeches by key Fed officials.
  2. Price action shows a fierce tug of war between bulls and bears with a potential breakout/down on the horizon.

Gold could be waiting for a fresh fundamental spark to tilt the balance of power in favour of bulls or bears.

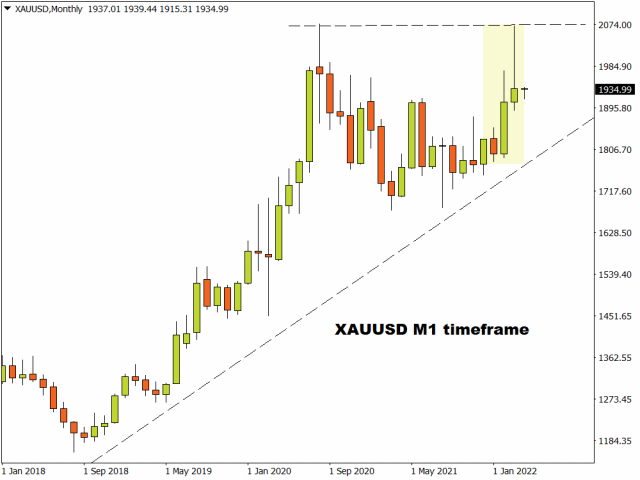
Before we take a deep dive into what to expect from the precious metal in the week ahead, it is worth keeping in mind that gold glittered in Q1 by gaining almost 6%. This was its best quarter since mid-2020 as fears over the Ukraine-Russia conflict, soaring inflation, and global growth concerns boosted bullion’s safe-haven appeal.

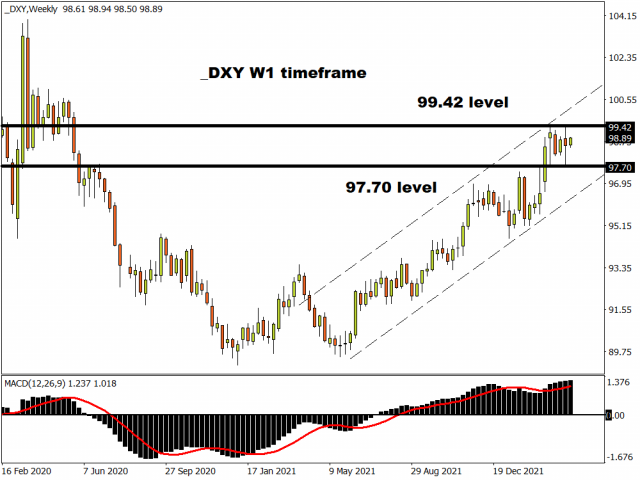
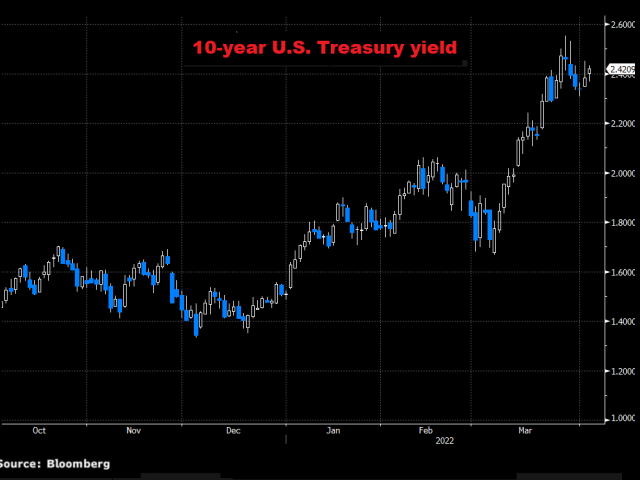
As we enter the second quarter of 2022, the path ahead could be rocky for gold bugs. Last Friday’s strong jobs report has reinforced market bets over the Fed adopting an aggressive policy stance against high inflation. Such expectations are likely to boost the dollar and Treasury yields at the expense of zero-yielding gold.

Gold offers no yield, making it less attractive for investors to own in an environment of rising Treasury yields.

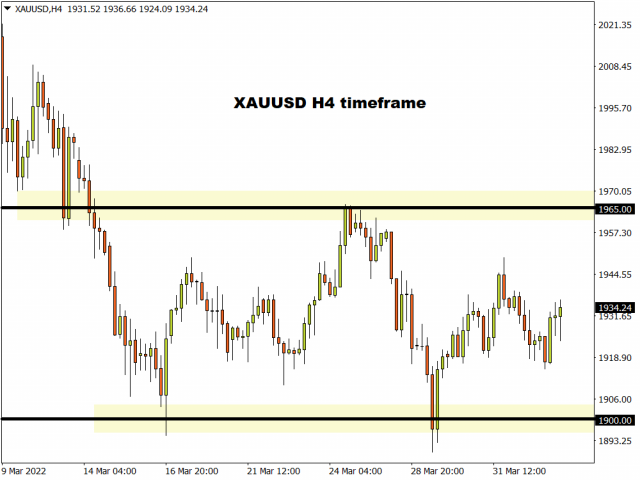
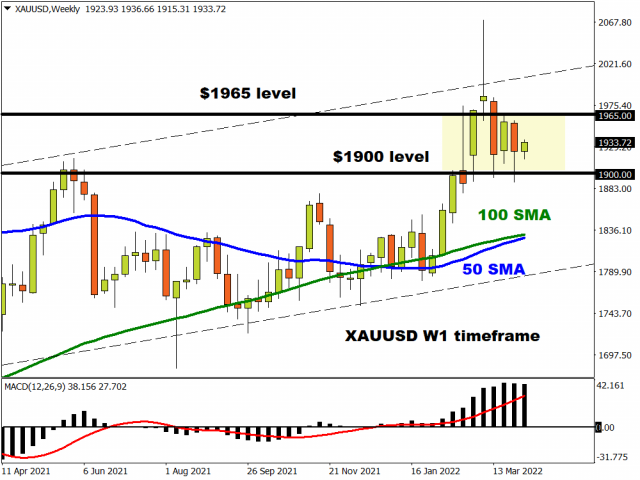
Taking a quick look at the technical picture, the trend swings in favour of bulls on the weekly charts with weekly support found around $1900 and resistance at $1965. A move above $1965 could re-open the doors back towards the psychological $2000 level and higher.

Fed minutes and speeches in focus

Investors across the globe will direct their attention toward the latest FOMC meeting minutes as well as scheduled speeches from key Fed officials.

The meeting minutes are expected to offer market players fresh insight into how officials view the monetary policy outlook after raising interest rates for the first time since 2018. Investors will also scrutinize the minutes for details on the central bank’s balance sheet reduction which is expected to kick off in May. Should the minutes strike a firmly hawkish tone with policymakers discussing the possibility of a 50-basis point rate hike next month, this could boost the dollar and Treasury yields – ultimately weighing heavily on gold.

There will also be a cavalry of US policymakers, including Fed Governor Lael Brainard scheduled to speak this week. Given how these speeches may influence rate hike expectations, gold could be injected with a fresh dose of volatility over the next few days.

Keep an eye on geopolitical risks

Over the weekend, things got messy on the geopolitical front with Ukraine-Russia tensions escalating following the destruction in Bucha, a town on the outskirts of Ukraine’s capital.

This negative development has dampened hopes of peace talks and prompted not only the European Union but world leaders to discuss new sanctions on Russia.  The heightened levels of uncertainty and potential volatility caused by geopolitical risks could drain sentiment, extending some support to safe-haven gold.

Gold ETFs favour bulls

According to an automated report from Bloomberg, gold ETFs added 176,458 troy ounces of gold to their holdings last Friday – bringing this year’s net purchase to 8.06 million ounces. Since the start of 2022, total gold held by ETF’s are up over 8% – marking the highest level since February 2021.

The inflows could be the result of geopolitical tensions in Eastern Europe, soaring inflation, and concerns over global economic growth. An ETF (Exchange Traded Funds) is an investment instrument that allows retail traders to gain exposure to an existing market or groups of markets. A gold ETF provides investors exposure to gold without owning it physically. Inflows from ETFs are seen as bullish for the underlying asset.

Support, Resistance, Support….

The subtitle says it all.

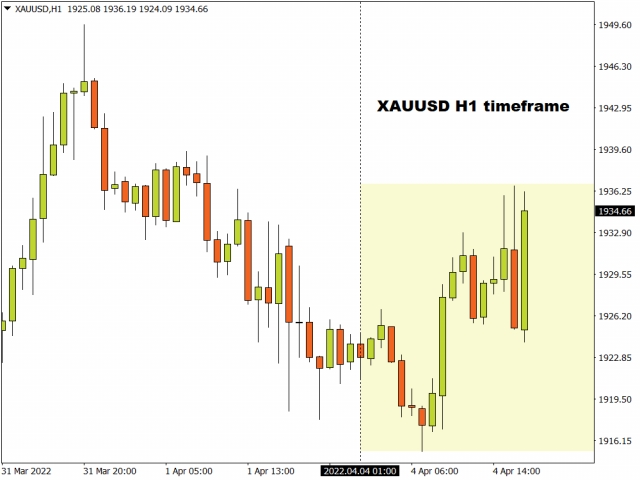
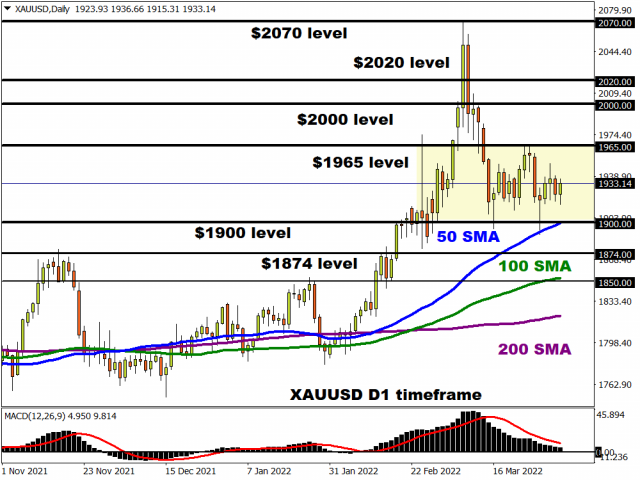
Gold remains trapped within a $65 range on the daily charts with support at $1900 and resistance at $1965. Prices are trading above the 50, 100, and 200 Simple Moving Average while the MACD trades to the upside. A strong daily close above $1965 could trigger an incline towards $2000, $2020, and $2070.

Should $1900 prove to be unreliable support, gold could decline back towards $1874 and $1850, respectively.

Disclaimer: The content in this article comprises personal opinions and should not be construed as containing personal and/or other investment advice and/or an offer of and/or solicitation for any transactions in financial instruments and/or a guarantee and/or prediction of future performance. ForexTime (FXTM), its affiliates, agents, directors, officers or employees do not guarantee the accuracy, validity, timeliness or completeness, of any information or data made available and assume no liability as to any loss arising from any investment based on the same.


Forex-Time-LogoArticle by ForexTime

ForexTime Ltd (FXTM) is an award winning international online forex broker regulated by CySEC 185/12 www.forextime.com

Crude Oil Already Considered Negative News

By RoboForex Analytical Department

On Monday 4 April, the Brent price is “in the black”; the asset is trading at $105.40.

This sharp decline in oil prices was caused by US President Joe Biden’s decision to “unleash” the country’s reserve oil tanks and sell 1 million barrels every day. In total, 180 million barrels are expected to be sold from May to October. Moreover, the International Energy Agency agreed to unleash its oil reserves but no particular volumes have been announced yet.

This measure is expected to be a temporary solution and won’t help to solve the supply shortage issue.

Geopolitics is slowly becoming normal. The conflict between Saudi Arabia and Houthis from Yemen is dying down as the parties agreed to cease fire. It’s good news for oil deliveries.

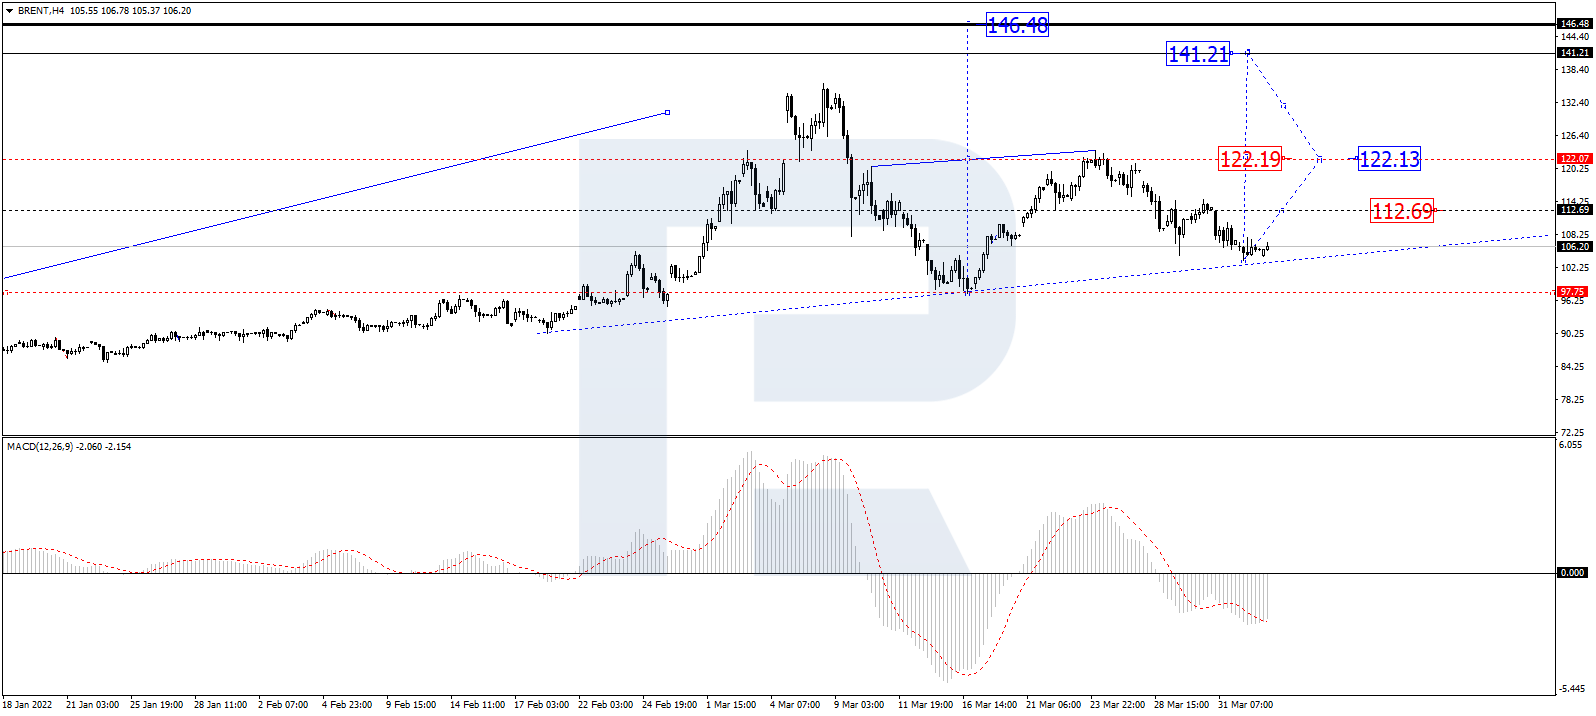
In the H4 chart, having completed the correctional structure at 113.66, Brent is consolidating around his level. If later the asset breaks this range to the upside, the market may resume growing to break 112.69 and then continue trading upwards with the first target at 122.20. After that, the instrument may correct to return to 112.70 and then resume trading upwards with the short-term target at 141.20. From the technical point of view, this scenario is confirmed by MACD Oscillator: its signal line is moving below 0 outside the histogram area, which means that it may grow to break the above-mentioned level and then continue moving towards new highs.

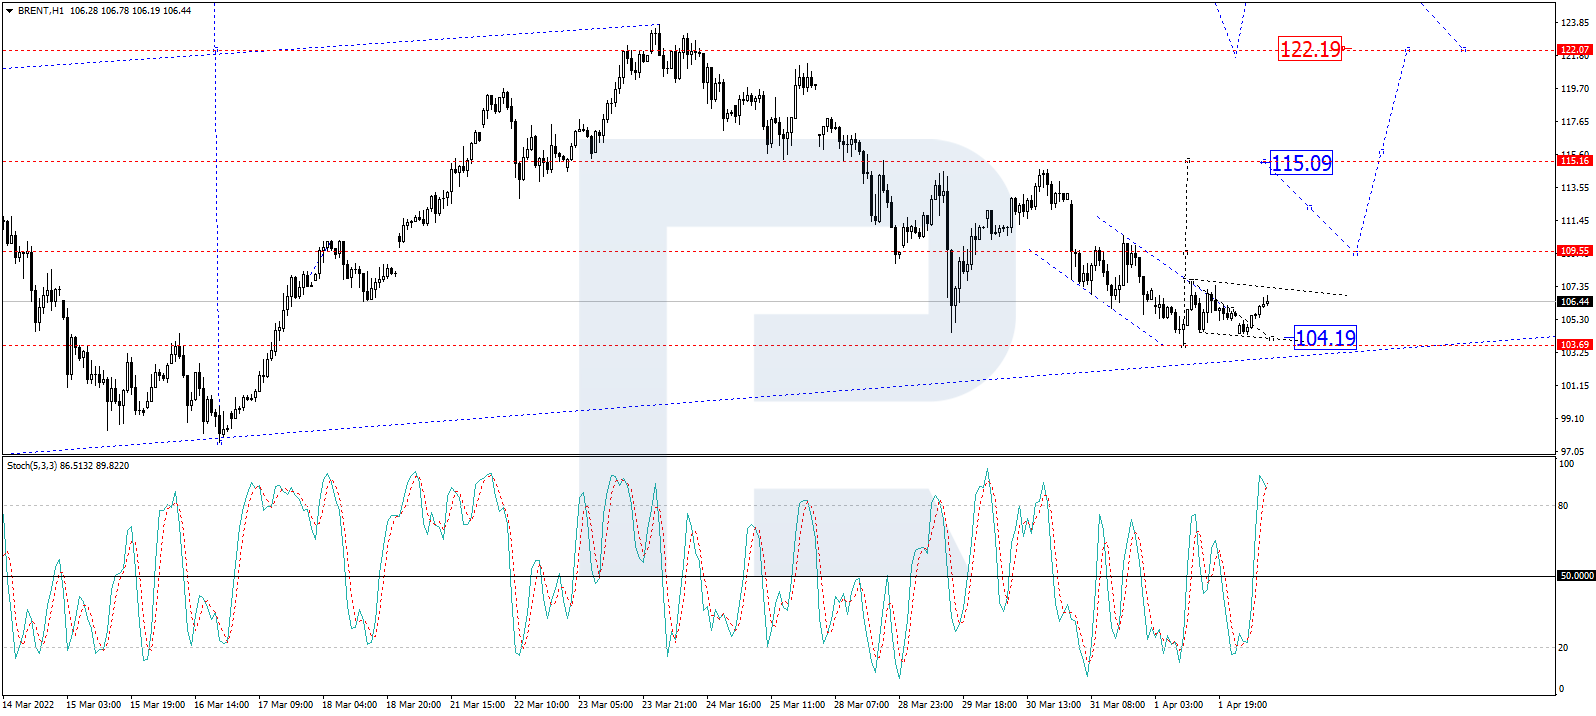
As we can see in the H1 chart, after finishing the correction and forming the first ascending impulse at 107.69, Brent is correcting downwards and may soon reach 104.20. Later, the market may start another growth to break 109.55 and then continue trading within the uptrend with the first target at 115.10. From the technical point of view, this idea is confirmed by the Stochastic Oscillator: its signal line is moving above 80 and may soon resume falling towards 50. After that, the line is expected to rebound from 50 to the upside and grow to return to 80.

Disclaimer

Any forecasts contained herein are based on the author’s particular opinion. This analysis may not be treated as trading advice. RoboForex bears no responsibility for trading results based on trading recommendations and reviews contained herein.

What To Expect Out Of RBA Interest Rate Decision

By Orbex

The AUDUSD has remained relatively flat the last couple of weeks, despite ongoing appreciation in the commodity prices. The Aussie hasn’t been able to capitalize on the general inflation environment despite being a commodity currency. In part, this is due to the outlook for the RBA.

So far, the RBA has loathed raising rates. Part of that can be because of the delayed economic impact of the pandemic, as case numbers shot up at the start of the year.

While other central banks were going to normalize rates, the RBA was faced with the effects of lockdowns. Now, economic measures are lifting, but case numbers are starting to climb again.

Lack of growth support

Typically, the current scenario would encourage carry trading, with the BOJ keeping ultra-low rates. That said, commodity currencies would have higher interest rates. Under such circumstances, the AUD would get a boost. And, in fact, the currency did start inching higher at the start of the year.

If the RBA keeps rates at the record low level of 0.1%, however, there is likely to be little interest in carry trade, which could keep the pair from moving higher.

Nonetheless, things could change in the future.

Inflation has been moving significantly above target. The RBA acknowledges that unemployment has hit a structural level, increasing the risk of a wage-price spiral that could require aggressive intervention in terms of monetary policy.

So, the scene is set for a rate hike, but the consensus is that the RBA won’t pull the trigger at the next meeting.

Why no rate hike?

The latest survey of Australian economists shows that 93% expect the RBA to keep the rate on hold. The very small minority of dissenters expect a “half” rate hike, bringing rates to 0.25%.

Unsurprisingly, the market seems to be siding with the majority and it’s not pricing in a rate hike. This means that the event could be relatively calm, with the focus on what’s coming up next. In turn, this begs the question of why the RBA is unlikely to take action at this meeting?

The answer is in two parts. Firstly, Australia calculates inflation on a quarterly basis, and the RBA is working on inflation from last year. We won’t get the latest inflation data until later in the month. Barring some kind of emergency, the RBA is unlikely to make a move without having the latest data on hand.

When could the hike come?

Secondly, there’s the upcoming general election on May 21st.

Generally, the RBA tries to avoid making significant moves (such as starting a raising cycle) during the campaign period. Unless, of course, there is some kind of emergency. The next meeting is on May 3rd, meaning that if the RBA chooses to wait until after the election, we might not see a rate hike until the June 7th meeting.

At the last meeting, the MPC members agreed that it was too early to be looking at raising rates. They cited core inflation not being “stable” above target. The focus could be on the accompanying statement from the RBA, to see if there is any comment on how “stable” the inflation is. If inflation is “concerning”, it could signal a rate hike in the next couple of meetings.

Test your strategy on how the AUD will fare with Orbex – Open Your Account Now.


Orbex-LogoArticle by Orbex

Orbex is a fully licensed broker that was established in 2011. Founded with a mission to serve its traders responsibly and provides traders with access to the world’s largest and most liquid financial markets. www.orbex.com

Forex Technical Analysis & Forecast for April 2022

Article By RoboForex.com

EURUSD, “Euro vs US Dollar”

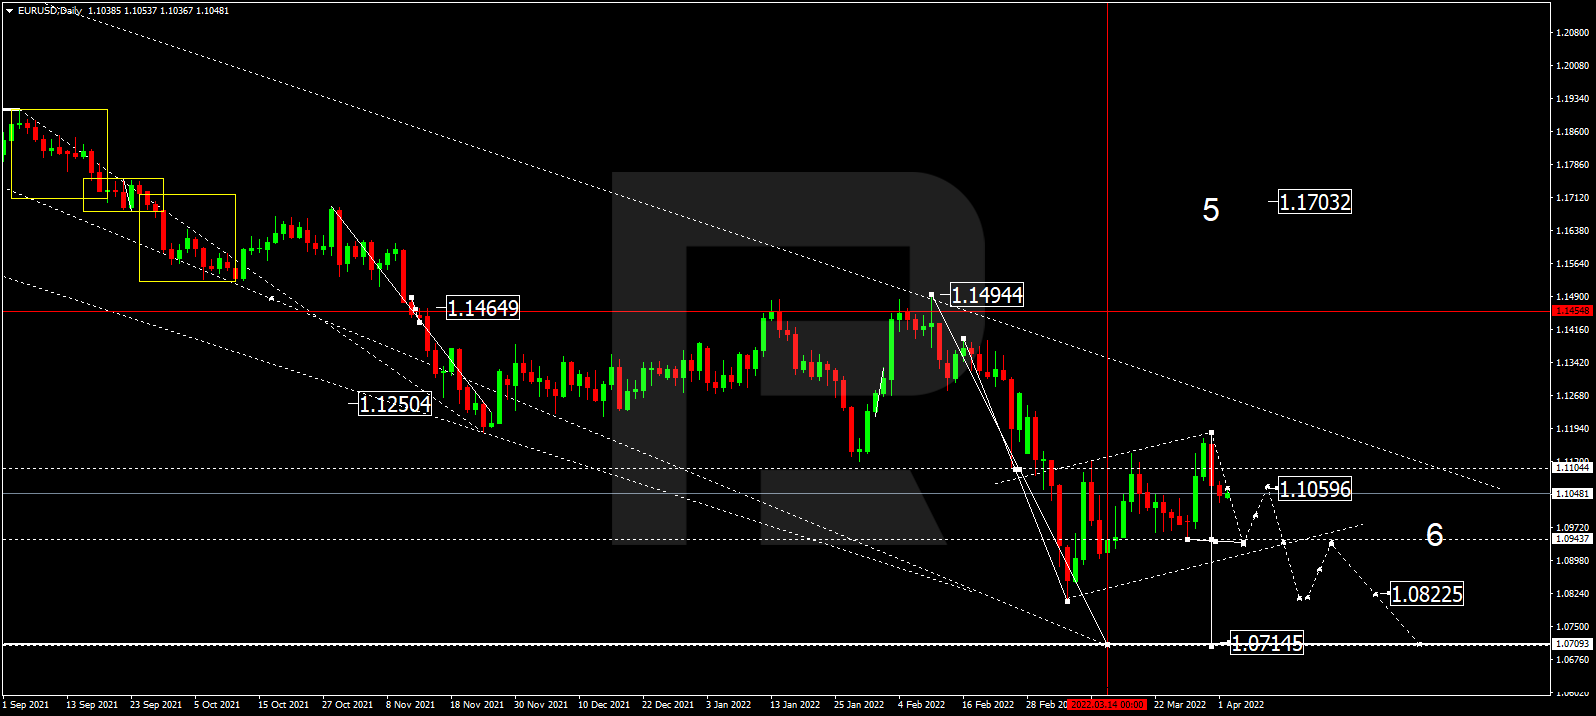
As we can see in the daily chart, having completed the correction at 1.1170, EURUSD is forming another descending wave with the first target at 1.0944 and may later correct towards 1.1060, thus forming a wide consolidation range around 1.0944. If the price breaks this range to the downside, the market may resume falling towards 1.0822 or even extend this wave down to 1.0715; if to the upside – start another growth to reach 1.1200 and then form one more descending structure to return to 1.0944.

EURUSD
Risk Warning: the result of previous trading operations do not guarantee the same results in the future

GBPUSD, “Great Britain Pound vs US Dollar”

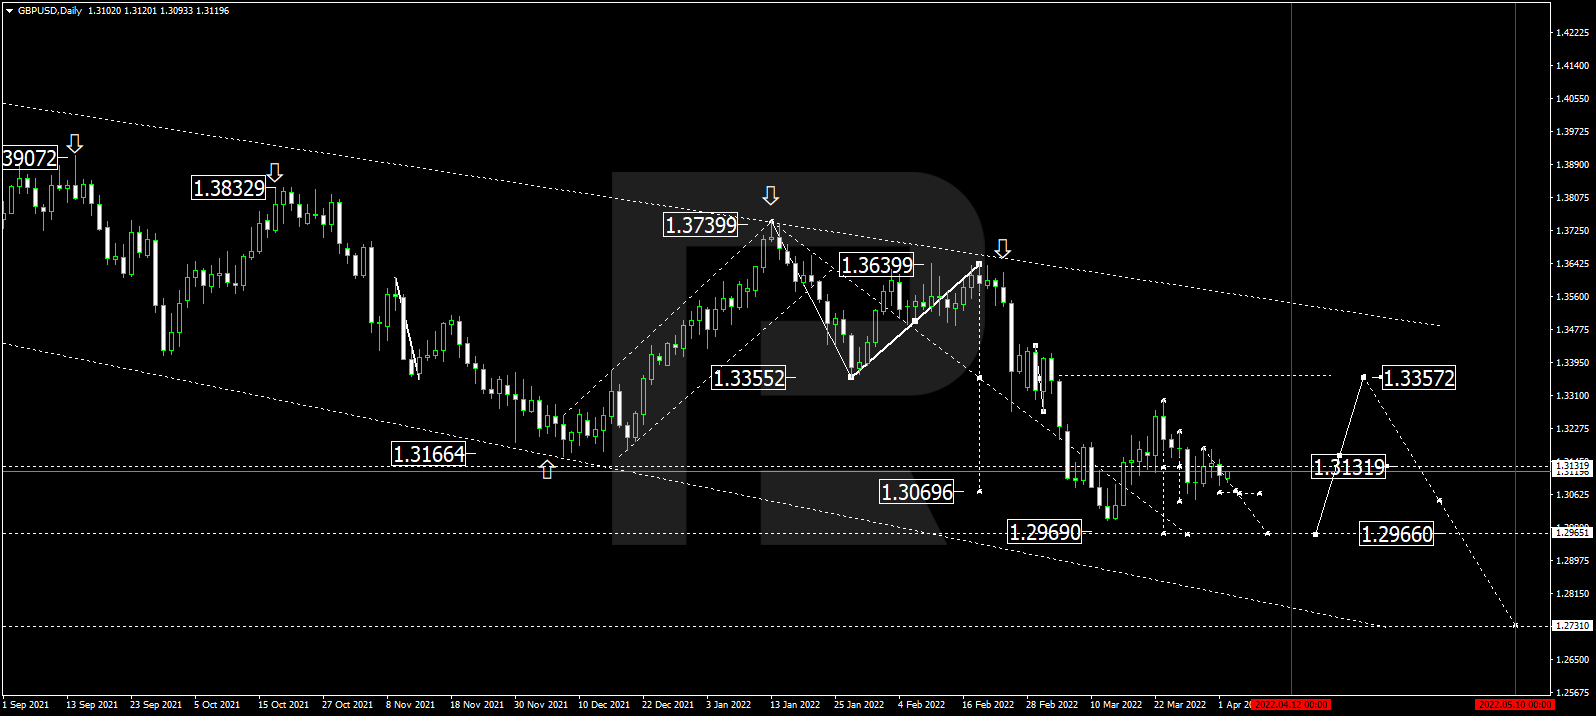
In the daily chart, after finishing the correction at 1.3300, GBPUSD is trading downwards with the target at 1.2966; it has already broken 1.3131. At the moment, the asset is consolidating below the latter level. After reaching the above-mentioned target, the instrument may start another growth towards 1.3355.

GBPUSD
Risk Warning: the result of previous trading operations do not guarantee the same results in the future

USDJPY, “US Dollar vs Japanese Yen”

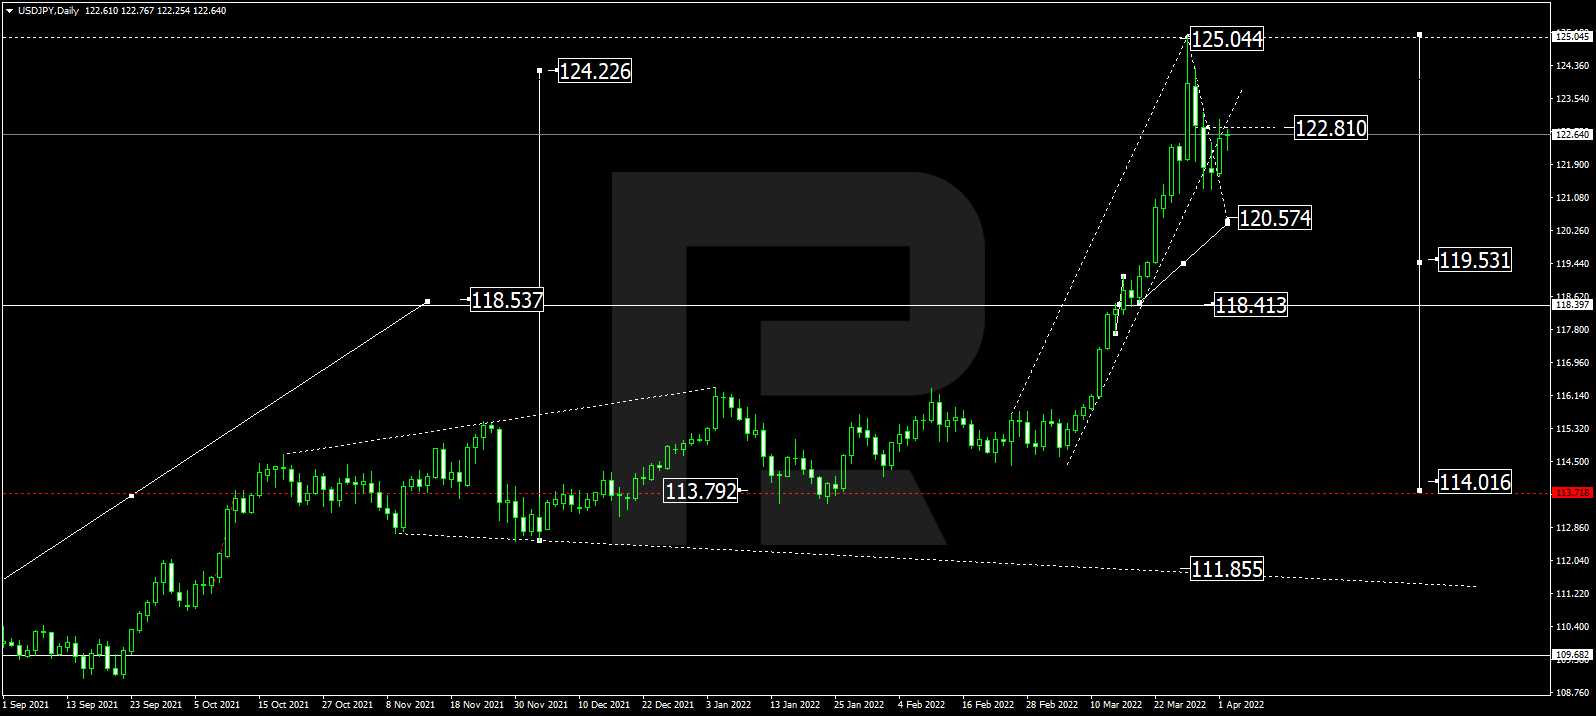
In the daily chart, having finished the ascending wave at 118.41 and formed a new consolidation range around this level, USDJPY has broken it to the upside to extend this structure up to 125.04; right now, it is forming the first structure to the downside with the first target at 120.57. Later, the market may correct to test 122.80 from below and then start a new decline to break 118.40. After that, the instrument may continue trading downwards with the target is at 114.00.

USDJPY
Risk Warning: the result of previous trading operations do not guarantee the same results in the future

BRENT

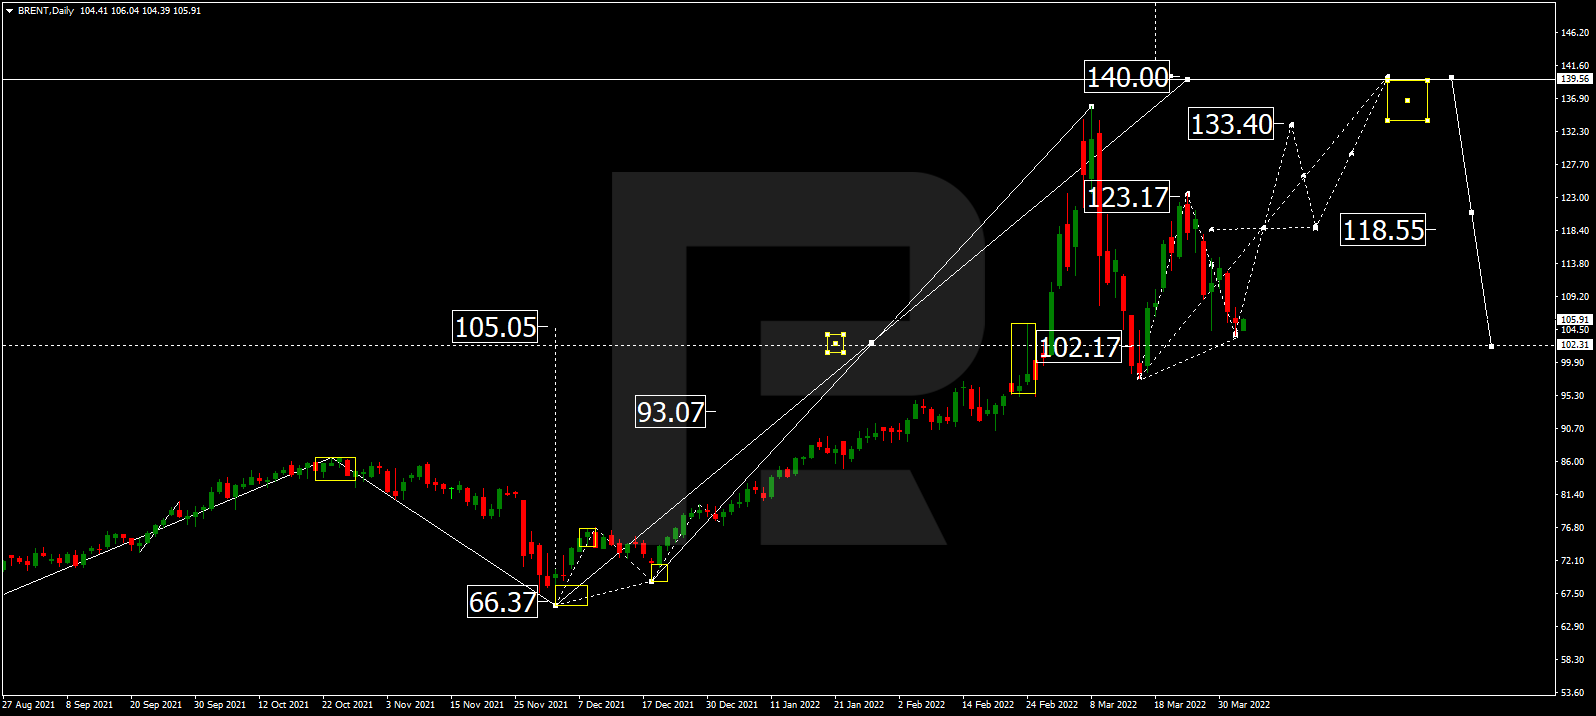
As we can see in the daily chart, Brent has completed the correction at 105.00; right now, it is consolidating around this level. Possibly, the asset may form one more ascending wave to break 118.55 and then continue trading upwards with the short-term target at 133.40. Later, the market may start another correction to return to 118.55 and then resume trading upwards to reach 140.00, at least.

BRENT
Risk Warning: the result of previous trading operations do not guarantee the same results in the future

XAUUSD, “Gold vs US Dollar”

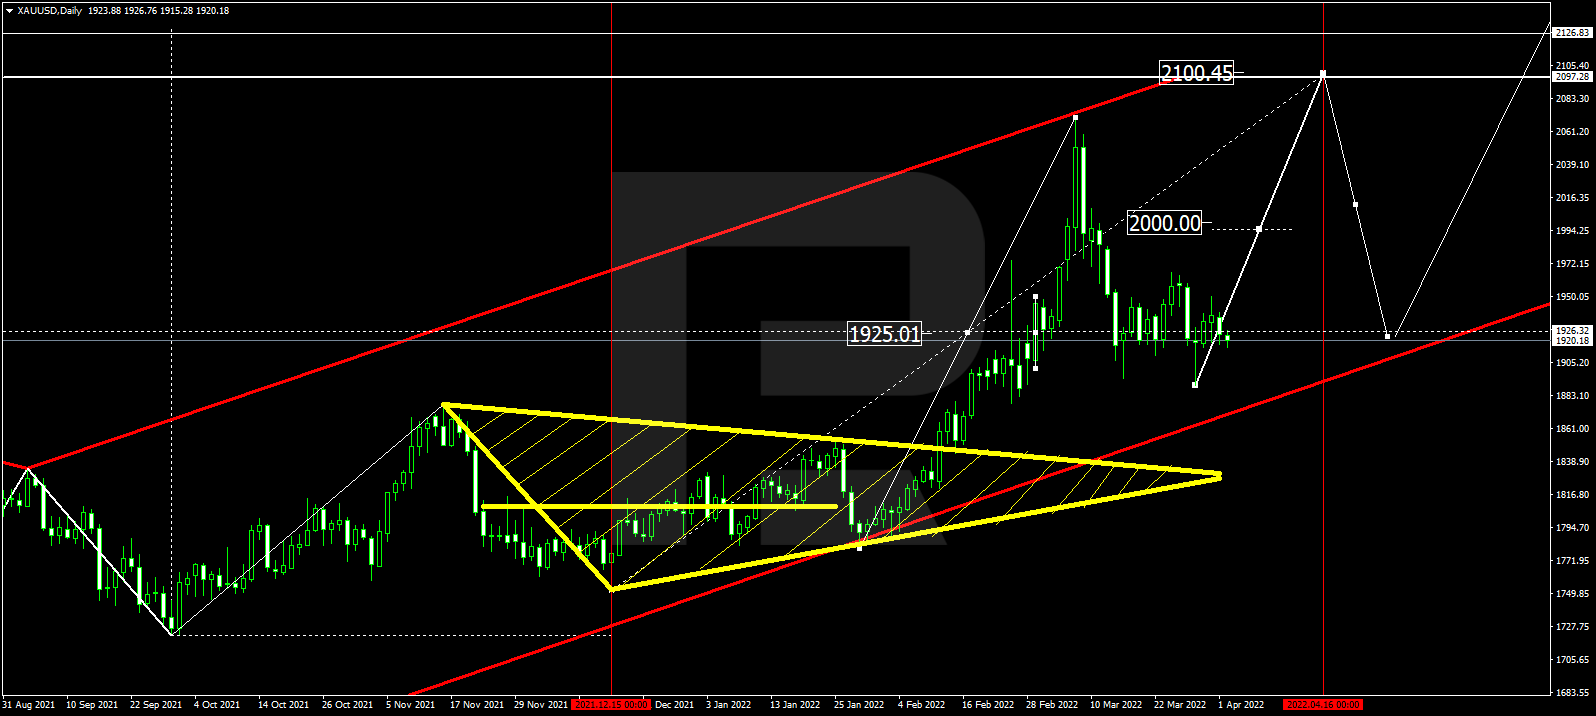
In the daily chart, Gold is still consolidating around 1926.30. The main scenario implies further growth towards 2000.00. After that, the instrument may break this level to the upside and form one more ascending structure with the target at 2100.50.

GOLD
Risk Warning: the result of previous trading operations do not guarantee the same results in the future

S&P 500

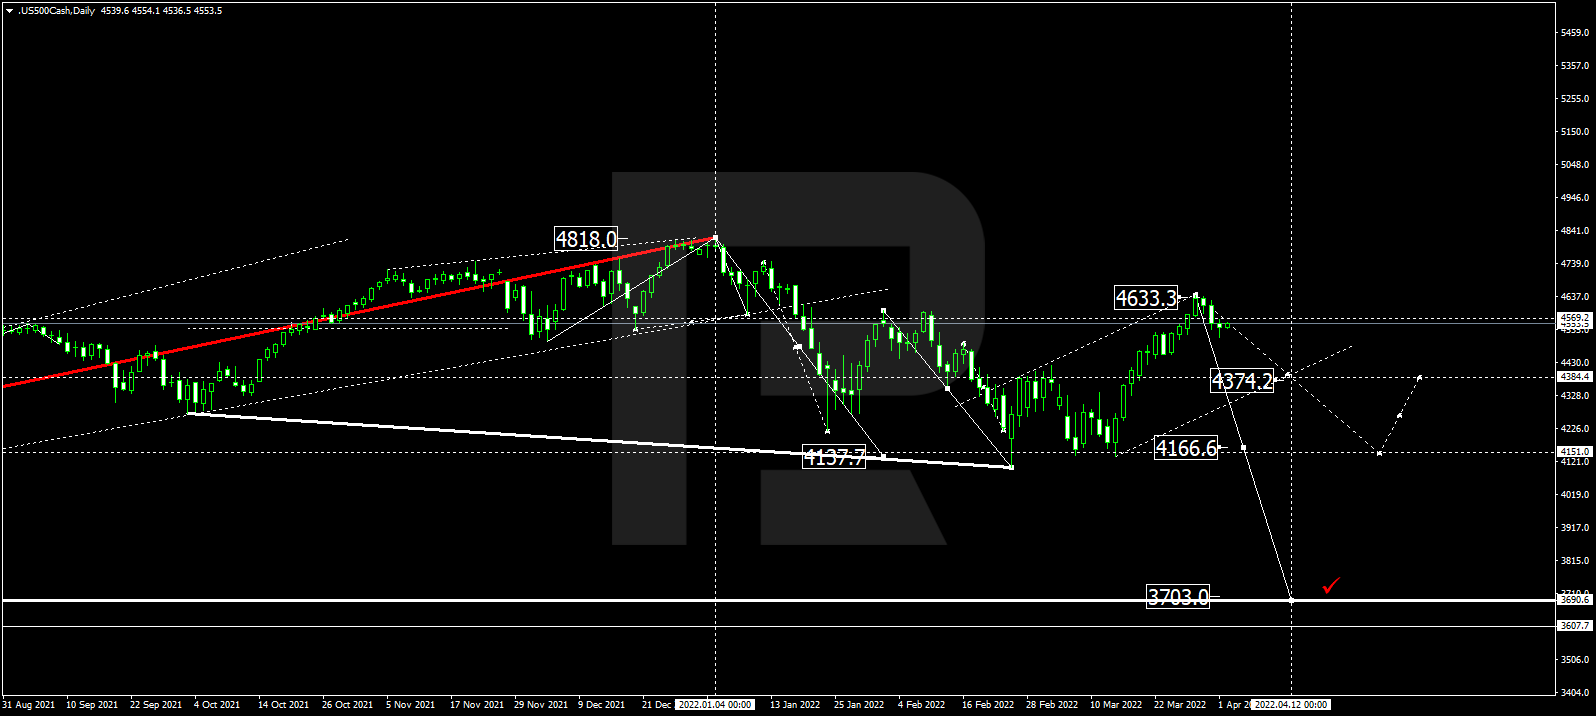
In the daily chart, the S&P index has finished the correctional wave at 4633.3; right now, it is consolidating below this level. Possibly, the asset may form a new descending structure to break 4374.2 and then continue trading downwards with the short-term target at 4166.6.

S&P500

Article By RoboForex.com

Attention!
Forecasts presented in this section only reflect the author’s private opinion and should not be considered as guidance for trading. RoboForex LP bears no responsibility for trading results based on trading recommendations described in these analytical reviews.