
By RoboForex Analytical Department
On Monday 4 April, the Brent price is “in the black”; the asset is trading at $105.40.
This sharp decline in oil prices was caused by US President Joe Biden’s decision to “unleash” the country’s reserve oil tanks and sell 1 million barrels every day. In total, 180 million barrels are expected to be sold from May to October. Moreover, the International Energy Agency agreed to unleash its oil reserves but no particular volumes have been announced yet.
This measure is expected to be a temporary solution and won’t help to solve the supply shortage issue.
Geopolitics is slowly becoming normal. The conflict between Saudi Arabia and Houthis from Yemen is dying down as the parties agreed to cease fire. It’s good news for oil deliveries.
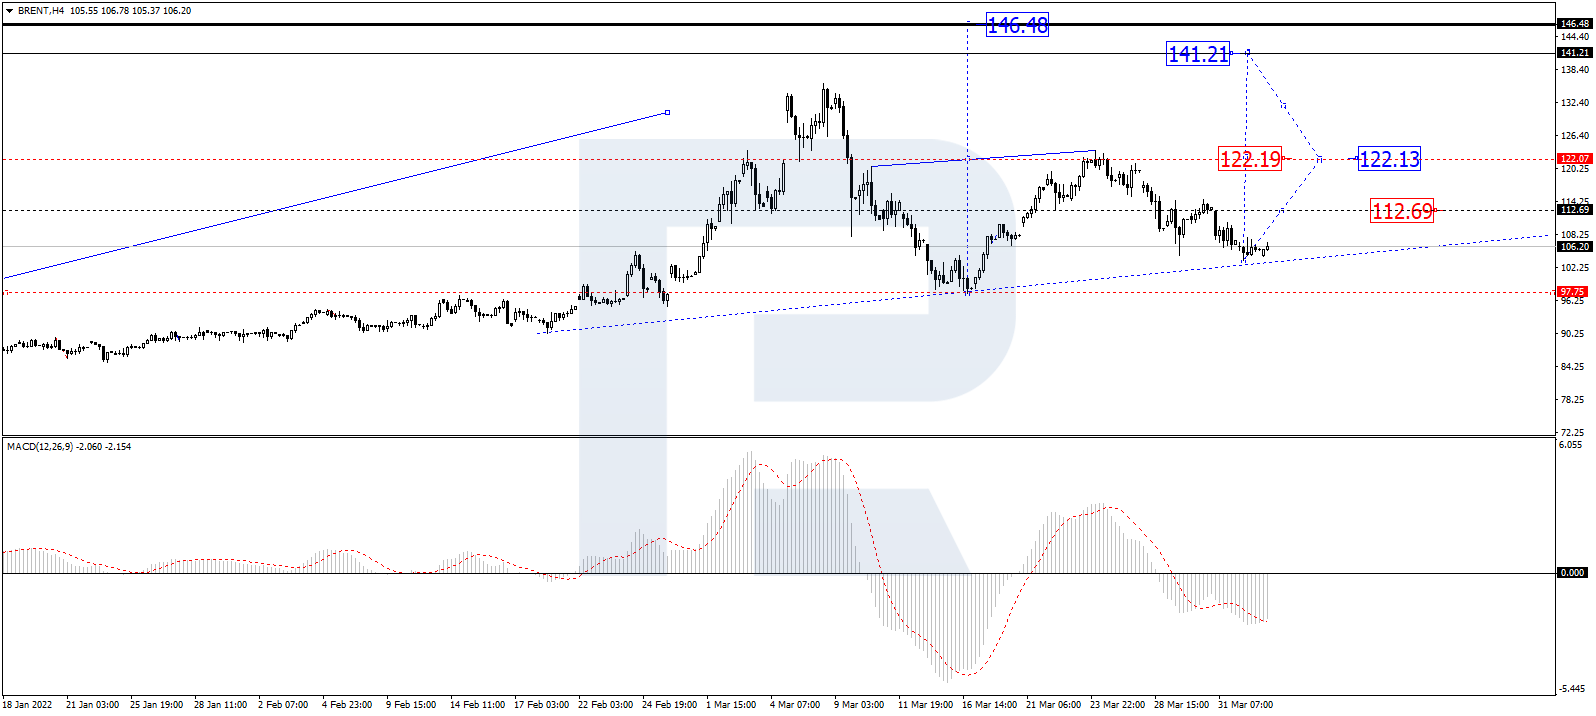
In the H4 chart, having completed the correctional structure at 113.66, Brent is consolidating around his level. If later the asset breaks this range to the upside, the market may resume growing to break 112.69 and then continue trading upwards with the first target at 122.20. After that, the instrument may correct to return to 112.70 and then resume trading upwards with the short-term target at 141.20. From the technical point of view, this scenario is confirmed by MACD Oscillator: its signal line is moving below 0 outside the histogram area, which means that it may grow to break the above-mentioned level and then continue moving towards new highs.
Free Reports:
 Get our Weekly Commitment of Traders Reports - See where the biggest traders (Hedge Funds and Commercial Hedgers) are positioned in the futures markets on a weekly basis.
 Sign Up for Our Stock Market Newsletter – Get updated on News, Charts & Rankings of Public Companies when you join our Stocks Newsletter
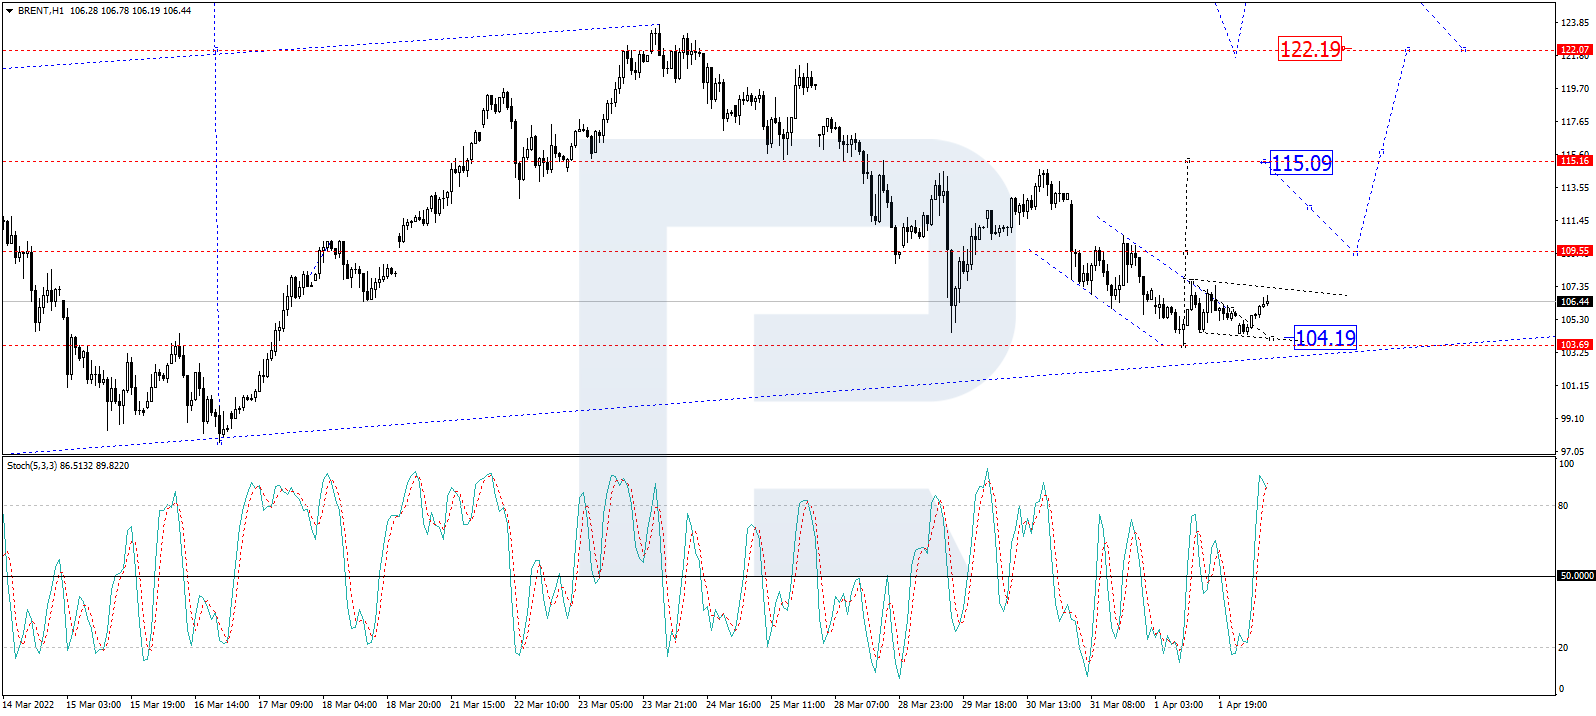
As we can see in the H1 chart, after finishing the correction and forming the first ascending impulse at 107.69, Brent is correcting downwards and may soon reach 104.20. Later, the market may start another growth to break 109.55 and then continue trading within the uptrend with the first target at 115.10. From the technical point of view, this idea is confirmed by the Stochastic Oscillator: its signal line is moving above 80 and may soon resume falling towards 50. After that, the line is expected to rebound from 50 to the upside and grow to return to 80.
Disclaimer
Any forecasts contained herein are based on the author’s particular opinion. This analysis may not be treated as trading advice. RoboForex bears no responsibility for trading results based on trading recommendations and reviews contained herein.

- COT Metals Charts: Weekly Speculator Bets led by Copper & Steel Jul 18, 2026
- COT Bonds Charts: Weekly Speculator Bets led by 2-Year, SOFR 3M & 5-Year Bonds Jul 18, 2026
- COT Energy Charts: Weekly Speculator Bets led by Brent Oil & Heating Oil Jul 18, 2026
- COT Soft Commodities Charts: Weekly Speculator Bets led by Wheat, Corn & Soybean Meal Jul 18, 2026
- The Bank of Canada kept its interest rate unchanged. Platinum prices reached a three‑week high Jul 16, 2026
- Stock indices rose after the release of US inflation data. China’s GDP slowed sharply Jul 15, 2026
- GBP/USD Awaits Political News: What Will Happen Next Jul 15, 2026
- USD/JPY Holds at Highs: Pressure Lingers on Yen Jul 14, 2026
- Oil prices jumped 4% amid a new wave of escalation between the US and Iran Jul 13, 2026
- EUR/USD: US Inflation Will Determine Everything Jul 13, 2026