
Article By RoboForex.com
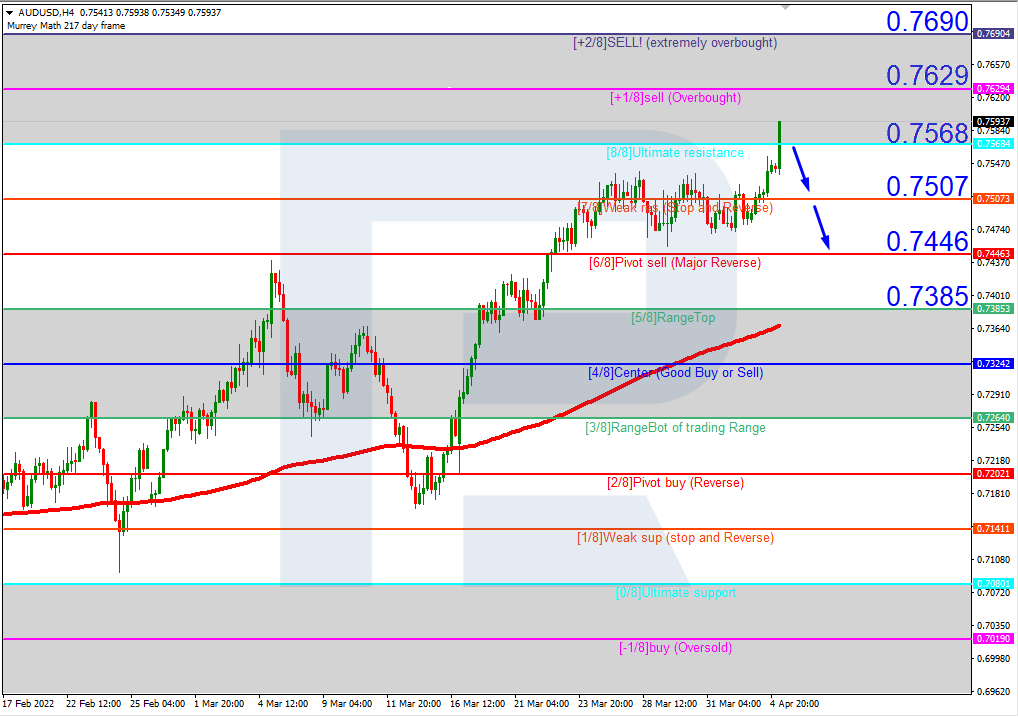
AUDUSD, “Australian Dollar vs US Dollar”
In the H4 chart, AUDUSD is trading inside the “overbought area”. In this case, the price is expected to break 8/8 and then continue falling to reach the support at 6/8. However, this scenario may no longer be valid if the price breaks the resistance at +1/8 to the upside. After that, the instrument may grow towards +2/8.

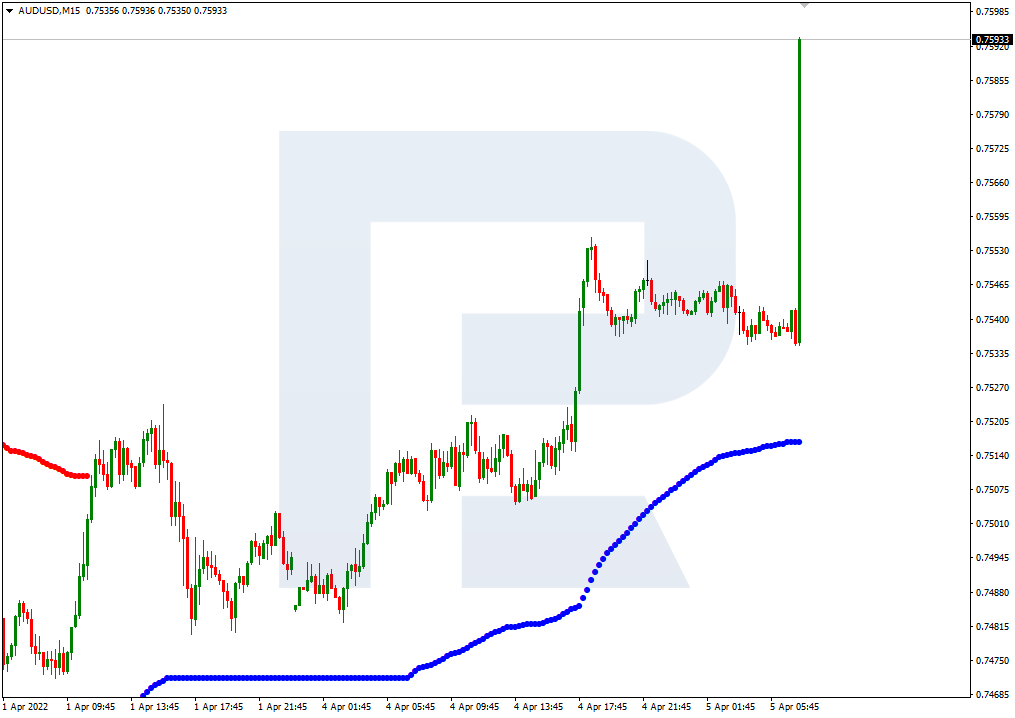
As we can see in the M15 chart, the downside line of the VoltyChannel indicator is pretty far away from the price, that’s why the pair may resume trading downwards only after rebounding from 8/8 in the H4 chart.
Free Reports:
 Get our Weekly Commitment of Traders Reports - See where the biggest traders (Hedge Funds and Commercial Hedgers) are positioned in the futures markets on a weekly basis.
 Download Our Metatrader 4 Indicators – Put Our Free MetaTrader 4 Custom Indicators on your charts when you join our Weekly Newsletter
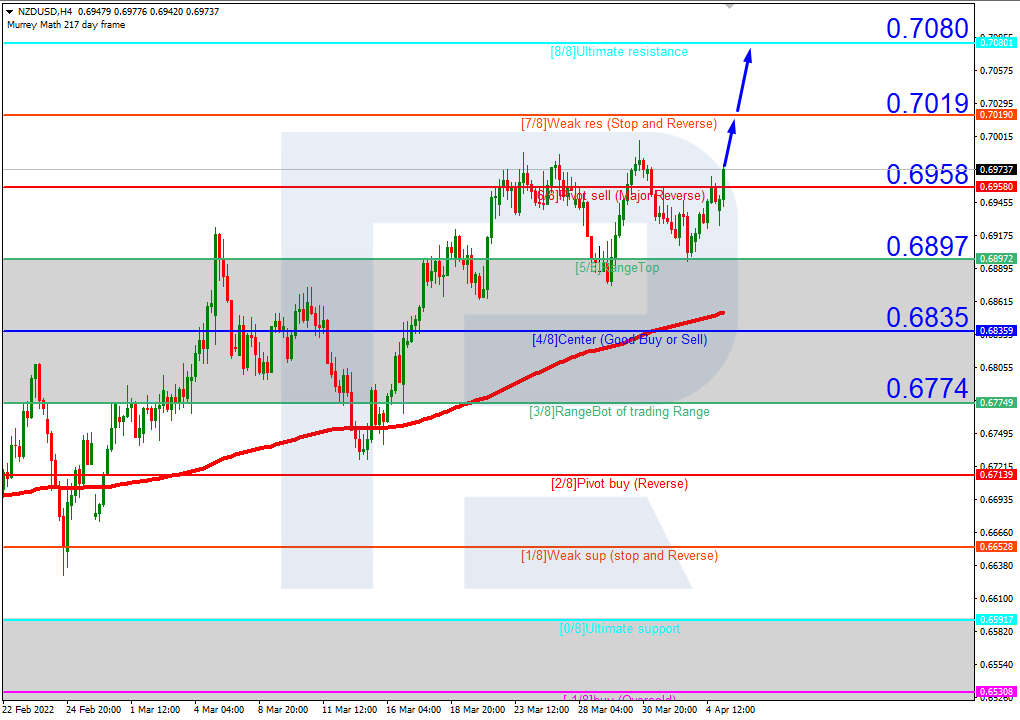
NZDUSD, “New Zealand Dollar vs US Dollar”
In the H4 chart, NZDUSD is trading above the 200-day Moving Average to indicate an ascending tendency. In this case, the price is expected to test 7/8, break it, and then continue growing to reach the resistance at 8/8. However, this scenario may no longer be valid if the price breaks 5/8 to the downside. After that, the instrument may reverse and fall towards the support at 4/8.
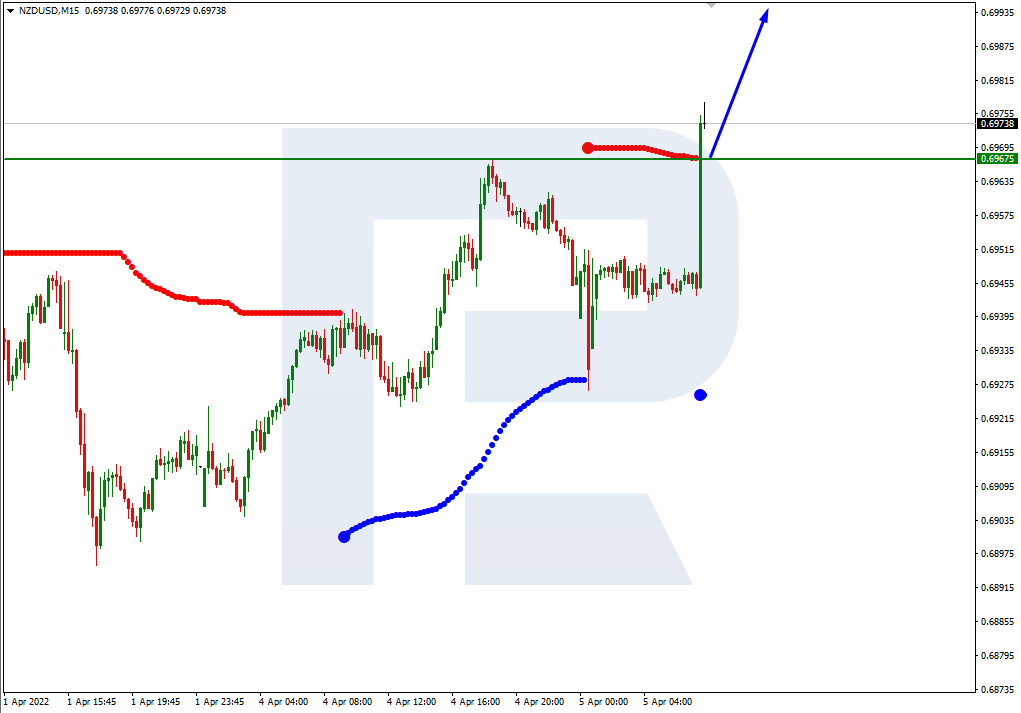
As we can see in the M15 chart, the pair has broken the upside line of the VoltyChannel indicator and, as a result, may continue its growth.
Article By RoboForex.com
Attention!
Forecasts presented in this section only reflect the author’s private opinion and should not be considered as guidance for trading. RoboForex LP bears no responsibility for trading results based on trading recommendations described in these analytical reviews.

- EUR/USD: The Advantage Remains with the Dollar Jun 29, 2026
- Escalation of the US–Iran conflict is once again supporting the rise in oil prices Jun 29, 2026
- Oil prices fall back to pre‑war levels. Silver drops to a 7‑month low Jun 25, 2026
- Gold Falls to an Eight-Month Low: This May Not Be the Bottom Jun 25, 2026
- Stock indices came under heavy selling pressure amid growing skepticism about AI investments Jun 24, 2026
- The Pound Is Pressured Not by Politics, but by a Strong US Dollar Jun 24, 2026
- Global crude oil prices continued to decline. The AUD/USD exchange rate hit an 11‑week low Jun 23, 2026
- EUR/USD Remains Under Sellers’ Control as the Dollar Stays Strong Jun 23, 2026
- Gold Falls for the Third Consecutive Week: Is There Still Upside Potential? Jun 22, 2026
- Bank Indonesia raised its interest rate. Norges Bank and the SNB left rates unchanged Jun 19, 2026