Intraday Market Analysis – AUD Resumes Uptrend

By Orbex

AUDUSD breaks major resistance

AUDUSD

The Australian dollar soared after the RBA signaled higher interest rates later this year. The pop above the daily resistance at 0.7550 has put the Aussie on a bullish reversal course for the weeks to come.

Solid green candles indicate a combination of short-covering and momentum buying. Last June’s high at 0.7770 is the next target.

In the meantime, the RSI’s overbought situation led to a brief pause. Trend followers could be looking to join the rally at pullbacks. 0.7470 is fresh support in this case.

GBPUSD awaits breakout

GBPUSD

The US dollar rallies as traders hoard the safe haven currency. The price is in a narrowing consolidation range as a sign of short-term hesitation.

Overall sentiment remained downbeat after the latest rebound hit resistance at 1.3300. The bulls need to lift offers around 1.3220 before they could turn the tables.

Otherwise, the path of least resistance would be down. 1.3050 is the closest support and the psychological level of 1.3000 is a critical floor. A bearish breakout could make the sterling vulnerable to a new round of sell-off.

SPX 500 seeks support

SPX 500

The S&P 500 falls back as yield curve inversion raises concerns of an economic contraction.

On the daily chart, a break above the February high at 4590 and a bullish MA cross suggest a steady market mood. A drop below 4580 prompted leverage buyers to bail out but found support at 4510.

4455 on the 20-day moving average would be the second line of defense in case of a deeper correction. Buyers may see short-term retracements as opportunities to stake in. A bounce above 4600 could be a continuation signal.


Orbex-LogoArticle by Orbex

Orbex is a fully licensed broker that was established in 2011. Founded with a mission to serve its traders responsibly and provides traders with access to the world’s largest and most liquid financial markets. www.orbex.com

Ichimoku Cloud Analysis 06.04.2022 (EURGBP, AUDUSD, GBPUSD)

Article By RoboForex.com

EURGBP, “Euro vs Great Britain Pound”

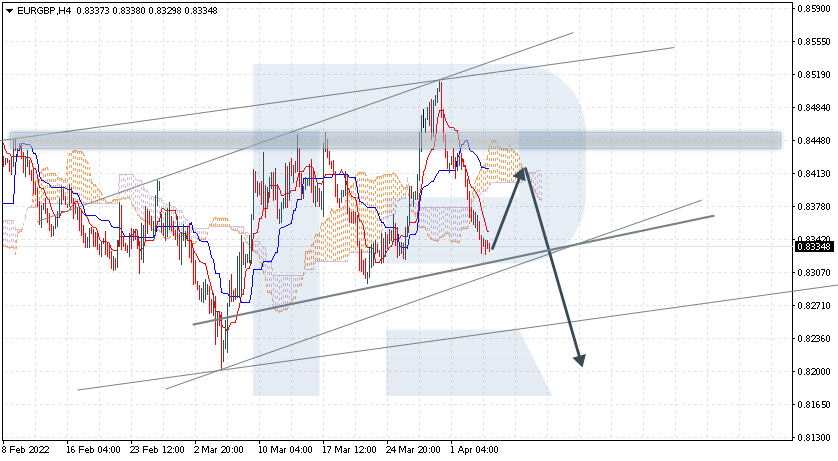
EURGBP is rebounding from the support area at 0.8334; the instrument is moving below Ichimoku Cloud, thus indicating a descending tendency. The markets could indicate that the price may test the cloud’s upside border at 0.8415 and then resume moving downwards to reach 0.8205. Another signal in favour of a further downtrend will be a rebound from the right “shoulder” of a Head & Shoulders reversal pattern. However, the bearish scenario may no longer be valid if the price breaks the cloud’s upside border and fixes above 0.8490. In this case, the pair may continue growing towards 0.8585. To confirm further decline, the asset must break the pattern’s “neckline” and fix below 0.8305.

EURGBP
Risk Warning: the result of previous trading operations do not guarantee the same results in the future

AUDUSD, “Australian Dollar vs US Dollar”

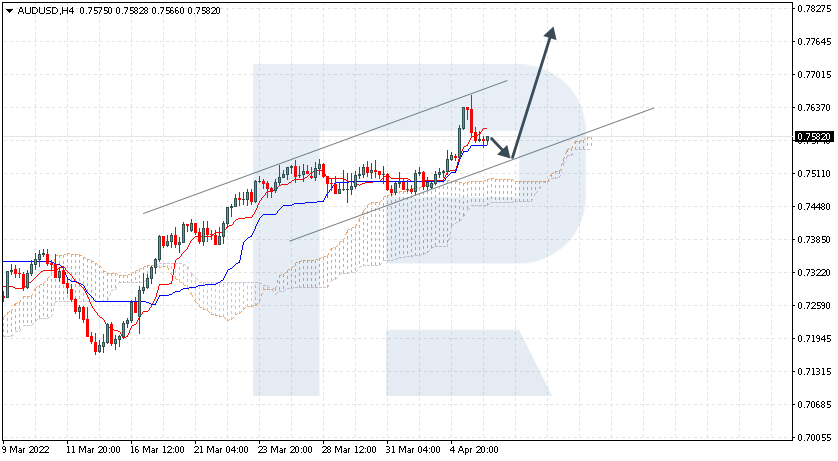
AUDUSD is rebounding from Tenkan-Sen and Kijun-Sen at 0.7582; the instrument is moving above Ichimoku Cloud, thus indicating an ascending tendency. The markets could indicate that the price may test the rising channel’s downside border at 0.7555 and then resume moving upwards to reach 0.7785. Another signal in favour of a further uptrend will be a rebound from the support area. However, the bullish scenario may no longer be valid if the price breaks the cloud’s downside border and fixes below 0.7430. In this case, the pair may continue falling towards 0.7350.

AUDUSD
Risk Warning: the result of previous trading operations do not guarantee the same results in the future

GBPUSD, “Great Britain Pound vs US Dollar”

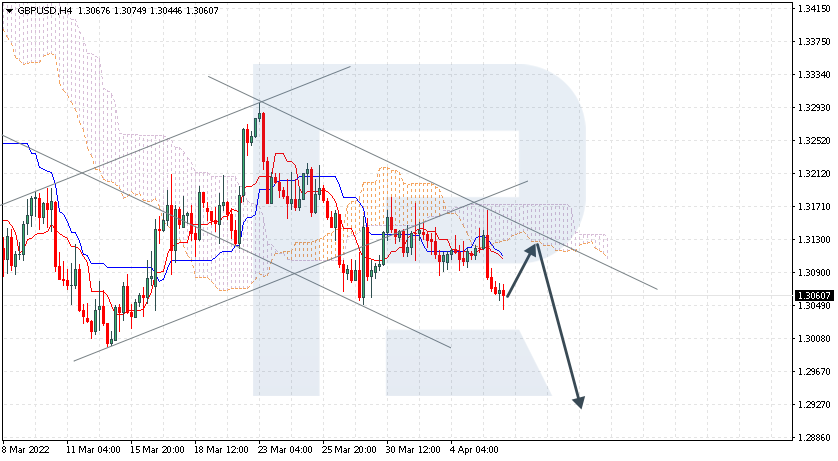
GBPUSD is testing the support level at 1.3050; the instrument is moving below Ichimoku Cloud, thus indicating a descending tendency. The markets could indicate that the price may test the cloud’s downside border at 1.3105 and then resume moving downwards to reach 1.2925. Another signal in favour of a further downtrend will be a rebound from the descending channel’s upside border. However, the bearish scenario may no longer be valid if the price breaks the cloud’s upside border and fixes above 1.3205. In this case, the pair may continue growing towards 1.3305.

GBPUSD

Article By RoboForex.com

Attention!
Forecasts presented in this section only reflect the author’s private opinion and should not be considered as guidance for trading. RoboForex LP bears no responsibility for trading results based on trading recommendations described in these analytical reviews.

The cryptocurrency market digest. Overview for 06.04.2022

Article By RoboForex.com

The cryptocurrency expectedly responded to the US stock market decline. Yesterday, American policymakers spoke and said that the US Fed’s portfolio would be cut much faster than in the past, as well as announced a possibility of a 50-point rate hike during its meeting on 3-4 May. This news made investors sell assets and indices and, as a natural result, brought the BTC down.

The BTC earlier reached $47,200, and then dropped to today’s level of $45,444. A strong resistance level was formed at $47,800, which the BTC failed to break. The longer the resistance level remains strong, the more chances the asset has for further decline. On the other hand, one should remember that the BTC rate leaped up almost 28% over three months. Taking into account this fact, the asset may afford an opportunity to stay inside the range and fix within the “flat”.

It might be a problem for the BTC to continue growing without support from the stock investors. However, they might use the major cryptocurrency as a “safe haven” asset to fight inflation. It will be interesting to see the unfolding situation.

Bitcoin chart online

Tezos: a blockchain update

Tezos announced a major blockchain update that had an impact on algorithms – Ithaca 2, which replaced Emmy with Tenderbake. A new algorithm reduces the time spent on building a block, provides a higher transaction speed, and allows applications to work smoothly and without failures. In addition to that, the update is expected to have a positive influence on network scalability processes and strengthen Tezos’ decentralisation positions.

The Tezos rate didn’t respond to the positive new: it has dropped 12% over three days and is currently heading towards $3.43.

Mining: a new chip from Intel

Intel unveiled a new chip for BTC mining, Blockscale ASIC. The chip is assumed to have higher energy efficiency and better performance. Some mining companies have already taken an interest in the product. The logic is pretty clear: the less energy the chip uses, the lower the expenses.

MacroStrategy is buying the BTC

MicroStrategy’s subsidiary company, MacroStrategy, has bought 4.1K BTCs worth $190.5 million. To do this, the company got a $205-million bitcoin-secured loan. As of now, MacroStrategy owns BTCs worth $5.9 billion, an average purchase price of about $30.7K per BTC.

Article By RoboForex.com

Attention!
Forecasts presented in this section only reflect the author’s private opinion and should not be considered as guidance for trading. RoboForex LP bears no responsibility for trading results based on trading recommendations described in these analytical reviews.

The Analytical Overview of the Main Currency Pairs on 2022.04.06

by JustForex

The EUR/USD currency pair

Technical indicators of the currency pair:
  • Prev Open: 1.0971
  • Prev Close: 1.0905
  • % chg. over the last day: -0.60%

Belgian central bank governor Pierre Wunsch said the European Central Bank might raise interest rates to zero as early as this year to fight high inflation. But so far, it’s all just talk, so verbal comments from the US Federal Reserve officials about tightening monetary policy have a greater impact on the dollar index and, accordingly, on the European currency. Currently, the mid-term forecast for the EUR/USD currency pair is negative.

Trading recommendations
  • Support levels: 1.0887, 1.0823, 1.0633
  • Resistance levels: 1.0946, 1.0963, 1.1027, 1.1075, 1.1135, 1.1196, 1.1291

From the technical point of view, the trend on the EUR/USD currency pair in the hourly time frame is bearish. The price is confidently declining. The MACD indicator is in the negative zone. The price has reached the support level, so it is too late for sell deals. Under such market conditions, traders can look for buy trades on the intraday timeframes from the support level of 1.0887, but only with short targets and confirmation. Sell trades should be considered from the resistance level of 1.0946 or 1.0963, but only after the additional confirmation.

Alternative scenario: if the price breaks out through the 1.1135 resistance level and fixes above, the uptrend will likely resume.

EUR/USD
News feed for 2022.04.06:
  • – Eurozone Producer Price Index (m/m) at 12:00 (GMT+3);
  • – US FOMC Meeting Minutes at 21:00 (GMT+3).

The GBP/USD currency pair

Technical indicators of the currency pair:
  • Prev Open: 1.3111
  • Prev Close: 1.3071
  • % chg. over the last day: -0.30%

The PMI index in the UK services sector showed strong growth yesterday. Economic indicators of the UK continuos to show growth, unlike other European countries. The strengthening of the dollar index negatively affects the British currency, but the pound looks more stable than the euro.

Trading recommendations
  • Support levels: 1.3067, 1.3015, 1.2989, 1.2863
  • Resistance levels: 1.3144, 1.3161, 1.3244, 1.3274

On the hourly time frame, the GBP/USD currency pair trend is still bullish. But sellers’ pressure intensifies, and the price tests the priority change level for the second time. The MACD indicator has become negative. Under such market conditions, buy trades should be considered from the support level of 1.3067, but only after confirmation in the form of a buyers’ initiative. Sell deals should also be considered from the resistance level of 1.3144 if the price shows a bearish initiative.

Alternative scenario: if the price breaks down through the 1.3067 support level and fixes below, the mid-term uptrend will likely be broken.

GBP/USD
News feed for 2022.04.06:
  • – UK Construction PMI (m/m) at 11:30 (GMT+3).

The USD/JPY currency pair

Technical indicators of the currency pair:
  • Prev Open: 122.77
  • Prev Close: 123.59
  • % chg. over the last day: +0.66%

The fundamental picture for the Japanese yen remains unchanged. The monetary policy of the Bank of Japan is now “ultra-soft” and aims to decrease the national currency rate (USD/JPY growth). In the debt market, US bonds reached almost a three-year high amid hawkish statements from Fed officials, while Japanese bond yields are at the same level. The dollar index increased to its highest level in almost two years. The mid-term outlook remains unchanged – analysts see a continuation of the uptrend, as the monetary policy of the US and Japanese central banks are now opposed.

Trading recommendations
  • Support levels: 122.97, 122.63, 121.83, 120.88, 119.52, 117.72
  • Resistance levels: 125.22

The medium-term trend on the USD/JPY currency pair is bullish. The buyer’s pressure is increasing again. The MACD indicator has become positive. Under such market conditions, it is best to look for buy deals, expecting the continuation of the uptrend. First of all, it is worth considering the support level of 122.97 or 122.63, but with additional confirmation. A resistance level of 125.22 may be considered for sell deals, but only after the sellers’ initiative.

Alternative scenario: If the price fixes below 119.52, the uptrend will likely be broken.

USD/JPY
There is no news feed for today.

The USD/CAD currency pair

Technical indicators of the currency pair:
  • Prev Open: 1.2478
  • Prev Close: 1.2486
  • % chg. over the last day: +0.06%

The Canadian dollar is a commodity currency and is highly dependent on the movement of oil prices and the dollar index. Oil prices fell yesterday. Tighter US monetary policy will put downward pressure on oil prices, but it is positive for the dollar index. On the other hand, the Bank of Canada plans to tighten its monetary policy. The USD/CAD currency pair will show wide volatility without any dynamics in the medium term.

Trading recommendations
  • Support levels: 1.2430
  • Resistance levels: 1.2520, 1.2563, 1.2655, 1.2713, 1.2754, 1.2851

In terms of technical analysis, the USD/CAD currency pair trend is bearish, but the price is getting a wide flat structure. The MACD indicator has become positive. Trade only with short targets, since fundamentally on the USD/CAD currency pair, there are no prerequisites for the medium-term trend. Under such market conditions, it is better to look for buy trades on the lower timeframes from the support level of 1.2430, but it is better with additional confirmation. For sell deals, it is better to consider the resistance level of 1.2520.

Alternative scenario: if the price breaks through and consolidates above 1.2592, the downtrend will likely be broken.

USD/CAD
News feed for 2022.04.06:
  • – Canada Ivey PMI (m/m) at 17:00 (GMT+3);
  • – US Crude Oil Reserves (w/w) at 17:30 (GMT+3).

by JustForex


This article reflects a personal opinion and should not be interpreted as an investment advice, and/or offer, and/or a persistent request for carrying out financial transactions, and/or a guarantee, and/or a forecast of future events.

More and more Fed officials are tending to tighten monetary policy aggressively. New sanctions against Russia

by JustForex

Financial markets are now susceptible to verbal interventions by the US Federal Reserve officials. Yesterday, after Lael Brainard’s speech, US indices fell sharply. Ms. Brainard is known for her dovish stance on monetary policy, but yesterday her tone changed to hawkish. “Inflation is very high and could go even higher, which would require permanent interest rate increases and balance sheet cuts,” Brainard said on Tuesday. “To reduce inflation, the Fed will continue to methodically tighten monetary policy through a series of interest rate hikes and rapid balance sheet cuts immediately following our May meeting,” the policymaker added.

After Brainard’s speech, Treasury bond yields jumped sharply: 10-year bond yields have jumped 2.5% to near three-year highs in rising market sectors, including technology. As a result, the dollar index rose, and major indices fell.

At the end of the day yesterday, the Dow Jones Index (US30) decreased by 0.80%, the S&P 500 Index (US500) fell by 1.26%, and the NASDAQ Technology Index (US100) lost 2.26%.

Spirit Airlines reports receiving a $3.6 billion merger offer from JetBlue.

Today, investors’ attention will be focused on the publication of the Fed’s latest policy meeting minutes. At the next meeting of the US Federal Reserve in May, investors and analysts will be scrutinized it for clues for a 50 basis point hike. It is now believed that the Fed will choose this rate with an 80% probability.

The US is planning to put Sberbank on the sanctions list. Yesterday, the British Foreign Secretary said that the United Kingdom would call on the G7 countries to set a clear deadline for stopping Russian oil and gas imports.

Yesterday, European stock markets traded without a single trend amid new sanctions against Russia, which will also indirectly hit the European economy. Yesterday German DAX (DE30) decreased by 0.65%, French CAC 40 (FR40) lost 1.28%, Spanish IBEX 35 (ES35) gained 1.20%, British FTSE 100 (UK100) added 0.72%.

The EU imposes new sanctions against Russia over the situation in Bucha and the entire Kyiv region:
  • a coal embargo against Russia, which will cost Russia 4 billion euros a year;
  • exports of semiconductors, machinery and transport equipment worth 10 billion euro to Russia;
  • any transactions with four key Russian banks, including VTB;
  • Russian ships will be banned from entering EU ports;
  • Imports from the Russian Federation of a number of goods and raw materials such as lumber, seeds, seafood, and alcohol;
  • Russian companies will be banned from participating in European public procurement, and the Russian government agencies will be deprived of financial support from the EU.

Oil prices fell yesterday. Tighter monetary policy will put downward pressure on oil prices. This also applies to energy companies. The release of US and UK strategic oil reserves will also help lower oil prices. Analysts believe that it is time to withdraw energy companies from portfolios, despite the high deficit and even because of the possible full embargo on Russian oil.

Ukrainian President Vladimir Zelensky told the UN Security Council on Tuesday that Russia should be held accountable for accusations of military atrocities. Zelensky questioned the value of the 15-member Security Council, which failed to act on February 24 since Moscow, a permanent Security Council member, has a veto power along with the United States, France, Britain, and China. “We are dealing with a state that is turning its veto in the UN Security Council into the right to cause death,” Zelensky said live from the Ukrainian capital of Kyiv, calling for action to reform the World Organization.

Satellite images taken in March and provided to Reuters by US company Maxar Technologies show the bodies of civilians on the street in Bucha that was occupied by Russian troops until about March 30, refuting the Kremlin’s claims of staging scenes.

Asian markets traded in positive territory yesterday. Japan’s Nikkei 225 (JP225) gained 0.19% yesterday, while Australia’s S&P/ASX 200 (AU200) ended the day with +0.19%. There was a bank holiday in Hong Kong. Today’s trading in Asian markets began to decline, following the US indices. Activity in China’s service sector declined at the fastest pace in two years in March as a spike in coronavirus infections limited mobility and affected customer demand. On Tuesday, Chinese authorities extended the COVID-19 lockdown in Shanghai.

Main market quotes:

S&P 500 (F) (US500) 4,525.12 -57.52 (-1.26%)

Dow Jones (US30) 34,641.18 -280.70 (-0.80%)

DAX (DE40) 14,424.36 -93.80 (-0.65%)

FTSE 100 (UK100) 7,613.72 +54.80 (+0.72%)

USD Index +0.50 (+0.50%)

Important events for today:
  • – UK Construction PMI (m/m) at 11:30 (GMT+3);
  • – Eurozone Producer Price Index (m/m) at 12:00 (GMT+3);
  • – Canada Ivey PMI (m/m) at 17:00 (GMT+3);
  • – US Crude Oil Reserves (w/w) at 17:30 (GMT+3);
  • – US FOMC Meeting Minutes at 21:00 (GMT+3).

by JustForex


This article reflects a personal opinion and should not be interpreted as an investment advice, and/or offer, and/or a persistent request for carrying out financial transactions, and/or a guarantee, and/or a forecast of future events.

Why Russia has put the rouble on a gold standard – but it’s unlikely to last

By Alexander Mihailov, University of Reading 

The Bank of Russia, the country’s central bank, has surprisingly announced a fixed price for buying gold with roubles. With a price of RUB5,000 (£45.12) for a gram of gold, to my knowledge it’s the first time that a nation’s currency has been expressed in “gold parity” since Switzerland decided to stop doing so in 1999.

Enacting gold parity was common practice by the world’s major powers for facilitating international trade payments in the era of the gold standard in the 19th and early 20th centuries. The same was true in a slightly different way during the Bretton Woods era from 1944 until 1971, which was when US President Nixon decided to end the system by removing the link between gold and the US dollar.

Putin’s new arrangement is envisaged, initially, to hold from March 28 to June 30. It is the latest in a series of rouble-related moves by the Russians, starting with the announcement on March 23 that they would only accept roubles for European gas instead of euros and US dollars. I predicted that Russia would at least extend this policy to oil, but it has gone further and signalled an intention to make it apply to all the commodities it exports (others include wheat, nickel, aluminium, enriched uranium and neon).

The main goal of these moves is to try to ensure the credibility of the rouble by making it more desirable in the forex market, though it also fits into longstanding attempts by Russia and China to weaken the US dollar’s dominance as global reserve currency (meaning it’s the currency in which most international goods are priced and which most central banks hold in their foreign reserves).

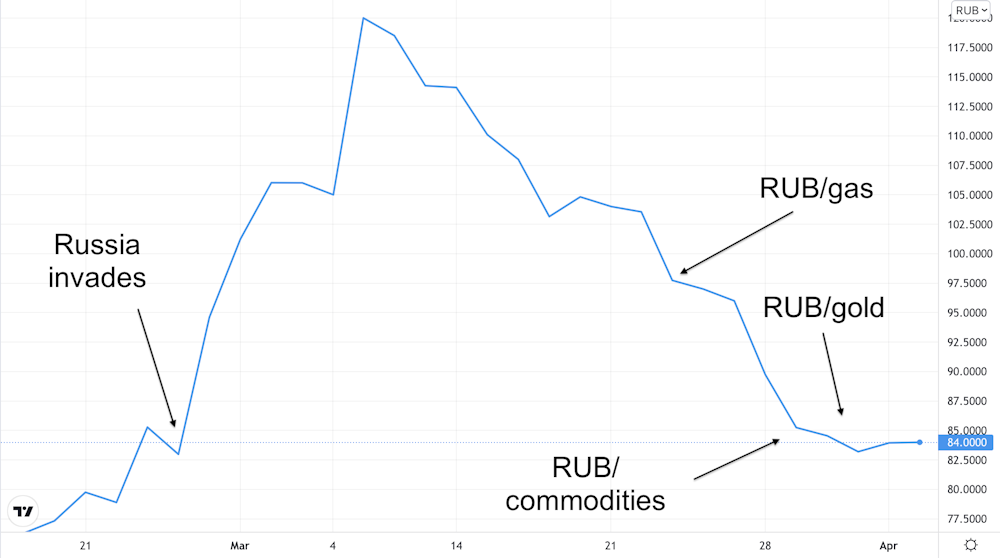
As one can see in the chart below, the rouble collapsed by more than 70% in late February and early March when western sanctions were imposed in response to Russia’s invasion of Ukraine (the collapse looks like a rise in the chart because it’s showing the number of roubles to the US dollar rather than the other way around).

Rouble/USD chart

RUBUSD chart
Trading View

After the big drop, the rouble recovered somewhat, which is typical in such situations (known in the literature as “exchange-rate overshooting”). However, the currency strengthened further after the roubles-for-gas announcement (no matter how serious or implementable the plan actually is – so far, there has been resistance to Putin’s new rules).

On the back of the gold announcement, the currency has continued to strengthen to about RUB83 to the dollar. As precious metals analyst Ronan Manly has said, this makes sense if you reflect that the market price of a gram of gold is currently about US$62 (£47.20). That’s fairly close to Putin’s announcement that 1 gram of gold equals RUB5,000, which effectively creates a gold-based exchange rate of RUB81 to US$1.

Previous gold-based systems

To give a sense of the similarities with the gold standard and the Bretton Woods system, let me draw a historical parallel. The UK’s Coinage Act of 1816 fixed the value of the pound sterling to 113 grains of pure gold, while the US Gold Standard Act of 1900 determined that the dollar should maintain a value of 23.22 grains of pure gold. Taken together, the two acts implied an official gold parity exchange rate of £1 = US$4.87.

It was similar during the post-war Bretton Woods era: 1 ounce of gold was said to be worth US$35, and all other currencies were fixed to and convertible into the US dollar. Gold was at the centre of the system as a way of making money credible.

Of course, attaching the rouble to a gold standard comes with certain “rules of the game” that Russia will have to abide by. It should be willing to exchange gold for roubles with anyone who wants to do so.

This was what the US did during the Bretton Woods era, and it led to the system’s demise: with US expenditure rising to wage the Vietnam war, dollar holders became increasingly nervous about the dollar’s value and sought to exchange it for gold.

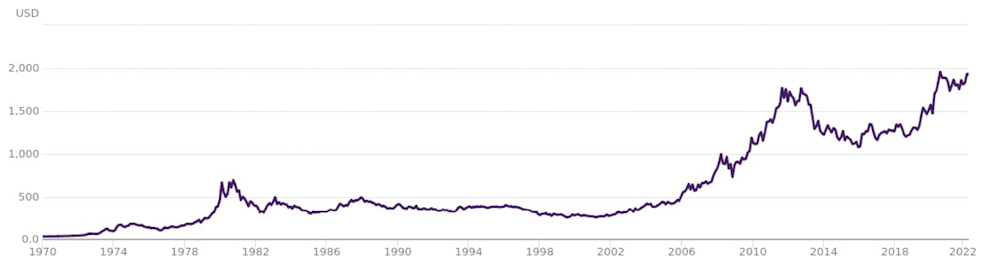
Nixon’s unilateral decision to end convertibility was for fear that the US would run out of gold, which would have destroyed the credibility of the dollar. Since that decision, the world has moved to a system of floating exchange rates and the price of gold has steadily risen as world currencies have become weaker in relation to it. The system has effectively been supported by a deal that the Americans struck in the early 1970s to buy oil from the Saudis and give them military support in exchange for the Saudis using the dollars to buy US government bonds.

Gold price (US$/ounce)

Gold price chart
Gold Hub

The problem for Russia is that if it is willing to exchange roubles for gold, it could soon end up in a similar situation to the US circa 1971. Wars are an abnormal state of affairs which come with huge uncertainty: no reliable forecasts are possible, and markets are liable to overreact to new developments – particularly in the short term. If confidence in the rouble falls again, many investors might decide to withdraw gold from the central bank, which could be extremely destabilising for Moscow.

The viability of Russia maintaining a fixed rate of roubles for gold is closely related to what happens to demand for Russian energy. If the west can only slowly substitute away from its dependence on Russia’s oil and gas, then demand for roubles will help to keep the currency propped up (especially if the west does end up paying in roubles).

But if politicians listen to economists and immediately stop importing Russian gas, oil and other commodities, the rouble could fall dramatically – along with the whole Russian economy. As much as this would cause a further spike in prices and pain all round, it may be the most efficient and perhaps even safest way to induce Russia to stop the war.The Conversation

About the Author:

Alexander Mihailov, Associate Professor in Economics, University of Reading

This article is republished from The Conversation under a Creative Commons license. Read the original article.


Important Calculations In Forex Trading – FREE Live Webinar!

By Orbex

fx calculations

Calling all beginner Forex traders! We’ve put together a comprehensive webinar dedicated to teaching you how to trade the financial markets!

Next Monday, April 11th at 5 PM GMT, our seasoned market expert David Kindley will be going live on Zoom to cover all the basic forex calculations you need to begin your online trading journey.

Sign up now for a chance to learn:

  • How to calculate margins when trading
  • How to include leverages into your trades
  • How to calculate pips and points
  • How to set pending orders

The webinar is free to attend, but seats are limited.

Book your spot today to start trading responsibly!

Register Now!


Orbex-LogoArticle by Orbex

Orbex is a fully licensed broker that was established in 2011. Founded with a mission to serve its traders responsibly and provides traders with access to the world’s largest and most liquid financial markets. www.orbex.com

Traders: Are You Set Up for Success? Well, There’s No Time Like the Present

Our brand-new FREE report ($49 value) reveals the “Top 5 Set-ups” for nailing market reversals. #4 helped us catch a huge turn in Apple Inc.

By Elliott Wave International

Think about the last time you watched a great athlete perform an extraordinary feat of strength, agility or artistry.

What part do you remember most?

Chances are, it’s not the running back and forth on the court mid-game, the 100 sit-ups on the side of the pool waiting one’s turn, or the silent scanning of the billiard table layout.

No, the parts that stick in your mind are the slow-motion replay of the ball soaring 23 feet mid-air from the 3-point line and then, SWOOSH! clean into the basket. It’s the last heart-pounding step off the diving board into a triple twist only to breach the water with a pebble-sized splash. And it’s the 8-ball ricocheting off the sides of the table, zig then zag then right into the corner pocket.

But here’s the thing. The years of training that shape these unforgettable triumphs aren’t about what comes after the throw, leap, or strike into thin air. It’s about the mental and physical discipline that comes before in the countless hours spent designing and redesigning the most likely winning lay-up until all you have to do when your turn is up is…

…release.

This is exactly what it means to become a successful trader as well, though you wouldn’t know it from the popular financial media. Like their sportscasting counterparts, the main focus tends to be on the size of the winning shot or stock (as is their case), and not on what goes into ensuring that shot is made.

On March 15, this Barron’s headline exclaimed:

“Amazon, Alphabet, and 8 Other Beaten-Up Growth Stocks Set to Soar”

Okay. But why? Because they did it before; because “Wall Street loves” them; because they’re so battered down the only way to go is up?

Those arguments only see the shot. When in fact, these growth stocks will soar when, and only when, a clearly defined bullish technical set-up develops on their charts.

QUESTION: Would you recognize such a set-up if it did?

Well, our new free report ensures you can do just that. In “5 Easy-to-Spot Chart Set-ups to Help You Nail Market Reversals,” three of Elliott Wave International’s experienced technical analysis instructors have joined forces to create a masterclass in identifying and implementing these high-confidence arrangements.

One such set-up from the report is the contracting triangle Elliott wave pattern, pictured below in a bull and bear market.

Again, the real action of this pattern occurs behind the scenes, in a lengthy sideways move. It’s 90% set-up and 10% shot, or as EWI’s chief market analyst and “5 Easy-to-Spot Chart Set-ups” instructor Jeffrey Kennedy says, it’s a “ready, aim, aim, aim some more, and then fire!” kind of opportunity.

How this plays out in real time is captured best in the performance of Apple Inc.

– How ‘Bout Them Apples? –

2020-2021 saw Apple Inc. stock stuck in a multi-year long consolidation. Mainstream bulls were dropping like flies out of boredom. The May 28, 2021 Barron’s article showcased a slew of analyst downgrades from “neutral” to “sell,” forecasting a “30% drop” in Apple stock “if iPhone sales continue to slow.”

Added the June 1 Bloomberg article: “Once Tech’s Golden Child, Apple Loses Its Luster as Scrutiny Grows.”

The very thing that convinced mainstream analysts of Apple’s rot — i.e., sideways price action — was the same thing that bolstered our confidence in the stock’s upside. Namely, that price action was the hallmark of an Elliott wave contracting triangle.

On June 8, in his Trader’s Classroom video lesson, editor Jeffrey Kennedy showed this bullish set-up in Apple and said:

“I don’t think there’s an Elliott wave pattern more frustrating than the triangle.

“I think the most important aspect of a triangle is that it acts as a harbinger of a change in trend… If you see a triangle taking shape, understand that the party is almost over. Triangles always precede the final move in a sequence, so pay attention next time you see one.”

“Once complete, you can count on price to thrust to a new extreme.”

From there, AAPL thrust out of its triangle and soared into the $150 zone. Then, on September 8, Trader’s Classroom revisited Apple to confirm that the stock’s upside was still very much intact.

And, as this final chart shows, AAPL continued to rally right up to Jeffrey’s initial target.

It’s easy to remember the winning shot. But as this exmaple shows, the time to pay closest attention to market action is in the quiet build up long before the triumphant swoosh!

Now you understand why the contracting triangle was included in our “5 Easy-to-Spot Chart Set-ups to Help You Nail Market Reversals, and why Jeffrey Kennedy was the chosen instructor for that video lesson.

In it, Jeffrey leaves no questions about contracting triangles unanswered, including:

  • Where they can occur
  • How to recognize them on a price chart
  • And how to calculate a potential price objective for the thrust following its completion

In turn, each of the five lessons from this free report are in the best possible hands. And so, you too will be.

35-plus minutes. 3 esteemed EWI instructors. 5 game-changing set-ups for every market on every time frame.

Become part of our rapidly growing Club EWI community and get instant access to the complete “5 Easy-to-Spot Chart Set-ups to Help You Nail Market Reversals” report.

What To Look Out For In The Fed Minutes

By Orbex

Last Friday, traders got something of a worrying sign – and then kind of shrugged it off. The yield differential between the 2 year and 10 year US treasury bonds inverted for the first time since the start of the pandemic. This is significant because the yield curve inversion has successfully predicted a recession 10 out of the last 10 times.

That doesn’t mean a recession happens right away. The theory suggests that a recession could happen anywhere from six months to two years from now.

So, there isn’t necessarily any reason to start selling stocks. And it appears that the inversion isn’t likely to deter the Fed’s move to tighten rates.

How big of a deal is it?

The market is pricing in at least a 25 basis point rate hike at the next meeting. But now as many as 3 out of 4 analysts are suggesting the Fed could raise rates by 50 basis points.

A quick look at recent Fed officials’ comments shows that there are hardly any doves left. Yesterday, a noted dove Daly (non-voter) argued that the case for a 50 basis point hike in May has grown. Note that the Fed often uses non-voters as a ‘trial’ to see how the market might react to certain scenarios.

So, if even some of the most dovish members are talking about 50bps, let alone 25, a strong move higher in the rates is possible in the near term. The question is whether it will be all at once at the next meeting in May or some at the meeting in June.

Parsing the numbers

After the last meeting, the FOMC revised the so-called ‘dot plot’ matrix. That is when different members say where they expect interest rates to be. Up until that meeting, the matrix showed an average of three rate hikes for the rest of the year. After the meeting, that was moved up to seven.

From the minutes, we’ll get a better understanding of who voted for what, and what the rationale was for the revised forecasts. Although now that the Fed’s rate outlook is more in line with the market, the minutes are likely to have a smaller effect in terms of interest rates.

What could shake things up a bit is a discussion about the ‘runoff’ or the balance sheet. The Fed bought well over $4.0T in assets during the pandemic and will start the process of selling them back to the market. In turn, that would withdraw liquidity and help reverse some of the effects that the monetary expansion had on inflation.

The ‘recession trade’

If there is talk of a more aggressive shrinking of the balance sheet, that could have a bigger impact on stocks. That’s because the funds from the asset purchases, for the most part, supply liquidity to the market. That might mean investors would switch to stocks that have lower valuations with less debt. And these will be more resilient in the case of a downturn.

Generally, more rate hikes would translate into a stronger dollar. But a bigger runoff of assets by the Fed could depress the US stock market.

Trading the news requires access to extensive market research – and that’s what we do best. Open your Orbex account now.


Orbex-LogoArticle by Orbex

Orbex is a fully licensed broker that was established in 2011. Founded with a mission to serve its traders responsibly and provides traders with access to the world’s largest and most liquid financial markets. www.orbex.com

Ichimoku Cloud Analysis 05.04.2022 (EURUSD, NZDUSD, USDCHF)

Article By RoboForex.com

EURUSD, “Euro vs US Dollar”

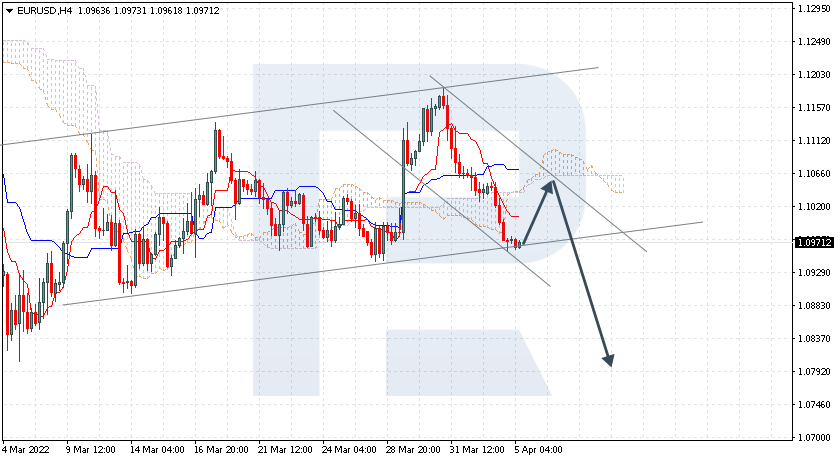
EURUSD is rebounding from the rising channel’s downside border at 1.0971; the instrument is moving below Ichimoku Cloud, thus indicating a descending tendency. The markets could indicate that the price may test the cloud’s downside border at 1.1055 and then resume moving downwards to reach 1.0780. Another signal in favour of a further downtrend will be a rebound from the descending channel’s upside border. However, the bearish scenario may no longer be valid if the price breaks the cloud’s upside border and fixes above 1.1120. In this case, the pair may continue growing towards 1.1205. To confirm further decline, the asset must break the rising channel’s downside border and fix below 1.0930.

EURUSD
Risk Warning: the result of previous trading operations do not guarantee the same results in the future

NZDUSD, “New Zealand Dollar vs US Dollar”

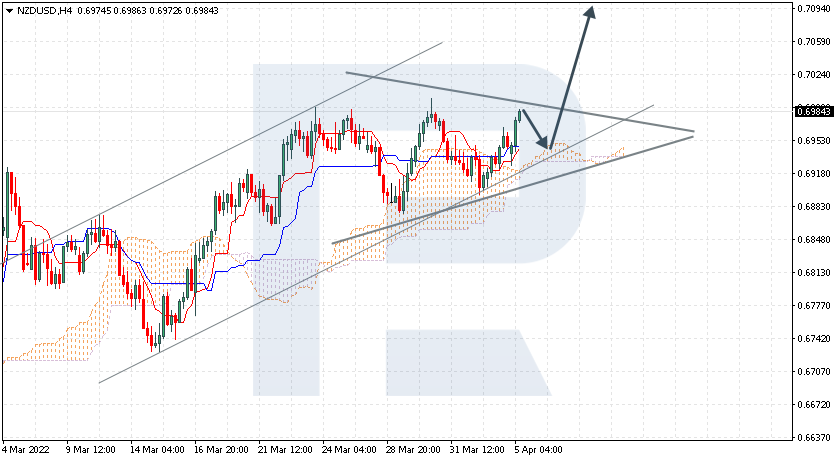
NZDUSD is testing the resistance level at 0.6939 for the third time; the instrument is moving above Ichimoku Cloud, thus indicating an ascending tendency. The markets could indicate that the price may test the cloud’s upside border at 0.6955 and then resume moving upwards to reach 0.7095. Another signal in favour of a further uptrend will be a rebound from the rising channel’s downside border. However, the bullish scenario may no longer be valid if the price breaks the cloud’s downside border and fixes below 0.6865. In this case, the pair may continue falling towards 0.6775. To confirm further growth, the asset must break the upside border of the Triangle pattern and fix above 0.6995.

NZDUSD
Risk Warning: the result of previous trading operations do not guarantee the same results in the future

USDCHF, “US Dollar vs Swiss Franc”

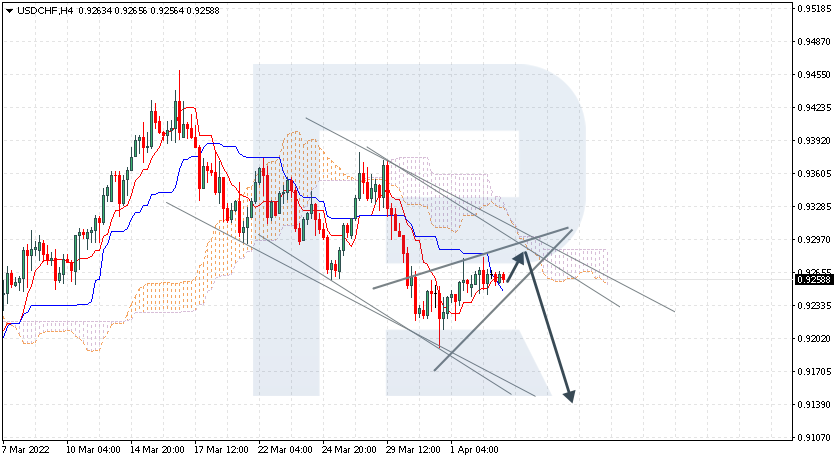
USDCHF is testing Tenkan-Sen and Kijun-Sen at 0.9258; the instrument is moving below Ichimoku Cloud, thus indicating a descending tendency. The markets could indicate that the price may test the cloud’s downside border at 0.9275 and then resume moving downwards to reach 0.9140. Another signal in favour of a further downtrend will be a rebound from the descending channel’s upside border. However, the bearish scenario may no longer be valid if the price breaks the cloud’s upside border and fixes above 0.9335. In this case, the pair may continue growing towards 0.9425. To confirm further growth, the asset must break the downside border of the Wedge pattern and fix below 0.9230.

USDCHF

Article By RoboForex.com

Attention!
Forecasts presented in this section only reflect the author’s private opinion and should not be considered as guidance for trading. RoboForex LP bears no responsibility for trading results based on trading recommendations described in these analytical reviews.