
By Orbex
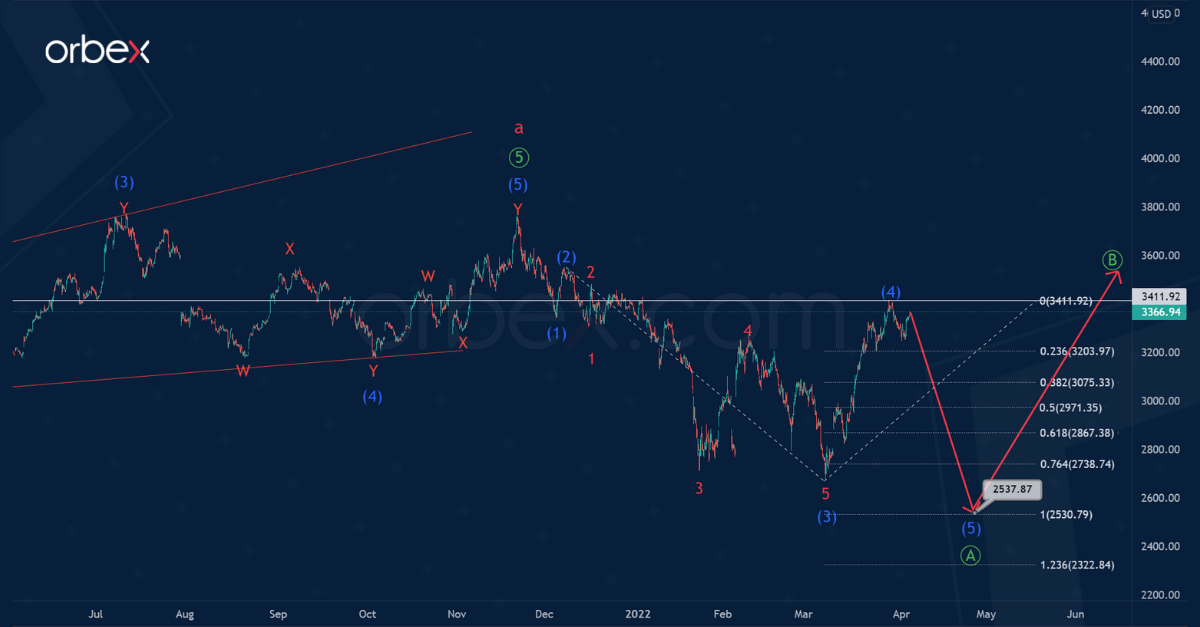
The current AMZN structure suggests the construction of a simple zigzag consisting of sub-waves a-b-c of the cycle degree.
The first major wave a, which includes primary sub-waves ①-②-③-④-⑤, has ended. In the last section of the chart, there is a decrease in the price, which could indicate the beginning of the construction of a bearish correction b. This correction could take the standard zigzag shape Ⓐ-Ⓑ-Ⓒ.
In the near future, there could be a decrease in the final intermediate wave (5), which can end the primary impulse wave Ⓐ near 2537.87. At that level, wave (5) will be equal to the previous impulse (3).
After the primary impulse wave Ⓐ ends, the stock price will begin to rise in correction Ⓑ, as shown on the chart.
Free Reports:
 Download Our Metatrader 4 Indicators – Put Our Free MetaTrader 4 Custom Indicators on your charts when you join our Weekly Newsletter
 Get our Weekly Commitment of Traders Reports - See where the biggest traders (Hedge Funds and Commercial Hedgers) are positioned in the futures markets on a weekly basis.
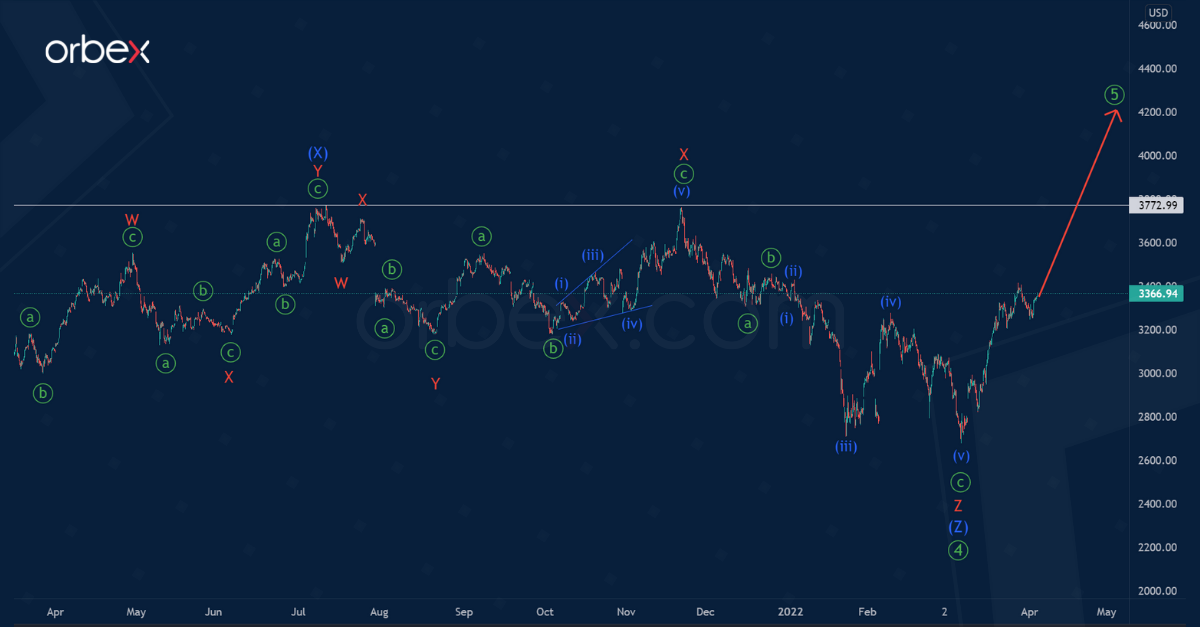
Alternatively, the cycle impulse wave a could still be in the formation stage. Perhaps the construction of the primary correction ④ has recently ended.
On the current chart, we see the final part of this correction. It took the form of an intermediate triple (W)-(X)-(Y)-(X)-(Z) zigzag.
The market will start moving upwards within the final wave ⑤ of the primary degree.
Most likely, prices will rise in price significantly above the high of 3772.99. This is marked by the minor intervening wave X.
Join our responsible trading community – Open your Orbex account now!
![]() Article by Orbex
Article by Orbex
Orbex is a fully licensed broker that was established in 2011. Founded with a mission to serve its traders responsibly and provides traders with access to the world’s largest and most liquid financial markets. www.orbex.com

- COT Metals Charts: Weekly Speculator Bets led by Copper & Steel Jul 18, 2026
- COT Bonds Charts: Weekly Speculator Bets led by 2-Year, SOFR 3M & 5-Year Bonds Jul 18, 2026
- COT Energy Charts: Weekly Speculator Bets led by Brent Oil & Heating Oil Jul 18, 2026
- COT Soft Commodities Charts: Weekly Speculator Bets led by Wheat, Corn & Soybean Meal Jul 18, 2026
- The Bank of Canada kept its interest rate unchanged. Platinum prices reached a three‑week high Jul 16, 2026
- Stock indices rose after the release of US inflation data. China’s GDP slowed sharply Jul 15, 2026
- GBP/USD Awaits Political News: What Will Happen Next Jul 15, 2026
- USD/JPY Holds at Highs: Pressure Lingers on Yen Jul 14, 2026
- Oil prices jumped 4% amid a new wave of escalation between the US and Iran Jul 13, 2026
- EUR/USD: US Inflation Will Determine Everything Jul 13, 2026