What To Expect Out Of RBA Interest Rate Decision

By Orbex

The AUDUSD has remained relatively flat the last couple of weeks, despite ongoing appreciation in the commodity prices. The Aussie hasn’t been able to capitalize on the general inflation environment despite being a commodity currency. In part, this is due to the outlook for the RBA.

So far, the RBA has loathed raising rates. Part of that can be because of the delayed economic impact of the pandemic, as case numbers shot up at the start of the year.

While other central banks were going to normalize rates, the RBA was faced with the effects of lockdowns. Now, economic measures are lifting, but case numbers are starting to climb again.

Lack of growth support

Typically, the current scenario would encourage carry trading, with the BOJ keeping ultra-low rates. That said, commodity currencies would have higher interest rates. Under such circumstances, the AUD would get a boost. And, in fact, the currency did start inching higher at the start of the year.

If the RBA keeps rates at the record low level of 0.1%, however, there is likely to be little interest in carry trade, which could keep the pair from moving higher.

Nonetheless, things could change in the future.

Inflation has been moving significantly above target. The RBA acknowledges that unemployment has hit a structural level, increasing the risk of a wage-price spiral that could require aggressive intervention in terms of monetary policy.

So, the scene is set for a rate hike, but the consensus is that the RBA won’t pull the trigger at the next meeting.

Why no rate hike?

The latest survey of Australian economists shows that 93% expect the RBA to keep the rate on hold. The very small minority of dissenters expect a “half” rate hike, bringing rates to 0.25%.

Unsurprisingly, the market seems to be siding with the majority and it’s not pricing in a rate hike. This means that the event could be relatively calm, with the focus on what’s coming up next. In turn, this begs the question of why the RBA is unlikely to take action at this meeting?

The answer is in two parts. Firstly, Australia calculates inflation on a quarterly basis, and the RBA is working on inflation from last year. We won’t get the latest inflation data until later in the month. Barring some kind of emergency, the RBA is unlikely to make a move without having the latest data on hand.

When could the hike come?

Secondly, there’s the upcoming general election on May 21st.

Generally, the RBA tries to avoid making significant moves (such as starting a raising cycle) during the campaign period. Unless, of course, there is some kind of emergency. The next meeting is on May 3rd, meaning that if the RBA chooses to wait until after the election, we might not see a rate hike until the June 7th meeting.

At the last meeting, the MPC members agreed that it was too early to be looking at raising rates. They cited core inflation not being “stable” above target. The focus could be on the accompanying statement from the RBA, to see if there is any comment on how “stable” the inflation is. If inflation is “concerning”, it could signal a rate hike in the next couple of meetings.

Test your strategy on how the AUD will fare with Orbex – Open Your Account Now.


Orbex-LogoArticle by Orbex

Orbex is a fully licensed broker that was established in 2011. Founded with a mission to serve its traders responsibly and provides traders with access to the world’s largest and most liquid financial markets. www.orbex.com

Forex Technical Analysis & Forecast for April 2022

Article By RoboForex.com

EURUSD, “Euro vs US Dollar”

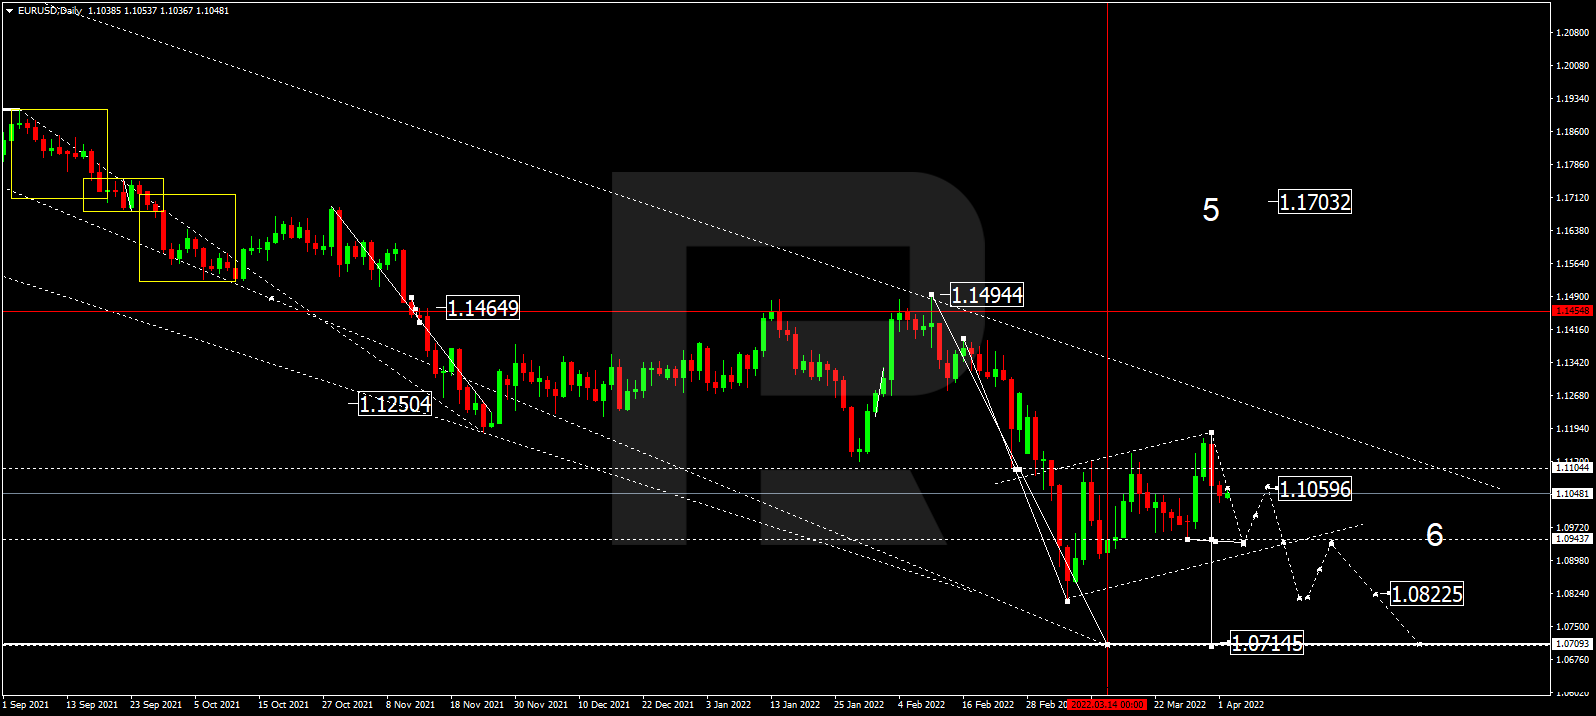
As we can see in the daily chart, having completed the correction at 1.1170, EURUSD is forming another descending wave with the first target at 1.0944 and may later correct towards 1.1060, thus forming a wide consolidation range around 1.0944. If the price breaks this range to the downside, the market may resume falling towards 1.0822 or even extend this wave down to 1.0715; if to the upside – start another growth to reach 1.1200 and then form one more descending structure to return to 1.0944.

EURUSD
Risk Warning: the result of previous trading operations do not guarantee the same results in the future

GBPUSD, “Great Britain Pound vs US Dollar”

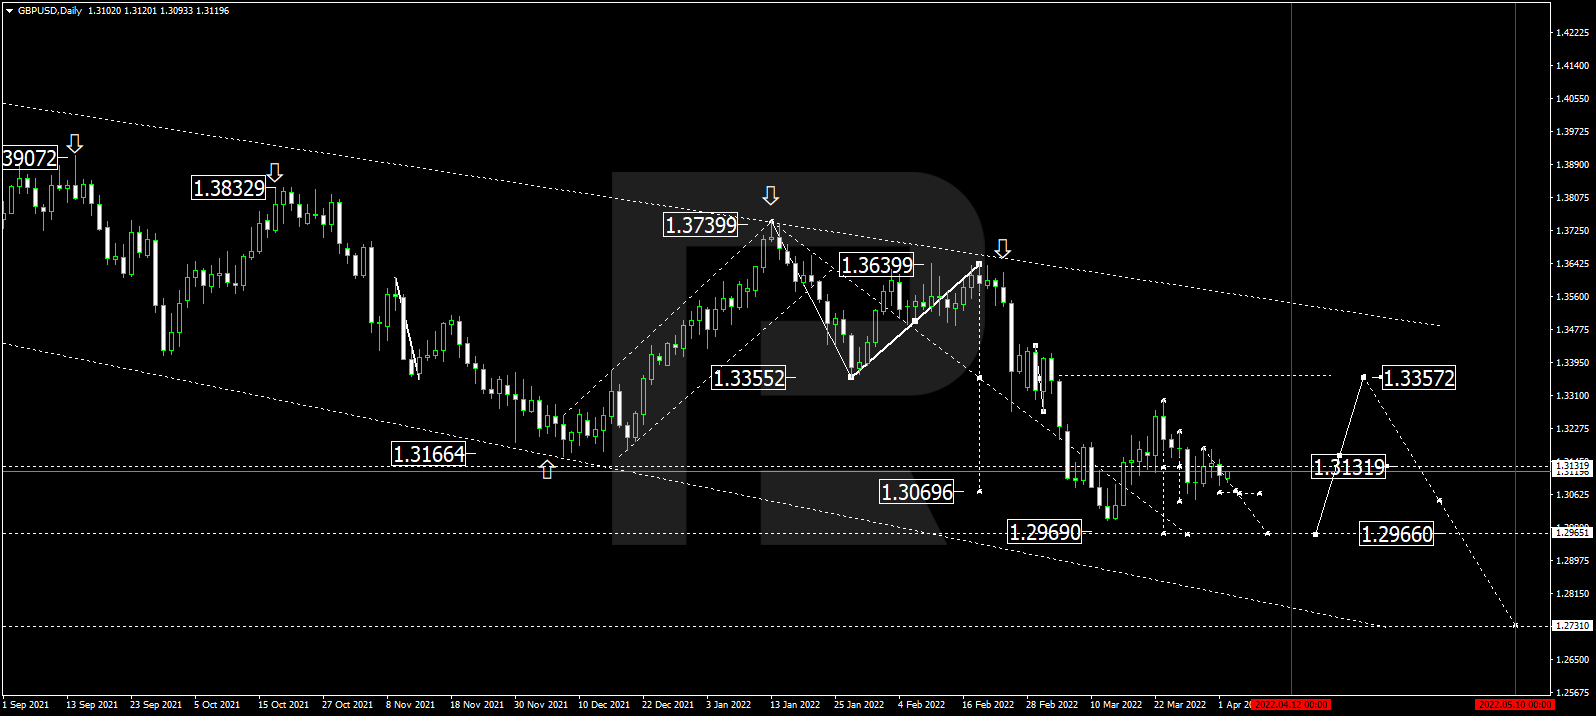
In the daily chart, after finishing the correction at 1.3300, GBPUSD is trading downwards with the target at 1.2966; it has already broken 1.3131. At the moment, the asset is consolidating below the latter level. After reaching the above-mentioned target, the instrument may start another growth towards 1.3355.

GBPUSD
Risk Warning: the result of previous trading operations do not guarantee the same results in the future

USDJPY, “US Dollar vs Japanese Yen”

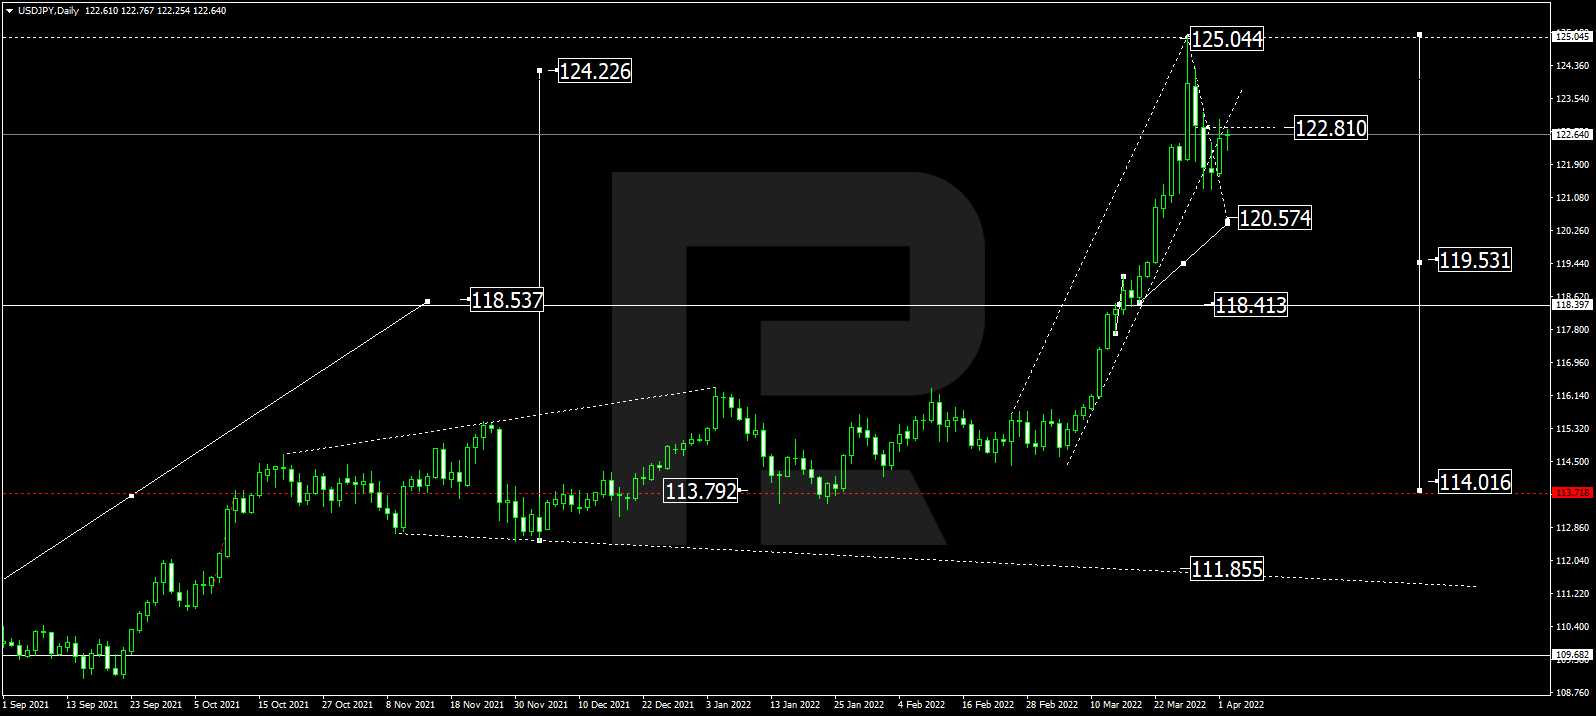
In the daily chart, having finished the ascending wave at 118.41 and formed a new consolidation range around this level, USDJPY has broken it to the upside to extend this structure up to 125.04; right now, it is forming the first structure to the downside with the first target at 120.57. Later, the market may correct to test 122.80 from below and then start a new decline to break 118.40. After that, the instrument may continue trading downwards with the target is at 114.00.

USDJPY
Risk Warning: the result of previous trading operations do not guarantee the same results in the future

BRENT

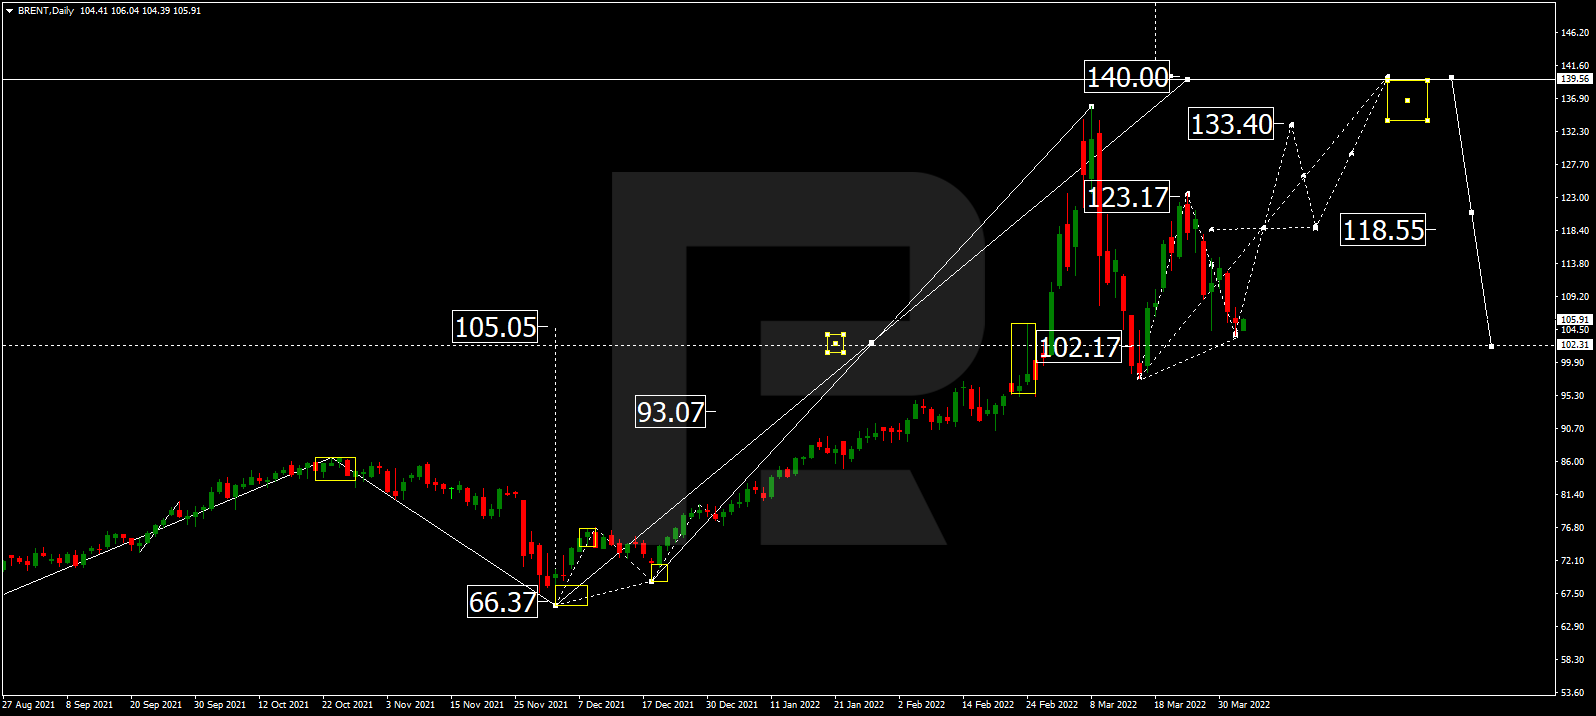
As we can see in the daily chart, Brent has completed the correction at 105.00; right now, it is consolidating around this level. Possibly, the asset may form one more ascending wave to break 118.55 and then continue trading upwards with the short-term target at 133.40. Later, the market may start another correction to return to 118.55 and then resume trading upwards to reach 140.00, at least.

BRENT
Risk Warning: the result of previous trading operations do not guarantee the same results in the future

XAUUSD, “Gold vs US Dollar”

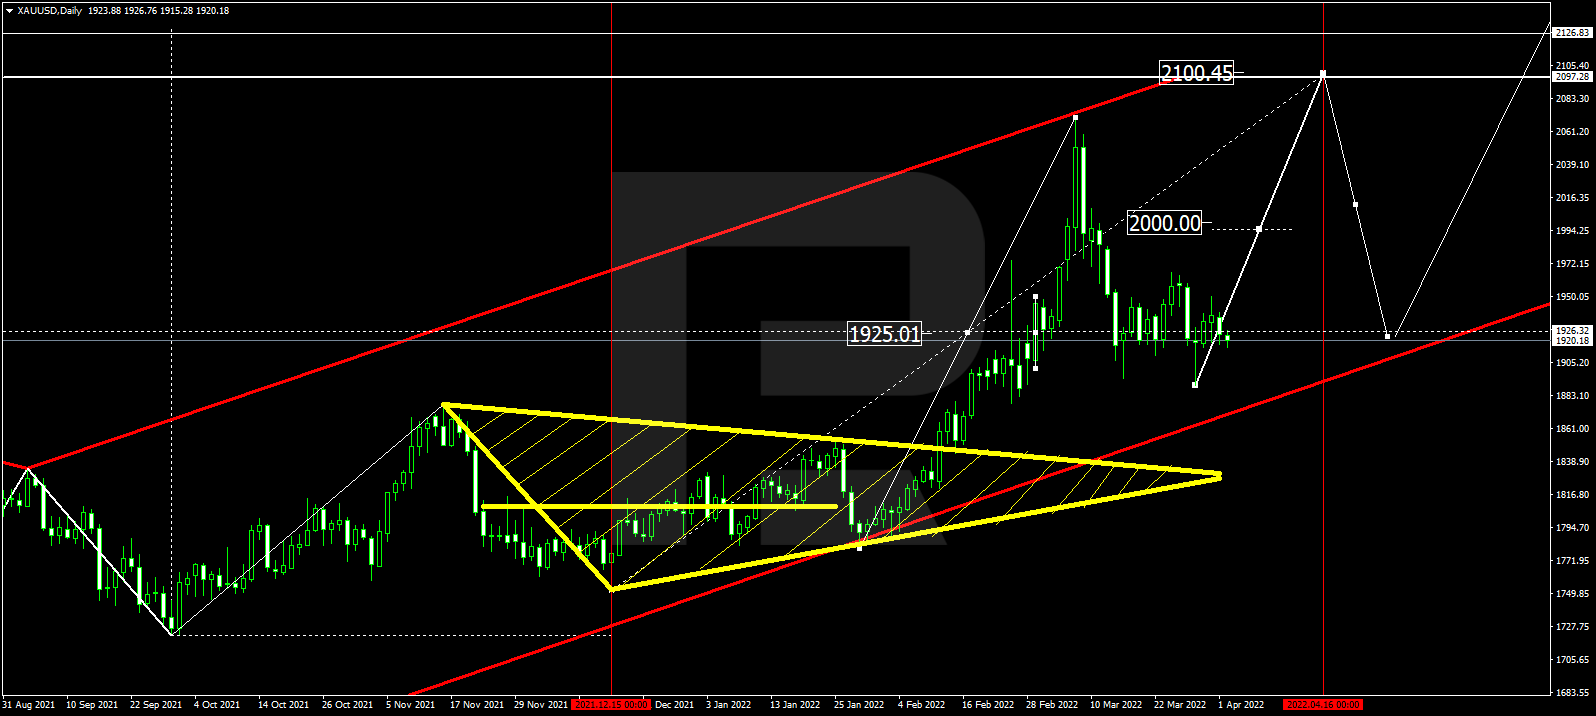
In the daily chart, Gold is still consolidating around 1926.30. The main scenario implies further growth towards 2000.00. After that, the instrument may break this level to the upside and form one more ascending structure with the target at 2100.50.

GOLD
Risk Warning: the result of previous trading operations do not guarantee the same results in the future

S&P 500

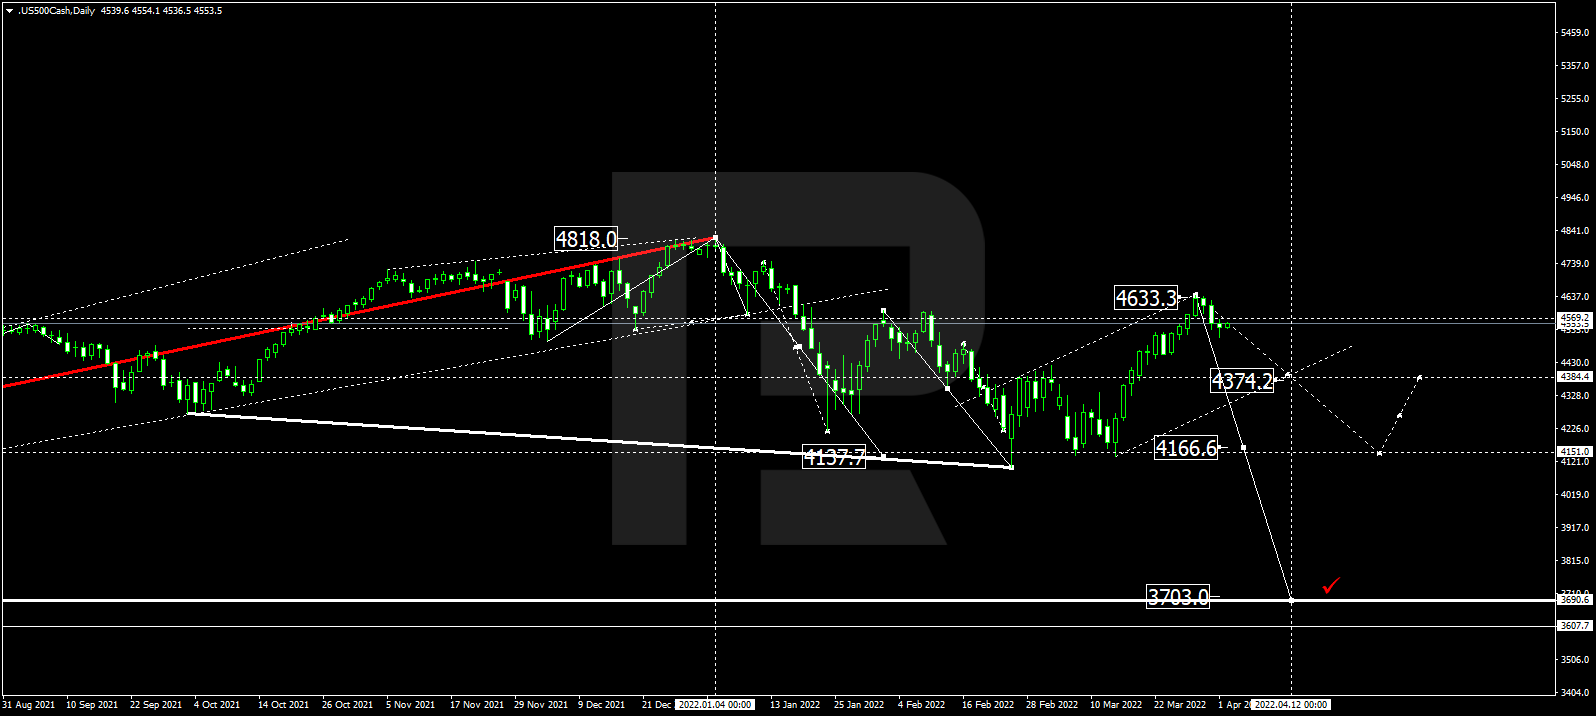
In the daily chart, the S&P index has finished the correctional wave at 4633.3; right now, it is consolidating below this level. Possibly, the asset may form a new descending structure to break 4374.2 and then continue trading downwards with the short-term target at 4166.6.

S&P500

Article By RoboForex.com

Attention!
Forecasts presented in this section only reflect the author’s private opinion and should not be considered as guidance for trading. RoboForex LP bears no responsibility for trading results based on trading recommendations described in these analytical reviews.

Japanese Candlesticks Analysis 04.04.2022 (USDCAD, AUDUSD, USDCHF)

Article By RoboForex.com

USDCAD, “US Dollar vs Canadian Dollar”

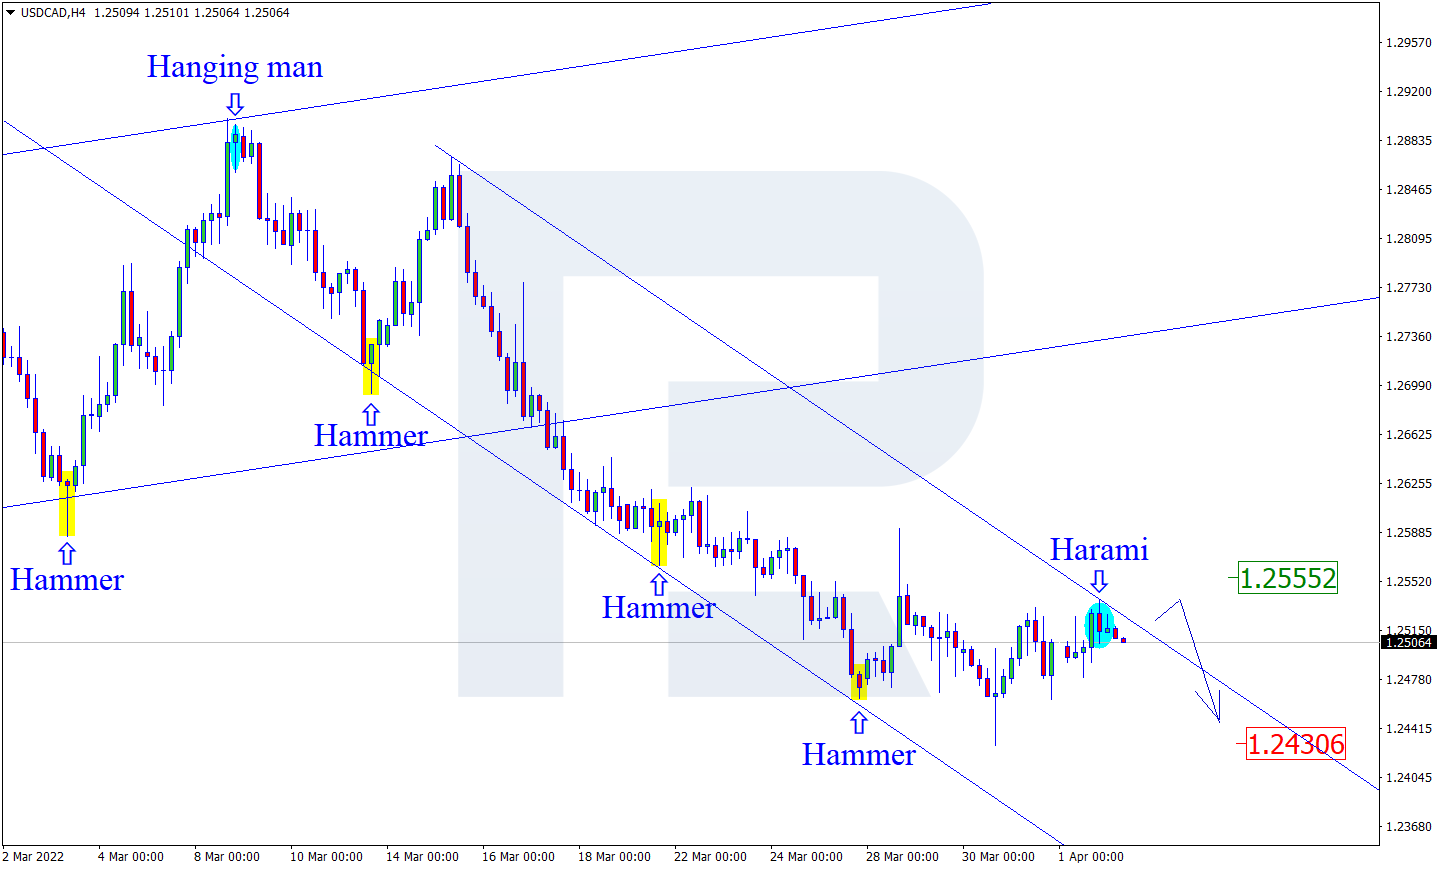
As we can see in the H4 chart, after forming a Harami reversal pattern close to the resistance level, USDCAD is reversing in the form of a new descending impulse. In this case, the downside target may be at 1.2430. However, an alternative scenario implies that the asset may correct to rebound from the resistance level at 1.2555 and then resume the downtrend.

USDCAD
Risk Warning: the result of previous trading operations do not guarantee the same results in the future

AUDUSD, “Australian Dollar vs US Dollar”

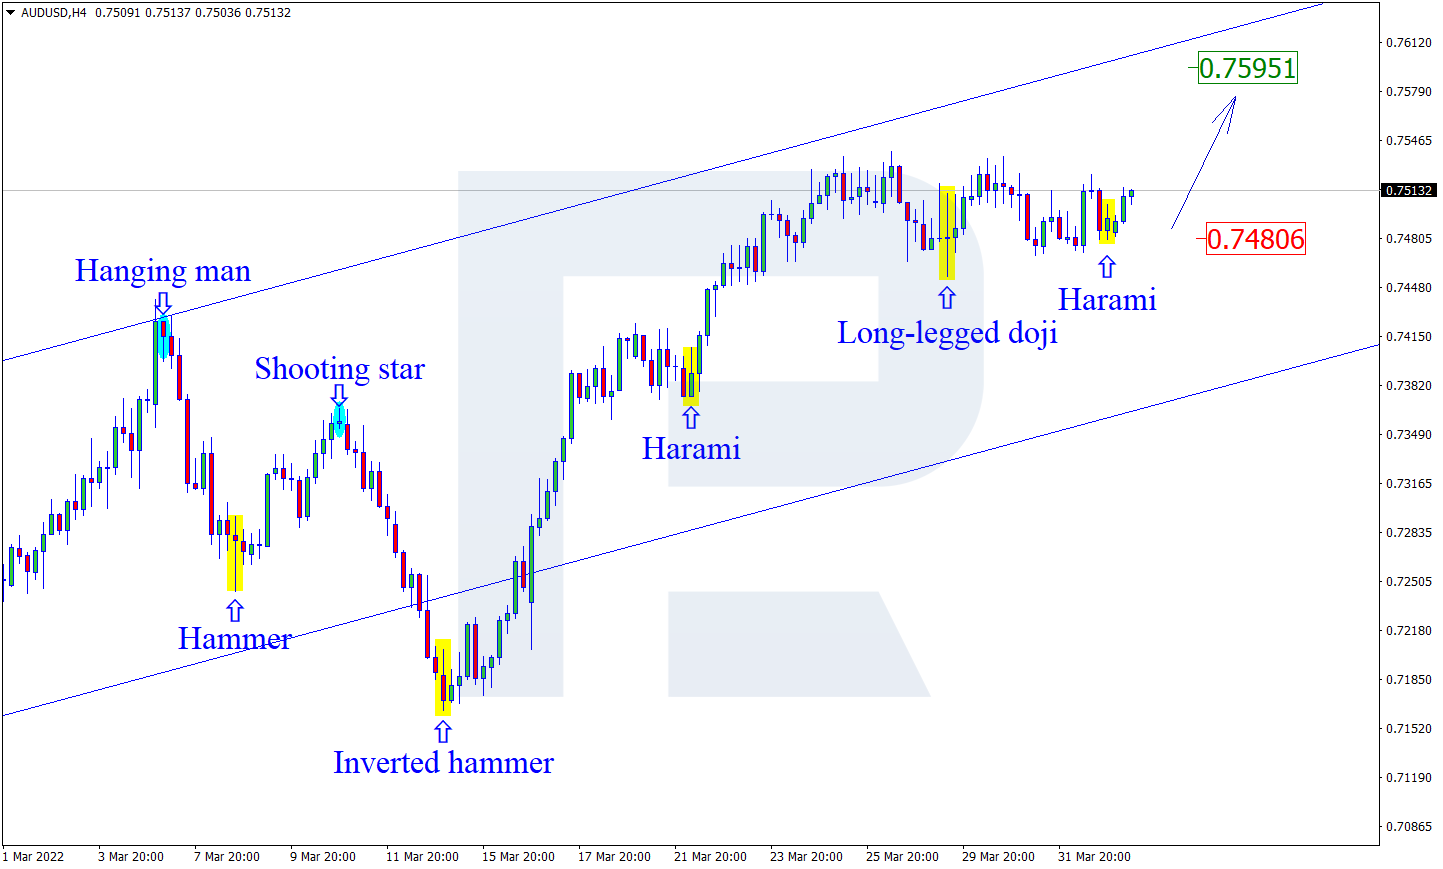
As we can see in the H4 chart, during the pullback, AUDUSD has formed a Harami reversal pattern near the support area. At the moment, the asset is reversing and starting a new rising impulse. In this case, the upside target may be the resistance level at 0.7595. After testing the level, the price may break it and continue the ascending impulse. At the same time, an opposite scenario implies that the price may correct to reach 0.7480 before resuming the uptrend.

AUDUSD
Risk Warning: the result of previous trading operations do not guarantee the same results in the future

USDCHF, “US Dollar vs Swiss Franc”

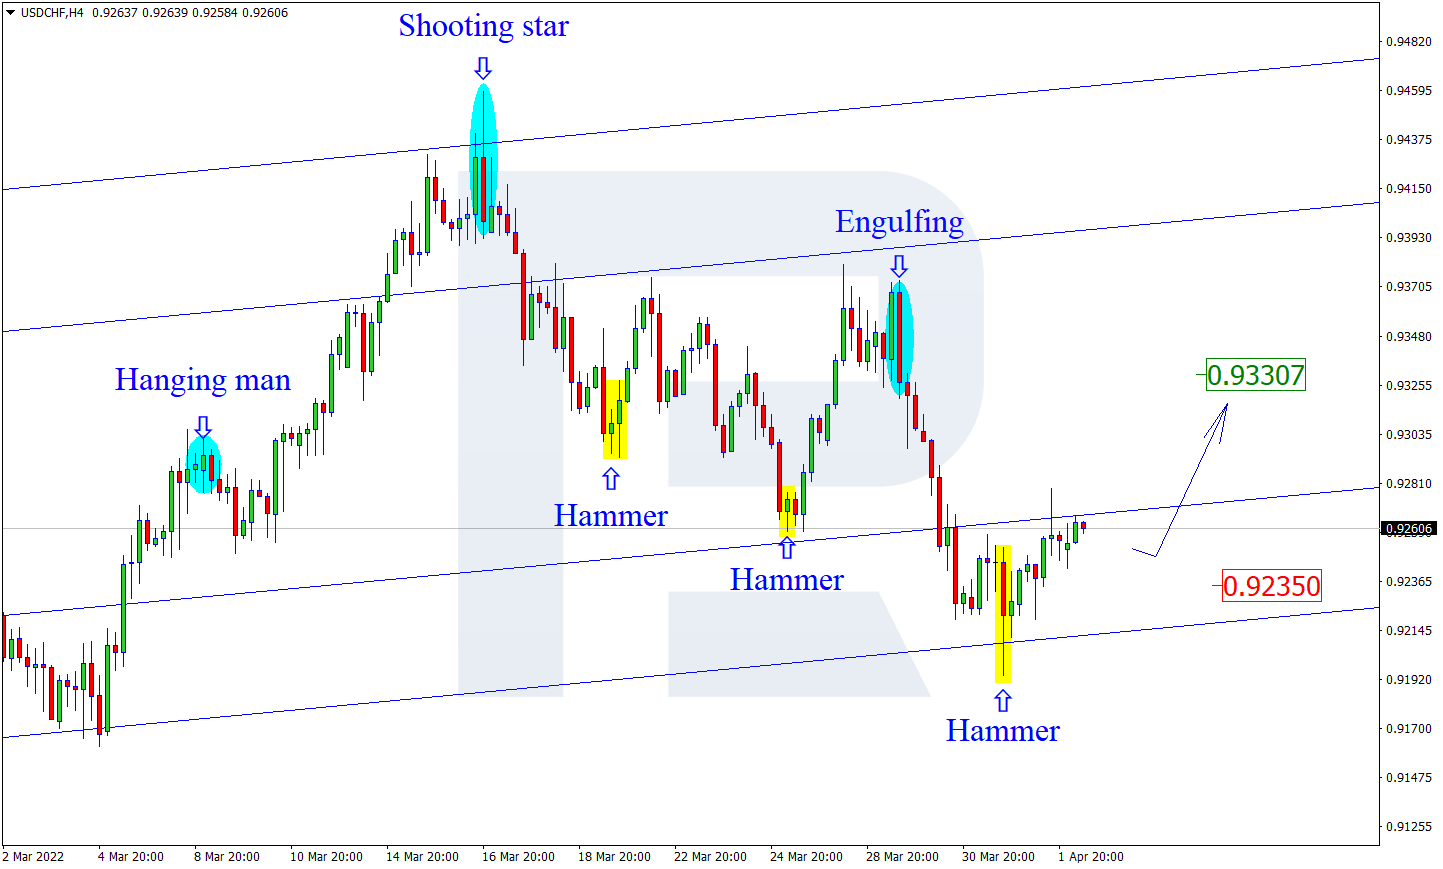
As we can see in the H4 chart, after testing the support area, the pair has formed a Hammer pattern. At the moment, USDCHF is reversing in the form of a new ascending impulse. In this case, the upside target may be at 0.9330. After testing the resistance level, the price may break it and continue trading upwards. Still, there might be an alternative scenario, according to which the asset may correct to reach 0.9235 first and then resume the ascending tendency.

USDCHF

Article By RoboForex.com

Attention!
Forecasts presented in this section only reflect the author’s private opinion and should not be considered as guidance for trading. RoboForex LP bears no responsibility for trading results based on trading recommendations described in these analytical reviews.

USDCHF Double Zigzag To Complete Wave X

By Orbex

USDCHF

The structure of the USDCHF pair suggests that the cycle wave y has ended. This was followed by the cycle intervening wave x.

The intervening wave x takes the form of a primary double zigzag Ⓦ-Ⓧ-Ⓨ. Currently, there is a decrease in the price in the final wave Ⓨ. This takes the form of an intermediate double (W)-(X)-(Y) zigzag.

In the near future, the price could continue to move in the intermediate wave (Y) to the level of 0.913. At that level, wave x will be at 61.8% of wave y.

After the end of wave x, bulls can enter the market by starting to build the actionary wave z.

USDCHF

According to an alternative scenario, the formation of the cycle intervening wave x is fully complete. Now we are seeing a price increase and the development of a cycle wave z. Perhaps it takes the form of a primary double Ⓐ-Ⓑ-Ⓒ zigzag.

Wave Ⓐ will take the form of a simple impulse and will end at the level of 0.946. This is where the actionary cycle wave y ended.

Then, after a slight correction, prices are likely to move higher in the impulse wave Ⓒ.

Join our responsible trading community – Open your Orbex account now!


Orbex-LogoArticle by Orbex

Orbex is a fully licensed broker that was established in 2011. Founded with a mission to serve its traders responsibly and provides traders with access to the world’s largest and most liquid financial markets. www.orbex.com

The Analytical Overview of the Main Currency Pairs on 2022.04.04

by JustForex

The EUR/USD currency pair

Technical indicators of the currency pair:
  • Prev Open: 1.1063
  • Prev Close: 1.1048
  • % chg. over the last day: -0.14%

On Friday, non-farm payrolls data showed that the number of jobs in the US increased by 431,000 in March from an expected 490,000. The US unemployment rate fell to 3.6% in March from 3.8%. The inflation rate in the Eurozone jumped sharply from 5.9% to 7.5% year on year. This surge in inflation has increased the likelihood that the ECB will soon announce the end of its quantitative easing program.

Trading recommendations
  • Support levels: 1.1037, 1.1017, 1.0963, 1.0917, 1.0887, 1.0823, 1.0633
  • Resistance levels: 1.1149, 1.1196, 1.1291

From the technical point of view, the trend on the EUR/USD currency pair on the hourly time frame is bullish. At the moment, the price has corrected and is trading between the moving averages. The MACD indicator is in the negative zone. There are signs of divergence. Under such market conditions, it is better to look for buy trades on intraday timeframes from the support level of 1.1017. Sell trades should be considered from the resistance level of 1.1149, but only after the additional confirmation.

Alternative scenario: if the price breaks down through the 1.1017 support level and fixes below, the uptrend will likely be broken.

EUR/USD
There is no news feed for today.

The GBP/USD currency pair

Technical indicators of the currency pair:
  • Prev Open: 1.3134
  • Prev Close: 1.3114
  • % chg. over the last day: -0.15%

The UK manufacturing activity index remains above 50, which is a positive signal. The UK agrees to join the US in releasing strategic oil reserves. This may soon lead to lower oil prices, which will be negative for the GBP due to the high correlation with Brent oil. Today, investors should pay close attention to the speech of the Governor of the Bank of England, Andrew Bailey. The UK has suspended interest rate hikes, but rising consumer prices may force politicians to reconsider their decision.

Trading recommendations
  • Support levels: 1.3074, 1.3015, 1.2989, 1.2863
  • Resistance levels: 1.3130, 1.3161, 1.3244, 1.3274

On the hourly time frame, the GBP/USD currency pair trend is bullish. The price movement pattern is beginning to show a flat structure. The MACD indicator became inactive. Under such market conditions, buy trades should be considered from the support level of 1.3074, but better with confirmation. Sell deals should be considered from the resistance level of 1.3130 or 1.3161, but only with short targets.

Alternative scenario: if the price breaks down through the 1.3074 support level and fixes below, the mid-term uptrend will likely be broken.

GBP/USD
News feed for 2022.04.04:
  • – UK BoE Gov Bailey’s Speech at 12:05 (GMT+3).

The USD/JPY currency pair

Technical indicators of the currency pair:
  • Prev Open: 121.84
  • Prev Close: 121.69
  • % chg. over the last day: +0.73%

The fundamental picture for the Japanese Yen remains unchanged. The monetary policy of the Bank of Japan is now “ultra-soft” and aims to decrease the national currency rate (USD/JPY growth). Due to the central bank of Japan’s work in the debt market, the Japanese yen temporarily strengthened at the end of last week. However, the mid-term outlook remains unchanged – analysts see a continuation of the uptrend, as the monetary policy of the US and Japanese central banks is now opposed.

Trading recommendations
  • Support levels: 121.83, 120.88, 119.52, 117.72
  • Resistance levels: 123.44,125.22

The medium-term trend on the USD/JPY currency pair is bullish. The price corrected to the moving averages. The MACD indicator has become positive. Under such market conditions, it is best to look for buy deals, expecting the continuation of the uptrend. First of all, it is worth considering the support level of 121.83, but with additional confirmation. A resistance level of 123.44 may be considered for sell deals, but only after the sellers’ initiative.

Alternative scenario: If the price fixes below 119.52, the uptrend will likely be broken.

USD/JPY
There is no news feed for today.

The USD/CAD currency pair

Technical indicators of the currency pair:
  • Prev Open: 1.2479
  • Prev Close: 1.2505
  • % chg. over the last day: +0.11%

The Canadian dollar is a commodity currency and is highly dependent on the movement of oil prices and the dollar index. The situation in the energy market is difficult now. On the one hand, due to Russia’s invasion of Ukraine, there is a shortage of energy resources on the market, especially in Europe. On the other hand, the US and its partners are ready to release strategic reserves to stop rising oil prices. As a result, volatility in oil quotes is now higher. Oil lost more than 10% last week. Falling oil prices will hurt the Canadian dollar. On the other hand, the Bank of Canada is publishing its business activity review today. Positive data may increase expectations of a half a percent rate hike, which is favorable to the Canadian dollar.

Trading recommendations
  • Support levels: 1.2491, 1.2453
  • Resistance levels: 1.2563, 1.2655, 1.2713, 1.2754, 1.2851

In terms of technical analysis, the USD/CAD currency pair trend is bearish. The MACD indicator has become inactive. Trade only with short targets, since on the USD/CAD currency pair fundamentally, there are no prerequisites for the medium-term trend, as the dollar index in the medium term also has the support of the Fed. Under such market conditions, it is better to look for buy trades on the lower timeframes from the support level of 1.2491, but it is better with additional confirmation. For sell deals, it is better to consider the resistance level of 1.2563.

Alternative scenario: if the price breaks through and consolidates above 1.2654, the downtrend will likely be broken.

USD/CAD
News feed for 2022.04.04:
  • – Canada BoC Business Outlook Survey at 17:30 (GMT+3).

by JustForex


This article reflects a personal opinion and should not be interpreted as an investment advice, and/or offer, and/or a persistent request for carrying out financial transactions, and/or a guarantee, and/or a forecast of future events.

Intraday Market Analysis – USD Attempts To Rebound

By Orbex

EURUSD seeks support

EURUSD

The US dollar rallied after March’s average hourly wages jumped by 5.6%. The euro came to a halt in the supply zone at the origin of the March sell-off (1.1180).

A bearish RSI divergence pointed to softness in the rebound. A fall below 1.1120 then 1.1070 prompted buyers to bail out, further weighing on overall sentiment.

1.0980 at the base of the recent bullish impetus is major support. Its breach could invalidate the recovery and trigger a new round of sell-offs. The bulls need to clear 1.1120 to regain the upper hand.

XAUUSD builds support

XAUUSD

Gold retreats as the US dollar finds support from a fall in the jobless rate.

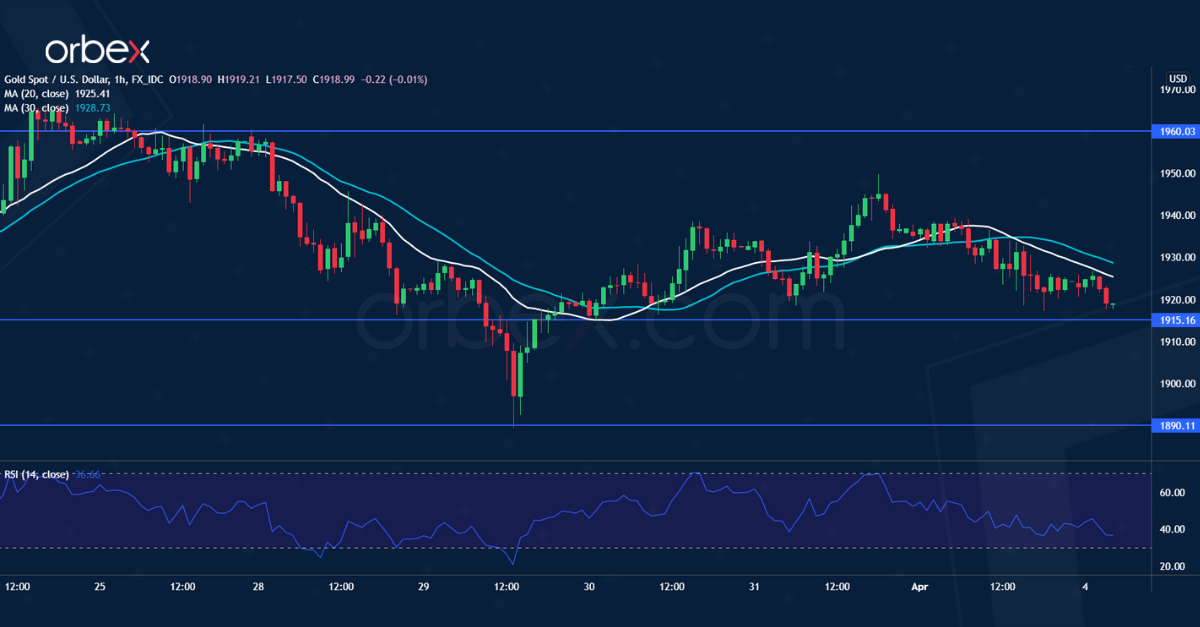
On the daily chart, price action still holds above the demand zone between 1890 and 1900 which is a sign of strong buying interest. A break above 1940 forced sellers out. This may also foreshadow a reversal.

Sentiment would improve if the precious metal stays above 1915. A bullish close above 1960 could extend the rally to the psychological level of 2000. On the downside, 1890 is a critical level to maintain the bulls’ optimism.

UK 100 consolidates gains

UK 100

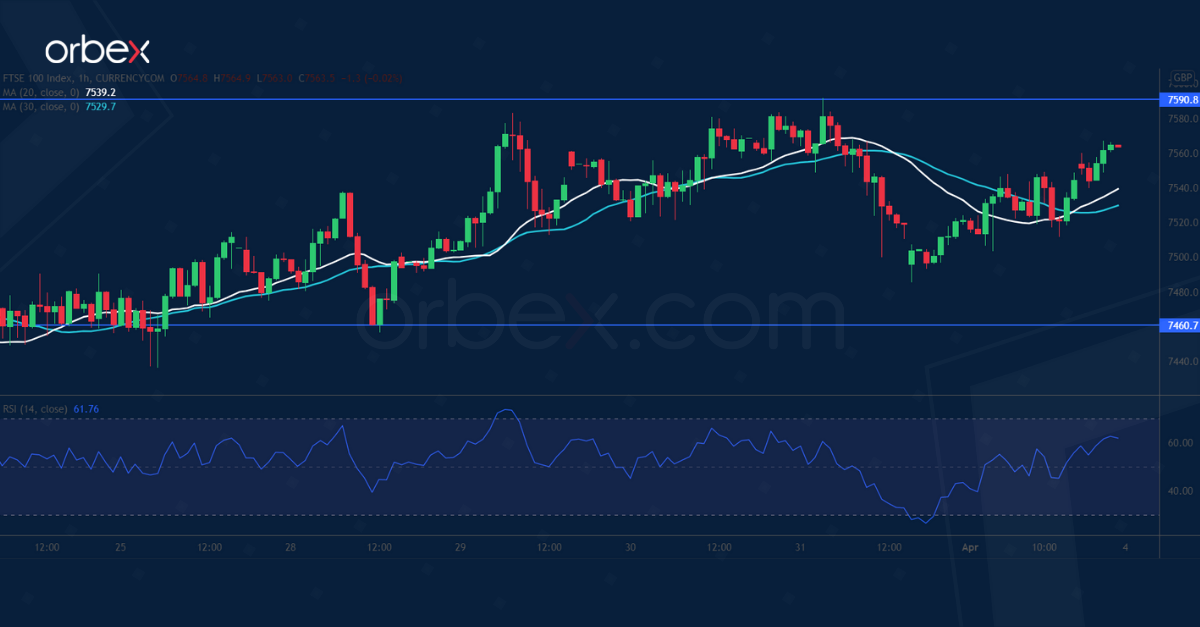
The FTSE 100 treads water dragged by weaker energy stocks. A bullish MA cross on the daily chart suggests that the index could be back on track in the medium term.

The intraday direction is still up despite its choppiness. A close above 7590 would extend the rally to this year’s high at 7690. Trend followers may see pullbacks as a bargain opportunity.

The RSI’s oversold condition attracted some buying interest over 7460. A deeper correction would send the index to 7380 which coincides with the moving averages.


Orbex-LogoArticle by Orbex

Orbex is a fully licensed broker that was established in 2011. Founded with a mission to serve its traders responsibly and provides traders with access to the world’s largest and most liquid financial markets. www.orbex.com
Uncertainty in the energy market is growing. Shocking atrocities of Russian soldiers in Bucha, Ukraine. Inflation is rising in E

by JustForex

Last week, investors’ attention was focused on European inflation data, US labor market data, geopolitics, and the OPEC+ meeting. On Friday, non-farm payrolls showed that the number of jobs in the US increased by 431,000 in March, while a rise of 490,000 was expected. US unemployment rate fell to 3.6% in March from 3.8%. The strong labor market scenario mentioned by Fed Chairman Mr. Powell has been fully implemented. Accordingly, the Fed has more room to raise rates quickly to catch up with the yield curve. At the moment, analysts see a 75.5% chance of a double rate hike (50bp) at the May 4 meeting.

“The Federal Reserve needs to move monetary policy towards a more neutral stance, but the pace at which it tightens credit will depend on how the economy reacts,” New York Fed President John Williams said on Saturday. The average neutral rate rating by policymakers is 2.4%. Currently, traders believe the Fed will achieve this by the end of this year. That rate will require a 0.5% increase at two of the remaining six Fed meetings this year, and the first is expected to take place at the May 4 Fed meeting.

The US stock market traded without a single dynamic last week. By the close of the stock market on Friday, the Dow Jones index (US30) increased by 0.40% (-0.04% for the week), the S&P 500 index (US500) added 0.34% (+0.11% for the week), and the NASDAQ Technology Index (US100) gained 0.29% on Friday (+0.59% for the week).

According to FlightAware, a data tracking site, more than 6,041 flights were delayed, and 1,933 flights were canceled on Saturday due to a major storm in Florida, USA. JetBlue Airways (25%), Spirit Airlines (23%), Southwest Airlines (10%), American Airlines (7%), and EasyJet (7%) had the most flight cancellations.

Major European indices were trading higher on Friday. German DAX (DE30) gained 0.22% on Friday (+0.49% for the week), French CAC 40 (FR40) gained 0.37% (+1.61% for the week), Spanish IBEX 35 (ES35) added 0.69% (+1.76% for the week), British FTSE 100 (UK100) jumped by 0.30% (+0.73% for the week). The inflation rate in the Eurozone rose sharply from 5.9% to 7.5% year on year. This surge in inflation has increased the likelihood that the ECB will soon announce the end of its quantitative easing program.

The UK agrees to join the US in releasing strategic oil reserves. The situation in the energy market is difficult now. On the one hand, due to Russia’s invasion of Ukraine, there is a shortage of energy resources on the market, especially in Europe. On the other hand, the US and its partners are ready to release strategic reserves to curb rising oil prices. As a result, oil prices volatility is now extremely high. Oil lost more than 10% last week.

The situation in the gas market is also very difficult. On the one hand, Russia wants Europe to pay for Russian gas in rubles. On the other hand, last week, the United States announced that it would work to supply 15 billion cubic meters of LNG to the European Union this year. US natural gas exporters have already benefited from the supply crisis in Europe and Norway. Many European countries (UK, France, Germany, Austria) refuse to pay for gas in rubles. Russia cannot cut off gas to European countries because it would violate previously signed supply contracts. In addition, it should be noted that more than 80% of Russia’s revenue comes from the sale of oil and gas. Therefore, the cessation of supplies to Europe will significantly reduce its revenues. It would be like shooting yourself in the foot. Lithuania has become the first EU country to no longer import natural gas from Russia.

Due to Russia’s aggression against Ukraine and threats against Europe, Finland and Sweden are considering joining NATO under an accelerated procedure.

Asian markets traded flat last week. Japan’s Nikkei 225 (JP225) decreased by 1.49% over the week, Hong Kong’s Hang Seng (HK50) gained 2.88% over the week, and Australia’s S&P/ASX 200 (AU200) closed with +1.18% over the week.

The EU has warned China against helping Russia circumvent sanctions. The EU will remain vigilant about any attempt to help Russia circumvent sanctions imposed on its invasion of Ukraine. EU leaders also said that Brussels would welcome China’s positive steps to end the war between Russia and Ukraine. For its part, China has promised the European Union that it would seek peace in Ukraine, but “on its terms.” Beijing has shied away from pressuring the country to take a tougher stance on Russia.

The war in Ukraine continues. This weekend, the Ukrainian armed forces managed to regain control of the Kyiv region. But footage from cities such as Bucha and Gostomel was shocking. Hundreds of civilians were killed, tortured and shot, and hundreds of mutilated civilian bodies were on the streets. The Russians shot civilians, raped Ukrainian women, killed dogs, robbed and looted. War crimes in Bucha and other cities during the Russian occupation will be considered by the UN Security Council and The Hague. The Minister for Foreign Affairs of Ukraine, Dmytro Kuleba, called on a mission of the International Criminal Court to come to Bucha and other cities in the Kyiv region to gather evidence.

In the commodities market by the end of the week futures on orange juice (+3.91%), coffee (+2.95%), and natural gas (+1.98) showed the biggest gains at the end of the week. Futures on BRENT oil (-13.18%), WTI oil (-12.71%), wheat (-10.80%), soybeans (-7.57%), palladium (-4.77%), silver (-3.36%), corn (-2.75%) and timber (-2.49%) showed the biggest drop.

Main market quotes:

S&P 500 (F) (US500) 4,545.86 +15.45 (+0.34%)

Dow Jones (US30) 34,818.27 +139.92 (+0.40%)

DAX (DE40) 14,446.48 +31.73 (+0.22%)

FTSE 100 (UK100) 7,537.90 +22.22 (+0.30%)

USD Index 98.57 +0.25 (+0.26%)

Important events for today:
  • – Australia Retail Sales (m/m) at 04:30 (GMT+3);
  • – UK BoE Gov Bailey’s Speech at 12:05 (GMT+3);
  • – Canada BoC Business Outlook Survey at 17:30 (GMT+3).

by JustForex


This article reflects a personal opinion and should not be interpreted as an investment advice, and/or offer, and/or a persistent request for carrying out financial transactions, and/or a guarantee, and/or a forecast of future events.

Biden bets a million barrels a day will drive down soaring gas prices – what you need to know about the Strategic Petroleum Reserve

By Scott L. Montgomery, University of Washington 

The Biden administration on March 31, 2022, said it plans to release an unprecedented 180 million barrels of oil from the U.S. Strategic Petroleum Reserve to combat the recent spike in gas and diesel prices. About a million barrels of oil will be released every day for up to six months.

If all the oil is released, it would represent almost one-third of the current volume of the Strategic Petroleum Reserve. It follows a release of 30 million barrels in early March, a large withdrawal until the latest one.

But what is the Strategic Petroleum Reserve, why was it created, and when has it been used? And does it still serve a purpose, given that the U.S. exports more oil and other petroleum products than it imports?

As an energy researcher, I believe considering the reserve’s history can help answer these questions.

Origins of the reserve

Congress created the Strategic Petroleum Reserve as part of the Energy Policy and Conservation Act of 1975 in response to a global oil crisis.

Arab oil-exporting states led by Saudi Arabia had cut supply to the world market because of Western support for Israel in the 1973 Yom Kippur War. Oil prices quadrupled, resulting in major economic damage to the U.S. and other countries. This also shook the average American, who had grown used to cheap oil.

The oil crisis caused the U.S., Japan and 15 other advanced countries to form the International Energy Agency in 1974 to recommend policies that would forestall such events in the future. One of the agency’s key ideas was to create emergency petroleum reserves that could be drawn on in case of a severe supply disruption.

A map with red dots showing locations of SPR spots.
The map shows the locations of the oil held in the Strategic Petroleum Reserve.
Department of Energy

The Energy Policy and Conservation Act originally stipulated the reserve should hold up to 1 billion barrels of crude and refined petroleum products. Though it has never reached that size, the U.S. reserve is the largest in the world, with a maximum volume of 714 million barrels. The cap was previously set at 727 million barrels.

As of March 25, 2022, the reserve contained about 568 million barrels.

Oil in the reserve is stored underground in a series of large underground salt domes in four locations along the Gulf Coast of Texas and Louisiana, and is linked to major supply pipelines in the region.

Salt domes, formed when a mass of salt is forced upward, are a good choice for storage since salt is impermeable and has low solubility in crude oil. Most of the storage sites were acquired by the federal government in 1977 and became fully operational in the 1980s.

History of drawdowns

In the 1975 act, Congress specified that the reserve was intended to prevent “severe supply interruptions” – that is, actual oil shortages.

Over time, as the oil market has changed, Congress expanded the list of reasons for which the Strategic Petroleum Reserve could be tapped, such as domestic supply interruptions due to extreme weather.

Prior to March 2022, about 280 million barrels of crude oil had been released since the reserve’s creation, including a 50 million release that began in November 2021.

There have only been three emergency releases in the reserve’s history. The first was in 1991 after Iraq invaded Kuwait the year before, which resulted in a sharp drop in oil supply to the world market. The U.S. released 34 million barrels.

The second release, of 30 million barrels, came in 2005 after Hurricanes Rita and Katrina knocked out Gulf of Mexico production, which then comprised about 25% of U.S. domestic supply.

The third was a coordinated release by the International Energy Agency in 2011 as a result of supply disruptions from several oil-producing countries, including Libya, then facing civil unrest during the Arab Spring. In all, the agency coordinated a release of 60 million barrels of crude, half of which came from the U.S.

In addition, there have been 11 planned sales of oil from the reserve, mainly to generate federal revenue. One of these – the 1996-1997 sale to reduce the federal budget deficit – seemed to serve political ends rather than supply-related ones.

A better way to avoid pain at the pump

President Joe Biden’s November decision to tap the reserve was also seen as political by Republicans because there was no emergency shortage of supply at that time.

Similarly, the latest historic release of 180 million barrels could also be seen as serving a political purpose – in an election year, no less. But I believe it also seems perfectly legitimate in terms of fulfilling the Strategic Petroleum Reserve’s original purpose: reducing the negative impacts of a major oil price shock.

Though the U.S. is today a net petroleum exporter, it continues to import as much as 8.2 million barrels of crude oil every day.

But in my view, the best way to avoid the pain of oil price shocks is to lower oil demand by reducing global carbon emissions – rather than mainly relying on releases from the reserve.

This is an updated version of an article originally published on Nov. 24, 2021.The Conversation

About the Author:

Scott L. Montgomery, Lecturer, Jackson School of International Studies, University of Washington

This article is republished from The Conversation under a Creative Commons license. Read the original article.

Millennials, Gen Z want NFTs in investment portfolios: poll

By George Prior 

More than half of millennials and nearly three-quarters of Generation Z are considering including NFTs into their investment portfolios, reveals a new survey.

The findings from a global poll carried out by deVere Group, one of the world’s leading financial advisory, asset management and fintech organisations, show that 52% of those born between 1980 and 1996, and 74% of those born between 1997 and 2012, would welcome the inclusion of Non-Fungible Tokens (NFTs) into their portfolio mix.

More than 600 of the organisation’s clients under the age of 42 were surveyed across Europe, North America, Asia, Africa, Australia and Latin America.

An NFT is a digital asset, such as an image, audio clip or GIF, whose ownership is recorded on a tamper-proof digital ledger known as a blockchain.

This emerging asset class took off in a considerable way last year with a digital-only piece of art selling for $69m. Since then, an increasing number of celebrities, and artists, as well as fashion, music, tech and sports brands have been creating, buying and selling NFTs.

According to deVere CEO and founder Nigel Green: “The findings of this poll underscore that digital natives – those who have grown-up immersed in a fully accessible digital life – understand that unique, highly portable and transferable digital assets have an intrinsic value and that this is a trend that will inevitably grow moving forward.

“They know that how we live, study, work, interact and enjoy downtime is increasingly digitally orientated.  As such, it’s natural to want to take digital representations of fashion brands, music, sport and art into the digital space – and now we can with NFTs.”

He continues: “Clearly, this groundswell of digital engagement is creating new business models across many sectors.

“Sensibly, younger generations – who instinctively better understand it – appreciate that, therefore, it’s going to shape the future of investing.

“They’re keen to have a stakeholding in this new financial ecosystem by including NFTs in their portfolios.

“We expect this could be a sound strategy. Not only because NFTs are likely to be an intrinsic component of the global digital architecture of the future, but also because this hot new asset class can act as a major diversifier in investment portfolios.”

This last reason, says Nigel Green, is arguably the most important for the majority of investors.

“Proper diversification of a portfolio across asset class, sector, region, and currency is the best way an investor can best position themselves to mitigate risks and to seize opportunities when they are presented.

“NFTs have a very low correlation to other assets, such as stocks and bonds, and can, therefore, lower your portfolio’s overall risk and volatility levels.”

As NFTs become increasingly mainstream by those wanting to seriously build wealth for the long-term, earlier this month, deVere Group launched dV Gems, a non-fungible token (NFT) platform that aims to give investors access to an emerging asset class and streamline digital ownership.

At the time of the launch, the CEO noted: “deVere has always been ahead of the trend in financial services. Our new NFT platform is another first.

“Uniquely positioned to help investors see value and opportunity in a digital financial era, dV Gems will provide immediate access to the decade’s hottest emerging asset class – an asset class that will become a standard feature of investment portfolios within a few years.”

Of the findings of the recent poll of clients, Nigel Green concludes: “As the token economy and decentralised technologies develop at pace, the huge investment potential between millennials, Gen Z and NFTs looks ever-more undeniable.

“No longer content to consider only traditional portfolio components, such as stocks and bonds, younger generations are set to own a raft of different digital assets too. And this makes sense in today’s world.”

About:

deVere Group is one of the world’s largest independent advisors of specialist global financial solutions to international, local mass affluent, and high-net-worth clients.  It has a network of more than 70 offices across the world, over 80,000 clients and $12bn under advisement.

Brains are bad at big numbers, making it impossible to grasp what a million COVID-19 deaths really means

By Lindsey Hasak, Stanford University and Elizabeth Y. Toomarian, Stanford University 

As of April 2022, there have been nearly 1 million confirmed COVID-19 deaths in the U.S. For most people, visualizing what a million of anything looks like is an impossible task. The human brain just isn’t built to comprehend such large numbers.

We are two neuroscientists who study the processes of learning and numerical cognition – how people use and understand numbers. While there is still much to discover about the mathematical abilities of the human brain, one thing is certain: People are terrible at processing large numbers.

During the peak of the omicron wave, over 3,000 U.S. residents died per day – a rate faster than in any other large high-income country. A rate of 3,000 deaths per day is already an incomprehensible number; 1 million is unfathomably larger. Modern neuroscience research can shed light on the limitations of the brain in how it deals with large numbers – limitations that have likely factored in to how the American public perceives and responds to COVID-related deaths.

The brain is built to compare, not to count

Humans process numbers using networks of interconnected neurons throughout the brain. Many of these pathways involve the parietal cortex – a region of the brain located just above the ears. It’s responsible for processing all different sorts of quantities or magnitudes, including time, speed and distance, and provides a foundation for other numerical abilities.

While the written symbols and spoken words that humans use to represent numbers are a cultural invention, understanding quantities themselves is not. Humans – as well as many animals including fish, birds and monkeys – show rudimentary numerical abilities shortly after birth. Infants, adults and even rats find it easier to distinguish between relatively small numbers than larger ones. The difference between 2 and 5 is much easier to visualize than the difference between 62 and 65, despite the fact that both number sets differ by only 3.

The brain is optimized to recognize small quantities because smaller numbers are what people tend to interact with most on a daily basis. Research has shown that when presented with different numbers of dots, both children and adults can intuitively and rapidly recognize quantities less than three or four. Beyond that, people have to count, and as the numbers get higher, intuitive understanding is replaced by abstract concepts of large, individual numbers.

This bias toward smaller numbers even plays out day to day in the grocery store. When researchers asked shoppers in a checkout line to estimate the total cost of their purchase, people reliably named a lower price than the actual amount. And this distortion increased with price – the more expensive the groceries were, the larger the gap between the estimated and actual amounts.

Once you get into large numbers like millions and billions, the brain begins to start thinking of these values as categories rather than actual numbers. J Baikoff via Youtube.

Bad at big numbers

Since anything bigger than 5 is too large a quantity to intuitively recognize, it follows that the brain must rely on different methods of thinking when confronted with much bigger numbers.

One prominent theory proposes that the brain relies on an inexact method whereby it represents approximate quantities through a sort of mental number line. This line, imagined in our mind’s eye, organizes small to large numbers from left to right (though this orientation depends on cultural convention). People tend to make consistent errors when using this internal number line, often underestimating extremely large quantities and overestimating relatively smaller quantities. For example, research has shown that college students in geology and biology courses commonly underestimate the time between the appearance of the first life on Earth and the dinosaurs – which is billions of years – but overestimate how long dinosaurs actually lived on Earth – millions of years.

Further research looking at how people estimate the value of large numbers shows that many people place the number 1 million halfway between 1,000 and 1 billion on a number line. In reality, a million is 1,000 times closer to 1,000 than 1 billion. This number line gaffe may visually represent how people people use words like “thousand” and “billion” as category markers that represent “big” and “bigger” rather than distinct values.

When grappling with numbers outside of everyday experience, precise values just mean less.

1,000,000 deaths

Numbers are a useful, clear and efficient way to summarize the harms of the pandemic, but the truth is that the brain simply can’t understand what it means that a million people have died. By abstracting deaths into impossibly large numbers, people fall prey to the limitations of the mind. In doing so, it’s easy to forget that every single numerical increase represents the entire lived experience of another human being.

This pandemic has been full of hard-to-comprehend numbers. The filtration efficiency of various face masks, the accuracy of different COVID-19 tests, statewide case numbers and worldwide death rates are all complicated concepts far beyond the brain’s intuitive number processing abilities. Yet these numbers – and how they are presented – matter immensely.

If the brain were built to understand these kinds of numbers, perhaps we would have made different individual decisions or taken different collective action. Instead, we now mourn for the million people behind the number.The Conversation

About the Author:

Lindsey Hasak, Doctoral Candidate in Developmental and Psychological Sciences, Stanford University and Elizabeth Y. Toomarian, Director, Brainwave Learning Center, Synapse School & Research Associate, Stanford University

This article is republished from The Conversation under a Creative Commons license. Read the original article.