By RoboForex Analytical Department
The EUR/USD pair declined to 1.1642 on Wednesday, with investor attention firmly fixed on the Federal Reserve’s impending policy decision. The central bank is widely expected to cut interest rates by 25 basis points.
Market participants will scrutinise the subsequent commentary from Chair Jerome Powell for any signals regarding the path for further policy easing. A further rate cut in December is already partially priced into the market.
Additional attention is being drawn to the upcoming meeting between Donald Trump and Xi Jinping, at which the parties may approve a framework trade agreement. The document provides for the suspension of new US tariffs and Chinese restrictions on exports of rare earth metals.
Meanwhile, the US dollar continues to weaken against the Japanese yen. This follows discussions between Japanese Finance Minister Satsuki Katayama and US Treasury Secretary Scott Bessent, in which they addressed recent volatility in the currency markets. Bessent’s call for a “prudent monetary policy” was interpreted by investors as a veiled criticism of the slow pace of interest rate normalisation in Japan.
Technical Analysis: EUR/USD
H4 Chart:

On the H4 chart, the EUR/USD pair formed a tight consolidation range around the 1.1600 level. After an upward breakout, the pair completed a correction to 1.1680. With that correction now over, a new decline has begun. The next target for this bearish wave is 1.1540, which is considered only the first leg of the downtrend. Following a minor correction back towards 1.1600, the decline is expected to extend to at least 1.1488. This scenario is technically confirmed by the MACD indicator. Its signal line is above zero but has diverged from the histogram and is pointing decisively downward, indicating sustained bearish momentum.
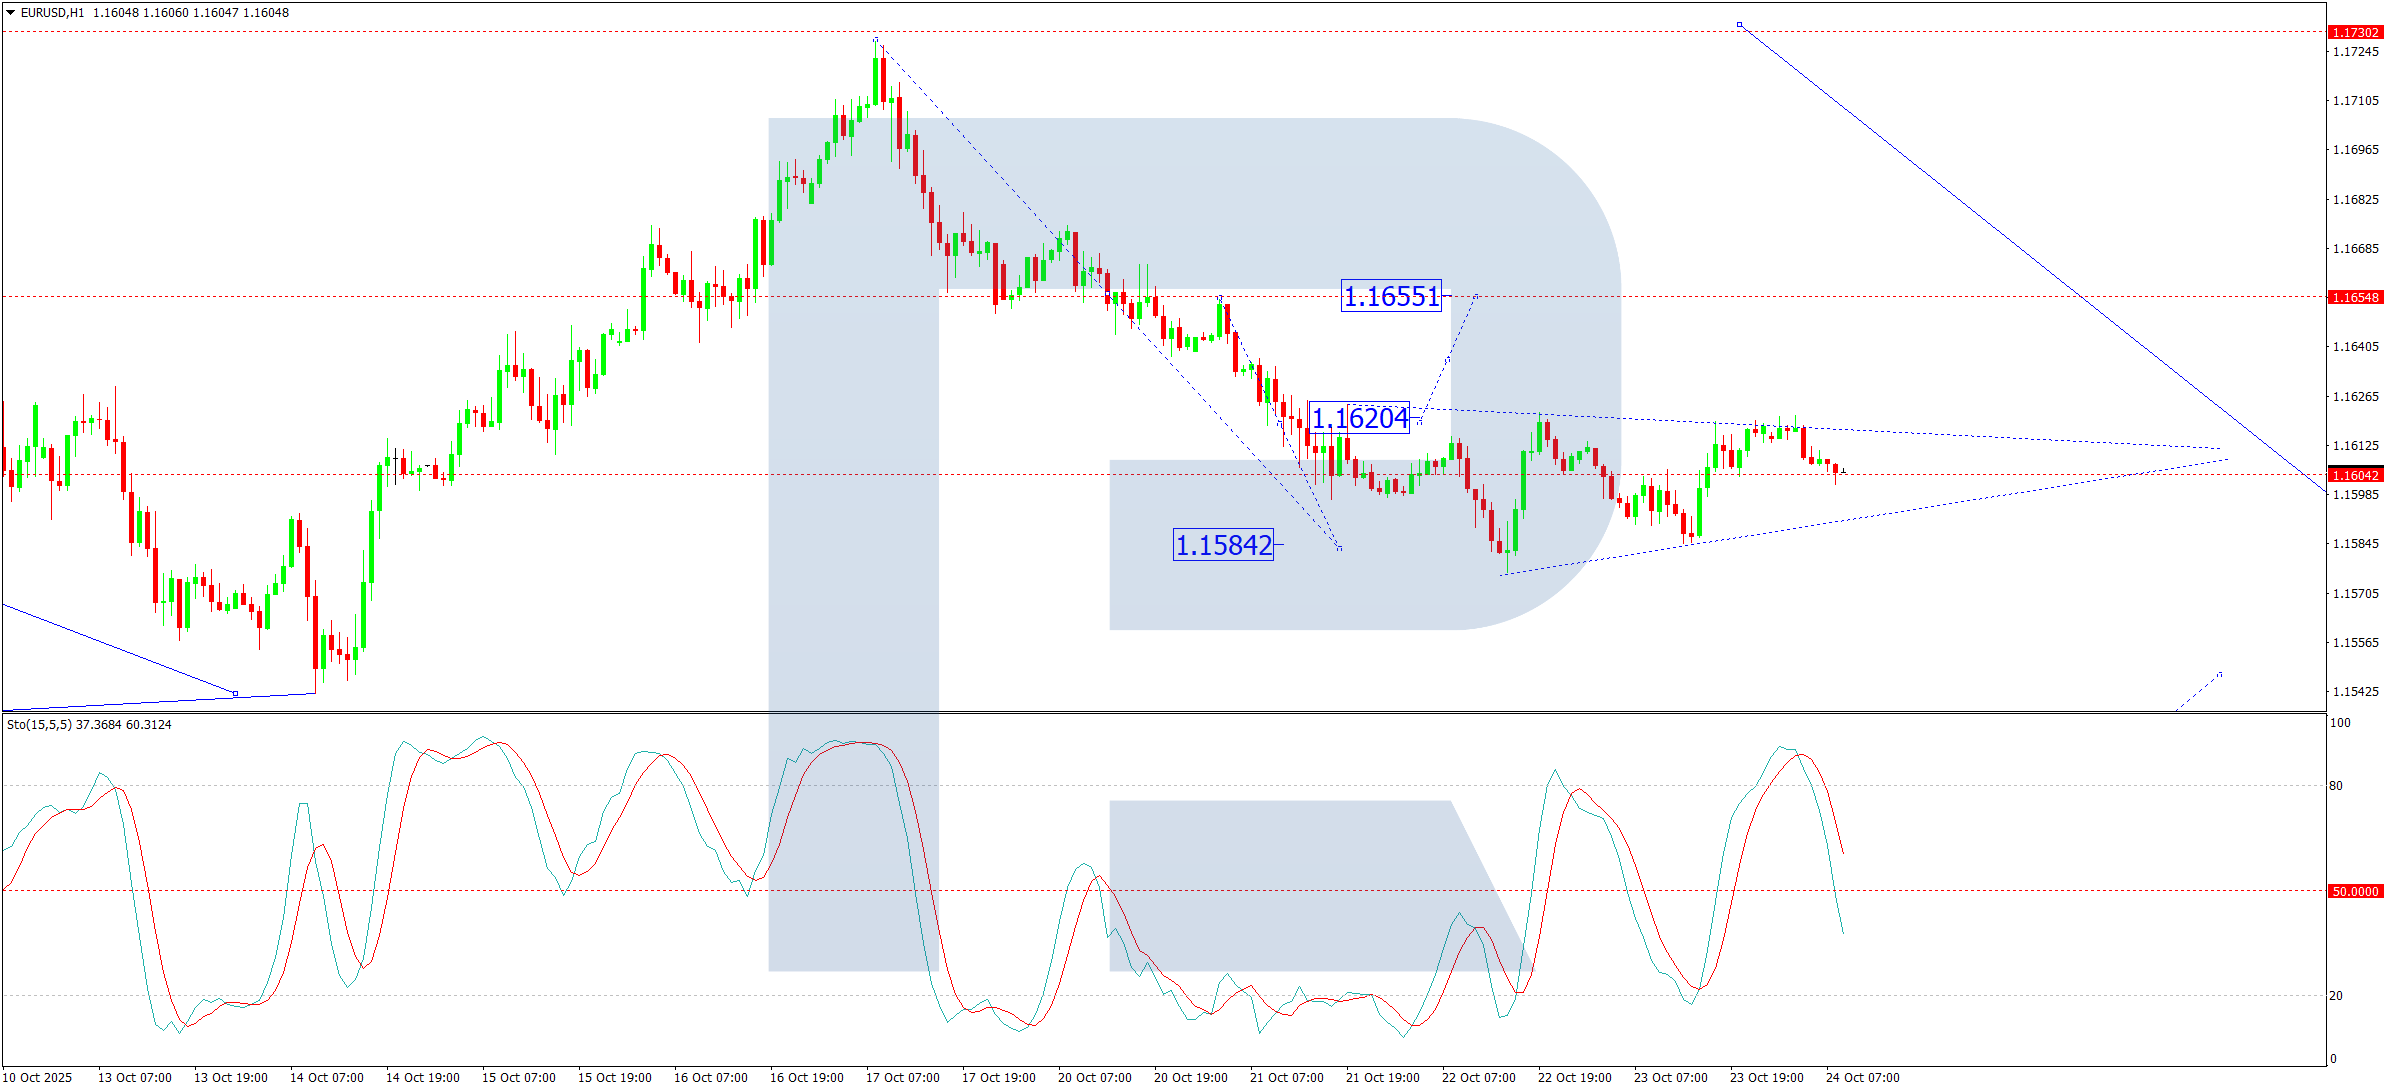
H1 Chart:

On the H1 chart, the market is forming a downward wave structure targeting 1.1616. The pair is effectively establishing the boundaries of a new consolidation range around this level. An upward breakout could trigger another correction towards 1.1640. However, the primary expectation is for a resumption of the downtrend to 1.1576, with the potential to extend the wave to 1.1540. This would represent only the first half of the third wave within the broader downward trend. The Stochastic oscillator supports this outlook. Its signal line is below 50 and is falling confidently towards 20, suggesting that short-term downward potential remains.
Conclusion
The fundamental focus is squarely on the Fed, with technicals pointing to a bearish resolution for the EUR/USD. The overall structure suggests any rallies are likely corrective within a broader downtrend, with key targets situated near 1.1540 and potentially 1.1488.
Disclaimer:
Any forecasts contained herein are based on the author’s particular opinion. This analysis may not be treated as trading advice. RoboForex bears no responsibility for trading results based on trading recommendations and reviews contained herein.