By ForexTime
- NAS100 ↑ 19 % year-to-date
- Nvidia accounts for almost 15% of NAS100 weight
- Most valuable company in the world with $4.5 trillion valuation
- China exposure, data center and Q4 guidance in focus
- Shares could move 6.2% ↑ or ↓ post earnings
Some normality may return to markets after Trump signed a bill to end the longest government shutdown in US history.
However, storm clouds could be on the horizon due to the resumption of federal economic data.
Any nasty surprises could inject more volatility into a week already packed with key data and earnings from Nvidia – the world’s most valuable company.
Monday, 17th November
- CAD: Canada CPI, housing starts
- JPY: Japan industrial production, GDP
- NZD: New Zealand food prices
- NAS100: US Empire State manufacturing, Fed speeches
Tuesday, 18th November
- AUD: RBA meeting minutes
- US30: Home Depot earnings, Fed speeches
Wednesday, 19th November
- EUR: Eurozone CPI
- JP225: Japan machinery orders, trade
- ZAR: South Africa CPI, retail sales
- GBP: UK CPI
- NAS100: FOMC minutes, Nvidia earnings
Thursday, 20th November
- CN50: China loan prime rates
- EU50: Eurozone consumer confidence
- ZAR: South Africa rate decision
- US30: Fed speeches, Walmart earnings.
Friday, 21st November
- CAD: Canada retail sales
- EUR: Eurozone HCOB manufacturing PMI, ECB President Christine Lagarde speech
- JPY: Japan CPI, S&P Global manufacturing PMI
- GBP: UK S&P Global manufacturing PMI, retail sales
- NAS100: US University of Michigan consumer sentiment, S&P Global manufacturing PMI, Fed speeches
FXTM’s NAS100 which tracks the benchmark Nasdaq100 index is almost 20% year-to-date.
But growing chatter around an AI bubble amid massive investments and circular business deals has sparked multiple selloffs.
Nvidia is slated to report quarterly results next Wednesday which could be a make-or-break moment for the AI rally.
Watch out for these 3 key factors:
1) Nvidia earnings
All eyes will be on Nvidia’s latest quarterly earnings after US markets close on Wednesday, November 19th.
For a company that remains at the heart of the A.I. hype, investors will be looking for another round of solid earnings that would justify its nearly 120% rebound from 2025 lows. Any fresh updates on Blackwell deliveries, exposure to China and guidance for Q4 will be in sharp focus.
Essentially, the bar remains very high for Nvidia with very little room for disappointment.
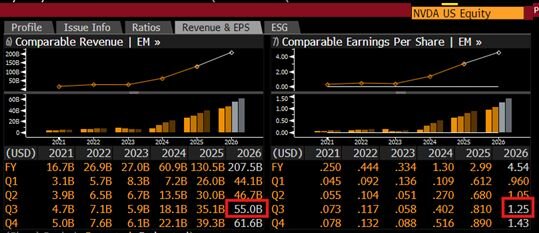
The AI chip giant expected to post earnings of $1.25 a share, and a rise in quarterly revenue to $55 billion – marking a 57% increase from a year ago.
What does this mean for the NAS100?
Nvidia is the biggest constituent in the Nasdaq 100, accounting for roughly 14%.
- Should Nvidia’s earnings satisfy investors’ lofty expectations and portray an encouraging business outlook, this could push the NAS100 higher.
- If Nvidia’s earnings disappoint in the slightest, this could trigger a selloff in the NAS100.
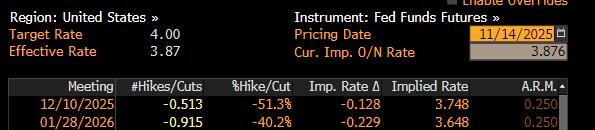
2) Government reopening data dump
After a 43-day shutdown that began on October 1st, investors have been kept in the dark regarding the US economy.
It’s worth noting that the shutdown is expected to have cost the economy $15 billion a week with the Congressional Budget Office projecting it to lower real GDP growth in the current quarter by 1.5%.
Markets may be injected with heightened levels of volatility as the government resumes releasing economic figures as soon as next week.
Note: These reports include the September and October jobs report, among others.
- Should data flag weakness in the US economy, this could hit US equities before prices potentially rebound on Fed cut bets.
- Stronger than expected data could boost US equities before they slip on cooling Fed cut expectations.
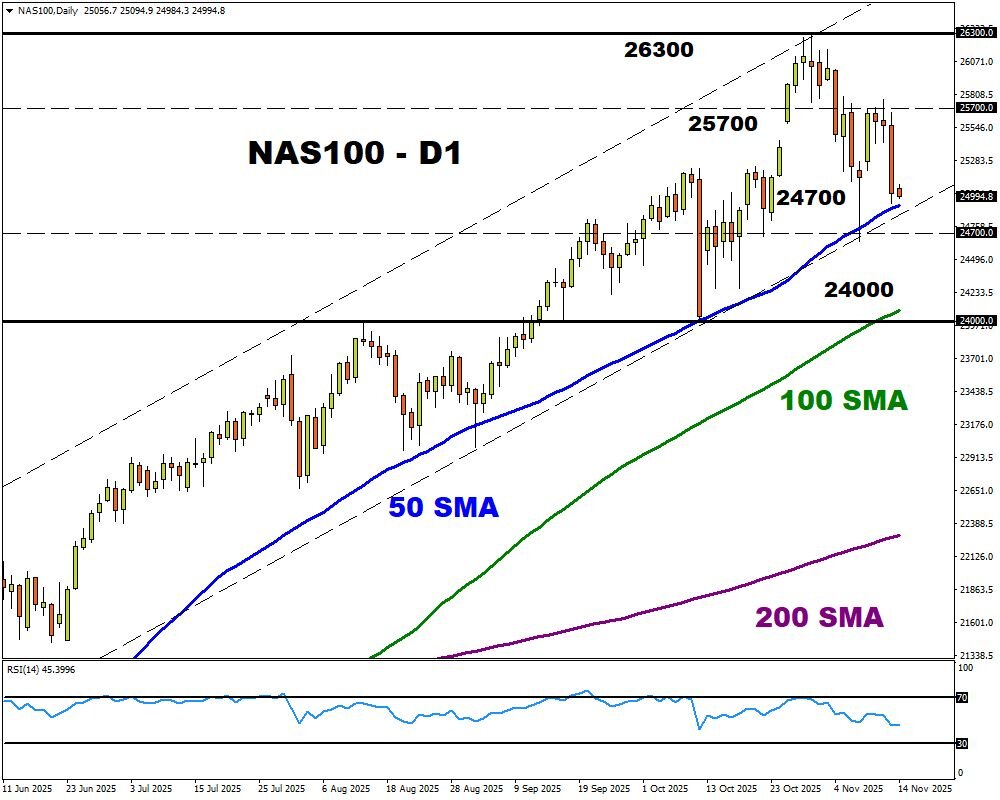
3) Technical forces
The NAS100 remains in a bullish channel on the daily charts but concerns around an AI bubble and easing Fed cut bets continue to fuel downside pressures.
- Should the 50-day SMA prove reliable support, prices may rebound back toward 25700 and 26300.
- Weakness below 24700 may trigger a selloff toward the 100-day SMA around 24000.
![]() Article by ForexTime
Article by ForexTime
ForexTime Ltd (FXTM) is an award winning international online forex broker regulated by CySEC 185/12 www.forextime.com