On Monday, gold advanced by more than 1% to 4,050 USD per ounce, reaching a fresh two-week high. The rally was fuelled by mounting concerns over the health of the US economy.
A softening US dollar provided further support for the precious metal, enhancing the affordability of dollar-denominated assets for international buyers.
Data released on Friday revealed that the University of Michigan’s consumer sentiment index had fallen to its lowest level in nearly three and a half years. This decline is largely attributed to the ongoing US government shutdown, which has now become the longest in the nation’s history. Investors are closely monitoring the situation as the US Senate moves closer to approving a Democratic-backed proposal to reopen the government.
Amid the economic uncertainty, market expectations for the Federal Reserve’s next move remain divided. The probability of a 25 basis point rate cut in December is currently priced at approximately 67%, unchanged from the end of last week.
Technical Analysis: XAU/USD
H4 Chart:
On the H4 chart, XAU/USD is forming a consolidation range around 3,988 USD. A breakout to the upside is expected to initiate a growth wave towards 4,075 USD, which may then be followed by a decline to 4,020 USD (testing the level from below). A subsequent breakdown from this range could extend the correction towards 3,660 USD, where the downward move is anticipated to conclude. This would potentially set the stage for a new upward wave targeting 4,400 USD. The MACD indicator supports this outlook, with its signal line above zero and pointing upward, suggesting continued near-term bullish momentum.
H1 Chart:
On the H1 chart, the market is also consolidating around 3,988 USD. An upward breakout is likely to propel prices towards 4,075 USD, after which a decline to at least 4,020 USD is expected. The Stochastic oscillator aligns with this view, as its signal line is positioned above 80 and appears poised to reverse downward towards 20, indicating potential for a near-term pullback.
Conclusion
Gold is trading at a two-week high, supported by economic concerns and a weaker US dollar. While the near-term technical structure suggests potential for further gains towards 4,075 USD, a subsequent correction towards 4,020 USD is anticipated. The broader outlook remains constructive, with a deeper corrective move towards 3,660 USD expected to present a buying opportunity ahead of a potential resumption of the broader uptrend.
Disclaimer:
Any forecasts contained herein are based on the author’s particular opinion. This analysis may not be treated as trading advice. RoboForex bears no responsibility for trading results based on trading recommendations and reviews contained herein.
This is the second in a two-part series. Read part one here.
Globalisation has always had its critics – but until recently, they have come mainly from the left rather than the right.
In the wake of the second world war, as the world economy grew rapidly under US dominance, many on the left argued that the gains of globalisation were unequally distributed, increasing inequality in rich countries while forcing poorer countries to implement free-market policies such as opening up their financial markets, privatising their state industries and rejecting expansionary fiscal policies in favour of debt repayment – all of which mainly benefited US corporations and banks.
This was not a new concern. Back in 1841, German economist Friedrich List had argued that free trade was designed to keep Britain’s global dominance from being challenged, suggesting:
When anyone has obtained the summit of greatness, he kicks away the ladder by which he climbs up, in order to deprive others of the means of climbing up after him.
By the 1990s, critics of the US vision of a global world order such as the Nobel-winning economist Joseph Stiglitz argued that globalisation in its current form benefited the US at the expense of developing countries and workers – while author and activist Naomi Klein focused on the negative environmental and cultural consequences of the global expansion of multinational companies.
Mass left-led demonstrations broke out, disrupting global economic meetings including, most famously, the World Trade Organization (WTO) in 1999. During this “battle of Seattle”, violent exchanges between protesters and police prevented the launch of a new world trade round that had been backed by then US president, Bill Clinton. For a while, the mass mobilisation of a coalition of trade unionists, environmentalists and anti-capitalist protesters seemed set to challenge the path towards further globalisation – with anti-capitalism “Occupy” protests spreading around the world in the wake of the 2008 financial crash.
A documentary about the 1999 ‘batte of Seattle’, directed by Jill Friedberg and Rick Rowley.
In the US, a further critique of globalisation centred on its domestic consequences for American workers – namely, job losses and lower pay – and led to calls for greater protectionism. Although initially led by trade unions and some Democratic politicians, this critique gradually gained purchase in radical right circles who opposed giving any role to international organisations like the WTO, on the grounds that they impinged on American sovereignty. According to this view, only by stopping foreign competition whose low wages undercut American workers could prosperity be restored. Immigration was another target.
Under Donald Trump’s second term as US president, these criticisms have been transformed into radical, deeply disruptive economic and social policies – with tariffs and protectionism at their heart. In so doing, Trump – despite all his grandstanding on the world stage – has confirmed what has long been clear to close observers of US politics and business: that the American century of global dominance, with the dollar as unrivalled no.1 currency, is drawing rapidly to a close.
Even before Trump first took office in 2017, the US had begun to withdraw from its leadership role in international economic institutions such as the WTO. Now, the strongest part of its economy, the hi-tech sector, is under intense pressure from China, whose economy is already bigger than the US’s by one key measure of GDP. Meanwhile, the majority of US citizens are facing stagnant incomes, higher prices and more insecure jobs.
In previous centuries, when first France and then Great Britain reached the end of their eras of world domination, these transitions had painful impacts beyond their borders. This time, with the global economy more closely integrated than ever before and no single dominant power waiting in the wings to take over, the impacts could be felt even more widely – with very damaging, if not catastrophic, results.
Why no one is ready to take the US’s place
When it comes to taking over from the US as the world’s leading hegemonic power, the only viable candidates with big enough economies are the European Union and China. But there are strong reasons to doubt that either could take on this role – notwithstanding the fact that in 2022, then US president Joe Biden’s National Security Strategy called China: “The only competitor with both the intent to reshape the international order and, increasingly, the economic, diplomatic, military and technological power to do so.”
At times Biden’s successor, President Trump, has sounded almost jealous of the control China’s leaders exert over their national economy, and the fact they do not face elections and limits on their terms in office. But a one-party, authoritarian political system which lacks legal checks and balances is a key reason China will find it hard to gain the cultural and political dominance among democratic nations that is part of achieving world no.1 status – despite the influence it already wields in large parts of Asia and Africa.
China still faces big economic challenges too. While it is already the global leader in manufactured goods (rapidly moving into hi-tech products) and the world’s largest exporter, its economy is still very unbalanced – with a much smaller consumer sector, a weak property market, many inefficient state industries that are highly indebted, and a relatively small financial sector restricted by state ownership. Nor does China possess a global currency, despite its (limited) attempts to make the renminbi a truly international currency.
The Insights section is committed to high-quality longform journalism. Our editors work with academics from many different backgrounds who are tackling a wide range of societal and scientific challenges.
As I found on a reporting trip to Shanghai in 2007 to investigate the effects of globalisation, there are also enormous differences between China’s prosperous coastal megacities – whose main thoroughfares rival New York and Paris – and the relative poverty in the interior, especially in rural areas. But nearly two decades on from that visit, with the country’s growth rate slowing, many university-educated young people are also finding it hard to find well-paid jobs now.
Meanwhile Europe – the only other contender to take the US’s place as global no.1 – is deeply politically divided, with smaller, weaker economies to the east and south far more sceptical about the benefits of globalisation, and increasingly divided on issues such as migration and the Ukraine war. The challenges of achieving broad policy agreement among all member states, and the problem of who can speak for Europe, make it unlikely that the EU as currently constituted could initiate and enforce a new global world order on its own.
The EU’s financial system also lacks the heft of the US’s. Although it has a common currency (the euro) managed by the European Central Bank, its financial system is far more fragmented. Banks are regulated nationally, and each country issues its own government bonds (although a few eurobonds now exist). This makes it hard for the euro to replace the dollar as a store of value, and reduces the incentive for foreigners to hold euros as an alternative reserve currency.
Meanwhile, any future prospects of a renewal of US global leadership look similarly unpromising. Trump’s policy of cutting taxes while increasing the size of the US government debt – which now stands at US$38 trillion, or 120% of GDP – threatens both the stability of the world economy and the ability of the US to finance this mind-boggling deficit.
US national debt hits record high. Video: The Economic Times.
Tellingly, the Trump administration shows no interest in reviving, or even engaging with, many of the international financial institutions which America once dominated, and which helped shape the world economic order – as US trade representative Jamieson Greer expressed disdainfully in the New York Times recently:
Our current, nameless global order, which is dominated by the WTO and is notionally designed to pursue economic efficiency and regulate the trade policies of its 166 member countries, is untenable and unsustainable. The US has paid for this system with the loss of industrial jobs and economic security, and the biggest winner has been China.
While the US is not, so far, withdrawing from the IMF, the Trump administration has urged it to call out China for running such a large trade surplus, while abandoning its concern about climate change. Greer concluded that the US has “subordinated our country’s economic and national security imperatives to a lowest common denominator of global consensus”.
World without a global no.1
To understand the potential dangers ahead, we must go back more than a century to the last time there was no global hegemon. By the time the first world war officially ended with the signing of the Treaty of Versailles on June 28 1919, the international economic order had collapsed. Britain, world leader over the previous century, no longer possessed the economic, political or military clout to enforce its version of globalisation.
The UK government, burdened by the huge debts it had taken out to finance the war effort, was forced to make major cuts in public spending. In 1931, it faced a sterling crisis: the pound had to be devalued as the UK exited from the gold standard for good, despite having yielded to the demands of international bankers to cut payments to the unemployed. This was a final sign that Britain had lost its dominant place in the world economic order.
The 1930s were a time of deep political unease and unrest in Britain and many other countries. In 1936, unemployed workers from Jarrow, a town in north-east England with 70% unemployment after its shipyards closed, organised a non-political “hunger march” to London which became known as the Jarrow crusade. More than 200 men, dressed in their Sunday best, marched peacefully in step for over 200 miles, gaining great support along the way. Yet when they reached London, prime minister Stanley Baldwin ignored their petition – and the men were informed their dole money would be docked because they had been unavailable for work over the past fortnight.
Europe was also facing a severe economic crisis. After Germany’s government refused to pay the reparations agreed in the 1919 Versailles treaty, saying they would bankrupt its economy, the French army occupied the German industrial heartland of the Ruhr and German workers went on strike, supported by their government. The ensuing struggle fuelled hyperinflation in Germany. By November 1923, it took 200,000 million marks to buy a loaf of bread, and the savings and pensions of the German middle class were wiped out. That month, Adolf Hitler made his first attempt to seize power in the failed “Beer hall putsch” in Munich.
In contrast, across the Atlantic, the US was enjoying a period of postwar prosperity, with a booming stock market and explosive growth of new industries such as car manufacturing. But despite emerging as the world’s strongest economic power, having financed much of the Allied war effort, it was unwilling to grasp the reins of global economic leadership.
The Republican US Congress, having blocked President Woodrow Wilson’s plan for a League of Nations, instead embraced isolationism and washed its hands of Europe’s problems. The US refused to cancel or even reduce the war debts owed it by the Allied nations, who eventually repudiated their debts. In retaliation, the US Congress banned all American banks from lending money to these so-called allies.
Then, in 1929, the affluent American “jazz age” came to an abrupt halt with a stock market crash that wiped off half its value. The country’s largest manufacturer, Ford, closed its doors for a year and laid off all its workers. With a quarter of the nation unemployed, long lines for soup kitchens were seen in every city, while those who had been evicted camped out wherever they could – including in New York’s Central Park, renamed “Hooverville” after the hapless US president of that time, Herbert Hoover.
In rural areas where the collapse in agricultural prices meant farmers could no longer make a living, armed farmers stopped food and milk trucks and destroyed their contents in a vain attempt to limit supply and raise prices. By March 1933, as President Franklin D. Roosevelt took office, the entire US banking system had ground to a standstill, with no one able to withdraw money from their bank account.
With its focus on this devastating Great Depression, the US refused to get involved in attempts at international economic cooperation. With no notice, Roosevelt withdrew from the 1933 London Conference which had been called to stabilise the world’s currencies – sending a message denouncing “the old fetishes of the so-called international bankers”.
With the US following the UK off the gold standard, the resulting currency wars exacerbated the crisis and further weakened European economies. As countries reverted to mercantilist policies of protectionism and trade wars, world trade shrank dramatically.
The situation became even worse in central Europe, where the collapse of the huge Credit-Anstalt bank in Austria in 1931 reverberated around the region. In Germany, as mass unemployment soared, centrist parties were squeezed and armed riots broke out between communist and fascist supporters. When the Nazis came to power, they introduced a policy of autarky, cutting economic ties with the west to build up their military machine.
The economic rivalries and antagonisms which weakened western economies paved the way for the rise of fascism in Germany. In some sense, Hitler – an admirer of the British empire – aspired to be the next hegemonic economic as well as military power, creating his own empire by conquering and ruthlessly exploiting the resources of the rest of Europe.
Troubled by rampant hyperinflation, Germans queue up with large bags to withdraw money from Berlin’s Reichsbank in 1923. Bundesarchiv/Wikimedia, CC BY-NC-SA
Nearly a century later, there are some disturbing parallels with that interwar period. Like America after the first world war, Trump insists that countries the US has supported militarily now owe it money for this protection. He wants to encourage currency wars by devaluing the dollar, and raise protectionist barriers to protect domestic industry. The 1920s was also a time when the US sharply limited immigration on eugenic grounds, only allowing it from northern European countries which (the eugenicists argued) would not “pollute the white race”.
Clearly, Trump does not view the lack of international cooperation that could amplify the damaging economic effects of a stock or bond market crash as a problem that should concern him. And in today’s unstable world, for all the US’s past failings as a global leader, that is a very worrying proposition.
How the US responded to the last financial crisis
Once again, the rules of the international order are breaking down. While it is possible that Trump’s approach will not be fully adopted by his successor in the White House, the direction of travel in the US will almost certainly remain sceptical about the benefits of globalisation, with limited support for any worldwide economic rules or initiatives.
We see similar scepticism about the benefits of globalisation emerging in other countries, amid the rise of rightwing populist parties in much of Europe and South America – many backed by Trump. Fuelling these parties’ support are growing concerns about income inequality, slow growth and immigration which are not being addressed by the current political system – and all of which would be exacerbated by the onset of a new global economic crisis.
With the global economy and financial system far bigger than ever before, a new crisis could be even more severe than the one that occurred in 2008, when the failure of the banking system left the world teetering on the brink of collapse.
The scale of this crisis was unprecedented, but key US and UK government officials moved boldly and swiftly. As a BBC reporter in Washington, I attended the House of Representatives’ Financial Services Committee hearing three days after Lehman Brothers went bankrupt, paralysing the global financial system, to find out the administration’s response. I remember the stunned look on the face of the committee’s chairman, Barney Frank, when he asked US Treasury secretary Hank Paulson and US Federal Reserve chairman Ben Bernanke how much money they might need to stabilise the situation:
“Let’s start with US$1 trillion,” Bernanke replied coolly. “But we have another US$2 trillion on our balance sheet if we need it.”
Documentary on the collapse of Lehman Brothers bank in September 2008.
Shortly afterwards, the US Congress approved a US$700 billion rescue package. While the global economy has still not fully recovered from this crisis, it could have been far worse – possibly as bad as the 1930s – without such intervention.
Around the world, governments ended up pledging US$11 trillion to guarantee the solvency of their banking systems, with the UK government putting up a sum equivalent to the country’s entire yearly GDP. But it was not just governments. At the G20 summit in London in April 2009, a new US$1.1 trillion fund was set up by the International Monetary Fund (IMF) to advance money to countries that were getting into financial difficulty.
The G20 also agreed to impose tougher regulatory standards for banks and other financial institutions that would apply globally, to replace the weak regulation of banks that had been one of the main causes of the crisis. As a reporter at this summit, I recall widespread excitement and optimism that the world was finally working together to tackle its global problems, with the host prime minister, Gordon Brown, briefly glowing in the limelight as organiser of that summit.
Behind the scenes, the US Federal Reserve had also been working to contain the crisis by quietly passing on to the world’s other leading central banks nearly US$600 billion in “currency swaps” to ensure they had the dollars they needed to bail out their own banking systems. The Bank of England secretly lent UK banks £100 billion to ensure they didn’t collapse, although two of the four major banks, Royal Bank of Scotland (now NatWest) and Lloyds, ultimately had to be nationalised (to different extents) to keep the financial system stable.
However, these rescue packages for banks, while much needed to stabilise the global economy, did not extend to many of the victims of the crash – such as the 12 million US households whose homes were now worth less than the mortgage they had taken out to pay for them, or the 40% of households who experienced financial distress during the 18 months after the crash. And the ramifications of the crisis were even greater for those living in developing countries.
A few months after the 2008 financial crisis began, I travelled to Zambia, an African country totally dependent on copper exports for its foreign exchange. I visited the Luanshya copper mine near Ndola in the country’s copper belt. With demand for copper (used mainly in construction and car manufacturing) collapsing, all the copper mines had closed. Their workers, in one of the few well-paid jobs in Zambia, were forced to leave their comfortable company homes and return to sharing with their relatives in Lusaka without pay.
Zambia’s government was forced to shut down its planned poverty reduction plan, which was to be funded by mining profits. The collapse in exports also damaged the Zambian currency, which dropped sharply. This hit the country’s poorest people hard as it raised the price of food, most of which was imported.
The ripple effects of the 2008 global financial crisis soon hit Luanshya copper mine in Zambia. Nerin Engineering Co., CC BY-SA
I also visited a flower farm near Lusaka, where Dutch expats Angelique and Watze Elsinga had been growing roses for export for over a decade – employing more than 200 workers who were given housing and education. As the market for Valentine’s Day roses collapsed, their bankers, Barclays South Africa, suddenly ordered them to immediately repay all their loans, forcing them to sell their farm and dismiss their workers. Ultimately, it took a US$3.9 billion loan from the IMF and World Bank to stabilise Zambia’s economy.
Should another global financial crisis hit, it is hard to see the Trump administration (and others that follow) being as sympathetic to the plight of developing countries, or allowing the Federal Reserve to lend major sums to foreign central banks – unless it is a country politically aligned with Trump, such as Argentina. Least likely of all is the idea of Trump working with other countries to develop a global trillion-dollar rescue package to help save the world economy.
Rather, there is a real worry that reckless actions by the Trump administration – and weak global regulation of financial markets – could trigger the next global financial crisis.
What happens if the US bond market collapses?
Economic historians agree that financial crises are endemic in the history of global capitalism, and they have been increasing in frequency since the “hyper-globalisation” of the 1970s. From Latin America’s debt crisis in the 1980s to the Asia currency crisis in the late 1990s and the US dotcom stock market collapse in the early 2000s, crises have regularly devastated economies and regions around the world.
Today, the greatest risk is the collapse of the US Treasury bond market, which underpins the global financial system and is involved in 70% of global financial transactions by banks and other financial institutions. Around the world, these institutions have long regarded the US bond market, worth over $30 trillion, as a safe haven, because these “debt securities” are backed by the US central bank, the Federal Reserve.
Increasingly, the unregulated “shadow banking system” – a sector now larger than regulated global banks – is deeply involved in the bond market. Non-bank financial institutions such as private equity, hedge funds, venture capital and pension funds are largely unregulated and, unlike banks, are not required to hold reserves.
Bond market jitters are already unnerving global financial markets, which fear its unravelling could precipitate a banking crisis on the scale of 2008 – with highly leveraged transactions by these non-bank financial institutions leaving them exposed.
US bonds play a key role in maintaining the stability of the global economy. Video: Wall Street Journal.
Buyers of US bonds are also troubled by the Trump administration’s plan to raise the US deficit even higher to pay for tax cuts – with the national debt now forecast to rise to 134% of US GDP by 2035, up from 120% in 2025. Should this lead to a widespread refusal to buy more US bonds among jittery investors, their value would collapse and interest rates – both in the US and globally – would soar.
The governor of the Bank of England, Andrew Bailey, recently warned that the situation has “worrying echoes of the 2008 financial crisis”, while the head of the IMF, Kristalina Georgieva, said her worries about the collapse of private credit markets sometimes keep her awake at night.
A bad situation would grow even worse if problems in the bond market precipitate a sharp decline in the value of the dollar. The world’s “anchor currency” would no longer be seen as a safe store of value – leading to more withdrawals of funds from the US Treasury bond market, where many foreign governments hold their reserves.
A weaker dollar would also make imported goods more expensive for US consumers, while potentially boosting the country’s exports. This is precisely the course of action advocated by Stephen Miran, chair of the US president’s Council of Economic Advisors – who Trump appears to want to be the next head of the Federal Reserve.
One example of what could happen if bond markets become destabilised occurred when the shortest-lived prime minister in UK history, Liz Truss, announced huge unfunded tax cuts in her 2022 budget, causing the value of UK gilts (the equivalent of US Treasury bonds) to plummet as interest rates spiked. Within days, the Bank of England was forced to put up an emergency £60 billion rescue fund to avoid major UK pension funds collapsing.
In the case of a US bond market crash, however, there are growing fears that the US government would be unable – and unwilling – to step in to mitigate such damage.
A new era of financial chaos
Just as worrying would be a crash of the US stock market – which, by historic standards, is currently vastly overvalued.
Huge recent increases in the US stock market’s overall value have been driven almost entirely by the “magnificent seven” hi-tech companies, which alone make up a third of its total value. If their big bet on artificial intelligence is not as lucrative as they claim, or is overshadowed by the success of China’s AI systems, a sharp downturn, similar to the dotcom crash of 2000-02, could well occur.
Jamie Dimon, head of the US’s biggest bank JPMorgan Chase, has said he is “far more worried than other [experts]” about a serious market correction, which he warned could come in the next six months to two years.
Big tech executives have been overoptimistic before. Reporting from Silicon Valley in 2001 as the dotcom bubble was bursting, I was struck by the unshakeable belief of internet startup CEOs that their share prices could only go up.
Furthermore, their companies’ high stock valuations had allowed them to take over their competitors, thus limiting competition – just as companies such as Google and Meta (Facebook) have since used their highly valued shares to purchase key assets and potential rivals including YouTube, WhatsApp, Instagram and DeepMind. History suggests this is always bad for the economy in the long run.
With the business and financial worlds now ever more closely linked, not only has the frequency of financial crises increased in the last half-century, each crisis has become more interconnected. The 2008 global financial crisis showed how dangerous this can be: a global banking crisis triggered stock market falls, collapses in the value of weak currencies, a debt crisis in developing countries – and ultimately, a global recession that has taken years to recover from.
The IMF’s latest financial stability report summarised the situation in worrying terms, highlighting “elevated” stability risks as a result of “stretched asset valuations, growing pressure in sovereign bond markets, and the increasing role of non-bank financial institutions. Despite its deep liquidity, the global foreign exchange market remains vulnerable to macrofinancial uncertainty.”
The IMF has warned about instability in the global financial system. Video: CGTN America.
I believe we may be entering a new era of sustained financial chaos during which the seeds sown by the death of globalisation – and Trump’s response to it – finally shatter the world economic and political order established after the second world war.
Trump’s high and erratically applied tariffs – aimed most strongly at China – have already made it difficult to reconfigure global supply chains. Even more worrying could be the struggle over the control of key strategic raw materials like the rare earth minerals needed for hi-tech industries, with China banning their export and the US threatening 100% tariffs in return (as well as hoping to take over Greenland, with its as-yet-untapped supply of some of these minerals).
This conflict over rare earths, vital for the computer chips needed for AI, could also threaten the market value of high-flying tech stocks such as Nvidia, the first company to exceed US$4 trillion in value.
The battle for control of critical raw materials could escalate. There is a danger that in some cases, trade wars might become real wars – just as they did in the former era of mercantilism. Many recent and current regional conflicts, from the first Iraq war aimed at the conquest of the oilfields of Kuwait, to the civil war in Sudan over control of the country’s goldmines, are rooted in economic conflicts.
The history of globalisation over the past four centuries suggests that the presence of a global superpower – for all its negative sides – has brought a degree of economic stability in an uncertain world.
In contrast, a key lesson of history is that a return to policies of mercantilism – with countries struggling to seize key natural resources for themselves and deny them to their rivals – is most likely a recipe for perpetual conflict. But this time around, in a world full of 10,000 nuclear weapons, miscalculations could be fatal if trust and certainty are undermined.
The challenges ahead are immense – and the weakness of international institutions, the limited visions of most governments and the alienation of many of their citizens are not optimistic signs.
This is the second in a two-part series. In case you missed it, read part one here.
This is the first in a two-part series. Read part two here.
For nearly four centuries, the world economy has been on a path of ever-greater integration that even two world wars could not totally derail. This long march of globalisation was powered by rapidly increasing levels of international trade and investment, coupled with vast movements of people across national borders and dramatic changes in transportation and communication technology.
According to economic historian J. Bradford DeLong, the value of the world economy (measured at fixed 1990 prices) rose from US$81.7 billion (£61.5 billion) in 1650, when this story begins, to US$70.3 trillion (£53 trillion) in 2020 – an 860-fold increase. The most intensive periods of growth corresponded to the two periods when global trade was rising fastest: first during the “long 19th century” between the end of the French revolution and start of the first world war, and then as trade liberalisation expanded after the second world war, from the 1950s up to the 2008 global financial crisis.
Now, however, this grand project is on the retreat. Globalisation is not dead yet, but it is dying.
Is this a cause for celebration, or concern? And will the picture change again when Donald Trump and his tariffs of mass disruption leave the White House? As a longtime BBC economics correspondent who was based in Washington during the global financial crisis, I believe there are sound historical reasons to worry about our deglobalised future – even once Trump has left the building.
Trump’s tariffs have amplified the world’s economic problems, but he is not the root cause of them. Indeed, his approach reflects a truth that has been emerging for many decades but which previous US administrations – and other governments around the world – have been reluctant to admit: namely, the decline of the US as the world’s no.1 economic power and engine of world growth.
In each era of globalisation since the mid-17th century, a single country has sought to be the clear world leader – shaping the rules of the global economy for all. In each case, this hegemonic power had the military, political and financial power to enforce these rules – and to convince other countries that there was no preferable path to wealth and power.
But now, as the US under Trump slips into isolationism, there is no other power ready to take its place and carry the torch for the foreseeable future. Many people’s pick, China, faces too many economic challenges, including its lack of a truly international currency – and as a one-party state, nor does it possess the democratic mandate needed to gain acceptance as the world’s new dominant power.
While globalisation has always produced many losers as well as winners – from the slave trade of the 18th century to displaced factory workers in the American Midwest in the 20th century – history shows that a deglobalised world can be an even more dangerous and unstable place. The most recent example came during the interwar years, when the US refused to take up the mantle left by the decline of Britain as the 19th century’s hegemonic global power.
In the two decades from 1919, the world descended into economic and political chaos. Stock market crashes and global banking failures led to widespread unemployment and increasing political instability, creating the conditions for the rise of fascism. Global trade declined sharply as countries put up trade barriers and started self-defeating currency wars in the vain hope of giving their countries’ exports a boost. On the contrary, global growth ground to a halt.
A century on, our deglobalising world is vulnerable again. But to chart whether this means we are destined for a similarly chaotic and unstable future, we first need to explore the birth, growth and reasons behind the imminent demise of this extraordinary global project.
French model: mercantilism, money and war
By the mid-1600s, France had emerged as the strongest power in Europe – and it was the French who developed the first overarching theory of how the global economy could work in their favour. Nearly four centuries later, many aspects of “mercantilism” have been revived by Trump’s US playbook, which could be entitled How To Dominate the World Economy by Weakening Your Rivals.
France’s version of mercantilism was based on the idea that a country should put up trade barriers to limit how much other countries could sell to it, while boosting its own industries to ensure that more money (in the form of gold) came into the country than left it.
England and the Dutch Republic had already adopted some of these mercantilist policies, establishing colonies around the globe run by powerful monopolistic trading companies that aimed to challenge and weaken the Spanish empire, which had prospered on the gold and silver it seized in the Americas. In contrast to these “seaborne empires”, the much larger empires in the east such as China and India had the internal resources to generate their own revenue, meaning international trade – although widespread – was not critical to their prosperity.
But it was France which first systematically applied mercantilism across the whole of government policy – led by the powerful finance minister Jean-Baptiste Colbert (1661-1683), who had been granted unprecedented powers to strengthen the financial might of the French state by King Louis XIV. Colbert believed trade would boost the coffers of the state and strengthen France’s economy while weakening its rivals, stating:
It is simply, and solely, the absence or abundance of money within a state [which] makes the difference in its grandeur and power.
In Colbert’s view, trade was a zero-sum game. The more France could run a trade surplus with other countries, the more gold bullion it could accumulate for the government and the weaker its rivals would become if deprived of gold. Under Colbert, France pioneered protectionism, tripling its import tariffs to make foreign goods prohibitively expensive.
At the same time, he strengthened France’s domestic industries by providing subsidies and granting them monopolies. Colonies and government trading companies were established to ensure France could benefit from the highly lucrative trade in goods such as spices, sugar – and slaves.
Colbert oversaw the expansion of French industries into areas like lace and glass-making, importing skilled craftsmen from Italy and granting these new companies state monopolies. He invested heavily in infrastructure such as the Canal du Midi, and dramatically increased the size of France’s navy and merchant marine to challenge its British and Dutch rivals.
Global trade at this time was highly exploitative, involving the forced seizure of gold and other raw materials from newly discovered lands (as Spain had been doing with its conquests in the New World from the late 15th century). It also meant benefiting from the trade in humans, with huge profits as slaves were seized and sent to the Caribbean and other colonies to produce sugar and other crops.
In this era of mercantilism, trade wars often led to real wars, fought across the globe to control trade routes and seize colonies. Following Colbert’s reforms, France began a long struggle to challenge the overseas empires of its maritime rivals, while also engaging in wars of conquest in continental Europe.
France initially enjoyed success in the 17th century both on land and sea against the Dutch. But ultimately, its state-run French Indies company was no rival to the ruthless, commercially driven activities of the Dutch and British East India companies, which delivered enormous profits to their shareholders and revenues for their governments.
Indeed, the huge profits made by the Dutch from the Far Eastern spice trade explains why they had no hesitation in handing over their small North American colony of New Amsterdam, in return for expelling the British from a small toehold of one of their spice islands in what is now Indonesia. In 1664, that Dutch outpost was renamed New York.
After a century of conflict, Britain gradually gained ascendancy over France, conquering India and forcing its great rival to cede Canada in 1763 after the Seven Years war. France never succeeded in fully countering Britain’s naval strength. Resounding defeats by fleets led by Horatio Nelson in the early 19th century, coupled with Napoleon’s defeat at Waterloo by a coalition of European powers, marked the end of France’s time as Europe’s hegemonic power.
The battle of Trafalgar, off southwestern Spain in October 1805, was decisive in ending France’s era of dominance. Yale Center for British Art/Wikimedia
But while the French model of globalisation ultimately failed in its attempt to dominate the world economy, that has not prevented other countries – and now President Trump – from embracing its principles.
France found that tariffs alone could not sufficiently fund its wars nor boost its industries. Its broad version of mercantilism led to endless wars that spread around the globe, as countries retaliated both economically and militarily and tried to seize territories.
More than two centuries later, there is an uncomfortable parallel with what the results of Trump’s endless tariff wars might bring, both in terms of ongoing conflict and the organisation of rival trade blocs. It also shows that more protectionism, as proposed by Trump, will not be enough to revive the US’s domestic industries.
British model: free trade and empire
The ideology of free trade was first spelled out by British economists Adam Smith and David Ricardo, the founding fathers of classical economics. They argued trade was not a zero-sum game, as Colbert had suggested, but that all countries could mutually benefit from it. According to Smith’s classic text, The Wealth of Nations (1776):
If a foreign country can supply us with a commodity cheaper than we ourselves can make, better buy it off them with some part of the produce of our own industry, employed in such a way that we have some advantages.
As the world’s first industrial nation, by the 1840s Britain had created an economic powerhouse based on the new technologies of steam power, the factory system, and railroads.
Smith and Ricardo argued against the creation of state monopolies to control trade, proposing minimal state intervention in industry. Ever since, Britain’s belief in the benefits of free trade has proved stronger and more long-lasting than any other major industrial power – more deeply embedded in both its politics and popular imagination.
This ironclad commitment was born out of a bitter political struggle in the 1840s between manufacturers and landowners over the protectionist Corn Laws. The landowners who had traditionally dominated British politics backed high tariffs, which benefited them but resulted in higher prices for staples like bread. The repeal of the Corn Laws in 1846 upended British politics, signalling a shift of power to the manufacturing classes – and ultimately to their working-class allies once they gained the right to vote.
An Anti-Corn Law League meeting held in London’s Exeter Hall in 1846. Wikimedia
In time, Britain’s advocacy of free trade unleashed the power of its manufacturing to dominate global markets. Free trade was framed as the way to raise living standards for the poor (the exact opposite of President Trump’s claim that it harms workers) and had strong working-class support. When the Conservatives floated the idea of abandoning free trade in the 1906 general election, they suffered a devastating defeat – the party’s worst until 2024.
As well as trade, a central element in Britain’s role as the new global hegemonic power was the rise of the City of London as the world’s leading financial centre. The key was Britain’s embrace of the gold standard which put its currency, the pound, at the heart of the new global economic order by linking its value to a fixed amount of gold, ensuring its value would not fluctuate. Thus the pound became the worldwide medium of exchange.
This encouraged the development of a strong banking sector, underpinned by the Bank of England as a credible and trustworthy “lender of last resort” in a financial crisis. The result was a huge boom in international investment, opening access to overseas markets for British companies and individual investors.
In the late 19th century, the City of London dominated global finance, investing in everything from Argentinian railways and Malaysian rubber plantations to South African gold mines. The gold standard became a talisman of Britain’s power to dominate the world economy.
The pillars of Britain’s global economic dominance were a highly efficient manufacturing sector, a commitment to free trade to ensure its industry had access to global markets, and a highly developed financial sector which invested capital around the world and reaped the benefits of global economic development. But Britain also did not hesitate to use force to open up foreign markets – for example, during the Opium Wars of the 1840s, when China was compelled to open its markets to the lucrative trade in opium from British-owned India.
By the end of the 19th century, the British empire incorporated one quarter of the world’s population, providing a source of cheap labour and secure raw materials as well as a large market for Britain’s manufactured goods. But that was still not enough for its avaricious leaders: Britain also made sure that local industries did not threaten its interests – by undermining the Indian textile industry, for example, and manipulating the Indian currency.
In reality, globalisation in this era was about domination of the world economy by a few rich European powers, meaning that much global economic development was curtailed to protect their interests. Under British rule between 1750 and 1900, India’s share of world industrial output declined from 25% to 2%.
But for those at the centre of Britain’s global formal and informal empire, such as the middle-class residents of London, this was a halcyon time – as economist John Maynard Keynes would later recall:
For middle and upper classes … life offered, at a low cost and with the least trouble, conveniences, comforts and amenities beyond the compass of the richest and most powerful monarchs of other ages. The inhabitant of London could order by telephone, sipping his morning tea in bed, the various products of the whole Earth, in such quantity as he might see fit, and reasonably expect their early delivery upon his doorstep.
US model: protectionism to neoliberalism
While Britain enjoyed its century of global dominance, the United States embraced protectionism for longer after its foundation in 1776 than all other major western economies.
The introduction of tariffs to protect and subsidise emerging US industries had first been articulated in 1791 by the fledgling nation’s first treasury secretary, Alexander Hamilton – Caribbean immigrant, founding father and future subject of a record-breaking musical. The Whig party under Henry Clay and its successor, the Republican Party, were both strong supporters of this policy for most of the 19th century. Even as US industry grew to overshadow all others, its government maintained some of the highest tariff barriers in the world.
Founding father Alexander Hamilton on the front of a US$10 note from 1934. Wikimedia
Tariff rates rose to 50% in the 1890s with the backing of future president William McKinley, both to help industrialists and pay for generous pensions for 2 million civil war veterans and their dependants – a key part of the Republican electorate. It is no accident that President Trump has festooned the White House with pictures of Hamilton, Clay and McKinley – all supporters of protectionism and high tariffs.
In part, the US’s enduring resistance to free trade was because it had access to an internal supply of seemingly limitless raw materials, while its rapidly growing population, fuelled by immigration, provided internal markets that fuelled its growth while keeping out foreign competition.
By the late 19th century, the US was the world’s biggest steel producer with the largest railroad system in the world and was moving rapidly to exploit the new technologies of the second industrial revolution – based on electricity, petrol engines and chemicals. Yet it was only after the second world war that the US assumed the role of global superpower – in part because it was the only country on either side of the war that had not suffered severe damage to its economy and infrastructure.
In the wake of global destruction in Europe and Asia, the US’s dominance was political, military and cultural, as well as financial – but the US vision of a globalised world had some important differences from its British predecessor.
The US took a much more universalist and rules-based approach, focusing on the creation of global organisations that would establish binding regulations – and open up global markets to unfettered American trade and investment. It also aimed to dominate the international economic order by replacing the pound sterling with the US dollar as the global medium of exchange.
Within a week of its entry in the second world war, plans were laid to establish US global financial hegemony. The US treasury secretary, Henry Morgenthau, began work on establishing an “inter-allied stabilisation fund” – a playbook for post-war monetary arrangements which would enshrine the US dollar at its heart.
This led to the creation of the International Monetary Fund (IMF) and World Bank at the Bretton Woods conference in New Hampshire in 1944 – institutions dominated by the US, which encouraged other countries to adopt the same economic model both in terms of free trade and free enterprise. The Allied nations who were simultaneously meeting to establish the United Nations to try to ensure future world peace, having suffered the devastating effects of the Great Depression and war, welcomed the US’s commitment to shape a new, more stable economic order.
How the 1944 Bretton Woods deal ensured the US dollar would be the world’s dominant currrency. Video: Bloomberg TV.
As the world’s biggest and strongest economy, there was (initially) little resistance to this US plan for a new international economic order in its own image. The motive was as much political as economic: the US wanted to provide economic benefits to ensure the loyalty of its key allies and counter the perceived threat of a communist takeover – in complete contrast to Trump’s mercantilist view today that all other countries are out to “rip off” the US, and that its own military might means it has no real need for allies.
After the war finally ended, the US dollar, now linked to gold at a fixed rate of $35 per ounce to guarantee its stability, assumed the role as the free world’s principal currency. It was both used for global trade transactions and held by foreign central banks as their currency reserves – giving the US economy an “exorbitant privilege”. The stable value of the dollar also made it easier for the US government to sell Treasury bonds to foreign investors, enabling it to more easily borrow money and run up trade deficits with other countries.
The conditions were set for an era of US political, financial and cultural dominance, which saw the rise of globally admired brands such as McDonald’s and Coca Cola, as well as a powerful US marketing arm in the form of Hollywood. Perhaps even more significantly, the relaxed, well-funded campuses of California would prove a perfect petri dish for the development of new computer technologies – backed initially by cold war military investment – which, decades later, would lead to the birth of the big-tech companies that dominate the tech landscape today.
The US view of globalisation was broader and more interventionist than the British model of free trade and empire. Rather than having a formal empire, it wanted to open up access to the entire world economy, which would provide global markets for American products and services.
The US believed you needed global economic institutions to police these rules. But as in the British case, the benefits of globalisation were still unevenly shared. While countries that embraced export-led growth such as Japan, Korea and Germany prospered, other resource-rich but capital-poor countries such as Nigeria only fell further behind.
From dream to despair
Though the legend of the American dream grew and grew, by the 1970s the US economy was coming under increasing pressure – in particular from German and Japanese rivals, who by then had recovered from the war and modernised their industries.
Troubled by these perceived threats and a growing trade deficit, in 1971 President Richard Nixon stunned the world by announcing that the US was going off the gold standard – forcing other countries to bear the cost of adjustment for the US balance of payments crisis by making them revalue their currencies. This had a profound effect on the global financial system: within a decade, most major currencies had abandoned fixed exchange rates for a new system of floating rates, effectively ending the 1944 Bretton Woods settlement.
US president Richard Nixon announces the US is leaving the gold standard on August 15 1971.
The end of fixed exchange rates opened the door to the “financialisation” of the global economy, vastly expanding global investment and lending – much of it by US financial firms. This gave succour to the burgeoning neoliberal movement that sought to further rewrite the rules of the financial world order. In the 1980s and ’90s, these policy prescriptions became known as the Washington consensus: a set of rules – including opening markets to foreign investment, deregulation and privatisation – that was imposed on developing economies in crisis, in return for them receiving support from US-led organisations like the World Bank and IMF.
In the US, meanwhile, the increasing reliance on the finance and hi-tech sectors increased levels of inequality and fostered resentment in large parts of American society. Both Republicans and Democrats embraced this new world order, shaping US policy to favour their hi-tech and financial allies. Indeed, it was the Democrats who played a key role in deregulating the financial sector in the 1990s.
Meanwhile, the decline of US manufacturing industries accelerated, as did the gap between the incomes of those in the hinterland, where manufacturing was based, and residents of the large metropolitan cities.
By 2023, the lowest 50% of US citizens received just 13% of total personal income, while the top 10% received almost half (47%). The wealth gap was even greater, with the bottom 50% only having 6% of total wealth, while a third (36%) was held by just the top 1%. Since 1980, real incomes of the bottom 50% have barely grown for four decades.
The bottom half of the US population was suffering from a surge in “deaths of despair” – a term coined by the Nobel-winning economist Angus Deaton to describe high mortality rates from drug abuse, suicide and murder among younger working-class Americans. Rising costs of housing, medical care and university education all contributed to widespread indebtedness and growing financial insecurity. By 2019, a study found that two-thirds of people who filed for bankruptcy cited medical issues as a key reason.
The decline in US manufacturing accelerated after China was admitted to the World Trade Organization in 2001, increasing America’s soaring trade and budget deficit even more. Political and business elites hoped the move would open up the huge Chinese market to US goods and investment, but China’s rapid modernisation made its industry more competitive than its American rivals in many fields.
Ultimately, this era of intensive financialisation of the world economy created a series of regional and then global financial crises, damaging the economies of many Latin American and Asian economies. This culminated in the 2008 global financial crisis, precipitated by reckless lending by US financial institutions. The world economy took more than a decade to recover as countries wrestled with slower growth, lower productivity and less trade than before the crisis.
For those who chose to read it, the writing was on the wall for America’s era of global domination decades ago. But it would take Trump’s victory in the 2016 presidential election – a profound shock to many in the US “liberal establishment” – to make clear that the US was now on a very different course that would shake up the world.
Making a bad situation more dangerous
In my view, Trump is the first modern-day US president to fully understand the powerful alienation felt by many working-class American voters, who believed they were left out of the US’s immense post-war economic growth that so benefited the largely urban American middle classes. His strongest supporters have always been lower-middle-class voters from rural areas who are not college-educated.
Yet Trump’s key policies will ultimately do little for them. High tariffs to protect US jobs, expulsion of millions of illegal immigrants, dismantling protections for minorities by opposing DEI (diversity, equality and inclusion) programmes, and drastically cutting back the size of government will have increasingly negative economic consequences in the future, and are very unlikely to restore the US economy to its previous dominant position.
US president Donald Trump unveils his global tariff ‘hit list’ on April 3 2025. BBC News.
Long before he first became president, Trump hated the eye-watering US trade deficit (he’s a businessman, after all) – and believed that tariffs would be a key weapon for ensuring US economic dominance could be maintained. Another key part of his “America First” ideology was to repudiate the international agreements that were at the heart of the US’s postwar approach to globalisation.
In his first term, however, Trump (having not expected to win) was ill-prepared for power. But second time around, conservative thinktanks had spent years outlining detailed policies and identifying key personnel who could implement the radical U-turn in US economic policy.
Under Trump 2.0, we have seen a return to the mercantilist point of view reminiscent of France in the 17th and 18th centuries. His assertion that countries which ran a trade surplus with the US “were ripping us off” echoed the mercantilist belief that trade was a zero-sum game – rather than the 20th-century view, pioneered by the US, that globalisation brings benefits to all, no matter the precise balance of that trade.
Trump’s tax-and-tariff plans, which extend the tax breaks to the very rich while reducing benefits for the poor through benefit cuts and tariff-driven inflation, will increase inequality in the US.
At the same time, the passing of the One Big Beautiful Bill is predicted to add some US$3.5 trillion to US government debt – even after the Elon Musk-led “Department of Government Efficiency” cuts imposed on many Washington departments. This adds pressure to the key US Treasury bond market at the centre of the world financial system, and raises the cost of financing the huge US deficit while weakening its credit rating. Continuing these policies could threaten a default by the US, which would have devastating consequences for the entire global financial system.
For all the macho grandstanding from Trump and his supporters, his economic policies are a demonstration of American weakness, not strength. While I believe his highlighting of some of the ills of the US economy were overdue, the president is rapidly squandering the economic credibility and good will that the US built up in the postwar years, as well as its cultural and political hegemony. For people living in America and elsewhere, he is making a bad situation more dangerous – including for many of his most ardent supporters.
That said, even without Trump’s economic and societal disruptions, the end of the US era of hegemonic dominance would still have happened. Globalisation is not dead, but it is dying. The troubling question we all face now, is what happens next.
This is the first of a two-part Insights long read on the rise and fall of globalisation. Read part two here: why the next global financial meltdown could be much worse with the US on the sidelines.
Every few years since 1953, the Chinese government has unveiled a new master strategy for its economy: the all-important five-year plan.
For the most part, these blueprints have been geared at spurring growth and unity as the nation transformed from a rural, agrarian economy to an urbanized, developed powerhouse.
Their solution? More of the same. In pledging to deliver “high-quality development” through technological self-reliance, industrial modernization and expanded domestic demand, Beijing is doubling down on a state-led model that has powered its rise in recent years. President Xi Jinping and others who ironed out the 2026-2030 plan are betting that innovation-driven industrial growth might secure China’s future, even as questions loom about underpowered consumer spending and mounting economic risks.
As an expert on China’s political economy, I view China’s new five-year plan as being as much about power as it is about economics. Indeed, it is primarily a blueprint for navigating a new era of competition. As such, it risks failing to address the widening gap between surging industrial capacity and tepid domestic demand.
High-tech dreams
At the heart of the new plan are recommendations that put advanced manufacturing and tech innovation front and center. In practice, this means upgrading old-line factories, automating and “greening” heavy industry and fostering “emerging and future industries” such as aerospace, renewable energy and quantum computing.
To insulate China from export controls put in place by other countries to slow China’s ascent, Beijing is doubling down on efforts to “indigenize” critical technologies by pumping money into domestic companies while reducing dependence on foreign suppliers.
This quest for self-reliance is not just about economics but explicitly tied to national security.
Under Xi, China has aggressively pursued what the Chinese Communist Party calls “military-civil fusion” – that is, the integration of civilian innovation with military needs.
The new five-year plan is poised to institutionalize this fusion as the primary mechanism for defense modernization, ensuring that any breakthroughs in civilian artificial intelligence or supercomputing automatically benefit the People’s Liberation Army.
Reshaping global trade
China’s state-led push in high-tech industries is already yielding dividends that the new five-year plan seeks to extend. In the past decade, China has surged to global leadership in green technologies such as solar panels, batteries and electric vehicles thanks to hefty government support. Now, Beijing intends to replicate that success in semiconductors, advanced machinery, biotechnology and quantum computing.
Such ambition, if realized, could reshape global supply chains and standards.
But it also raises the stakes in China’s economic rivalry with advanced economies. Chinese prowess in building entire supply chains has spurred the United States and Europe to talk of reindustrialization to avoid any overreliance on Beijing.
By pledging to build “a modern industrial system with advanced manufacturing as the backbone” and to accelerate “high-level scientific and technological self-reliance,” the new plan telegraphs that China will not back down from its bid for tech dominance.
An elusive rebalancing
What the plan gives comparatively modest attention, however, is the lack of strong domestic demand.
Boosting consumer spending and livelihoods gets little more than lip service in the communiqué that followed the plenum at which the five-year plan was mapped out.
Chinese leaders did promise efforts to “vigorously boost consumption” and build a “strong domestic market,” alongside improvements to education, health care and social security. But these goals were listed only after the calls for industrial upgrading and tech self-sufficiency – suggesting old priorities still prevail.
And this will disappoint economists who have long urged Beijing to shift from an overt, export-led model and toward a growth model driven more by household consumption.
With local governments mired in debt and facing fiscal strain, there is skepticism that bold social spending or pro-consumption reforms will materialize anytime soon.
With Beijing reinforcing manufacturing even as domestic demand stays weak, the likelihood is extra output will be pushed abroad – especially when it comes to EVs, batteries and solar technologies – rather than be absorbed at home.
Beijing has traditionally portrayed its five-year plans as a boon not only for China but for the world. The official narrative, echoed by state media, emphasizes that a stable, growing China remains an “engine” of global growth and a “stabilizer” amid worldwide uncertainty.
Notably, the new plan calls for “high-level opening-up,” aligning with international trade rules, expanding free-trade zones and encouraging inbound investment – even as it pursues self-reliance.
Yet China’s drive to climb the technological ladder and support its industries will likely intensify competition in global markets – potentially at the expense of other countries’ manufacturers. In recent years, China’s exports have surged to record levels. This flood of cheap Chinese goods has squeezed manufacturers among trading partners from Mexico to Europe, which have begun contemplating protective measures. If Beijing now doubles down on subsidizing both cutting-edge and traditional industries, the result could be an even greater glut of Chinese products globally, exacerbating trade frictions.
In other words, the world may feel more of China’s industrial might but not enough of its buying power – a combination that could strain international economic relations.
A high-stakes bet on the future
With China’s 15th five-year plan, Xi Jinping is making a strategic bet on his long-term vision. There is no doubt that the plan is ambitious and comprehensive. And if successful, it could guide China to technological heights and bolster its claim to great-power status.
But the plan also reveals Beijing’s reluctance to depart from a formula that has yielded growth at the cost of imbalances that have hurt many households across the vast country.
Rather than fundamentally shift course, China is trying to have it all ways: pursuing self-reliance and global integration, professing openness while fortifying itself, and promising prosperity for the people while pouring resources into industry and defense.
But Chinese citizens, whose welfare is ostensibly the plan’s focus, will ultimately judge its success by whether their incomes rise and lives improve by 2030. And that bet faces long odds.
On Thursday, the Dow Jones Index (US30) fell by 0.84%. The S&P 500 Index (US500) dropped by 1.12%. The technology-heavy Nasdaq Index (US100) closed lower by 1.90%. Pressure on the technology sector and companies linked to artificial intelligence once again hit Wall Street sentiment. Weak signals from the labor market exacerbated the tech sell-off. According to Challenger, employers announced 153,000 job cuts in October, the highest figure for this month in 22 years, with a significant portion of the reductions linked to AI adoption and cost optimization. Due to limited official data releases amid the government shutdown, investors were forced to rely on private indicators.
The Mexican peso strengthened above 18.6 per US dollar, rebounding from an eight-week low, as investors digested the latest decision from the Bank of Mexico (Banxico) amid a weakening dollar. As expected, the regulator cut the key interest rate by 25 bps to 7.25% with a 4-to-1 vote, but the accompanying statement was more balanced than some market participants had feared. Domestic inflation continues to slow: the Headline Index hovers around 3.63%, and the Core Index is around 4.24%, which expands the central bank’s room for maneuver.
European stock markets generally declined on Thursday. Germany’s DAX (DE40) fell by 1.31%, France’s CAC 40 (FR 40) closed down by 1.36%, Spain’s IBEX 35 (ES35) gained 0.12%, and the UK’s FTSE 100 (UK100) closed negative 0.42%. The German DAX Index dropped to a one-month low. Sentiment worsened amid renewed concerns about the overstretched valuations of AI-linked companies and the risk of a bubble forming in that segment. Investors were also assessing fresh corporate reports and macro data. German industrial production rose by 1.3% in September after a revised 3.7% drop the previous month, but the pace of recovery was weaker than the 3% consensus prognosis.
The Norges Bank (Central Bank of Norway) maintained its key interest rate at 4%, following a 25 bps cut at the previous meeting, which was in line with market expectations. The regulator noted that no new information has emerged since the September meeting that could significantly alter the expectations for the Norwegian economy. Core inflation remains around 3%, and unemployment has risen slightly. Policymakers stated that a restrictive policy remains warranted. WTI crude oil prices dropped to the $59.3 per barrel area on Thursday, continuing their decline amid new pricing decisions by Saudi Arabia and persistent supply risks. Saudi Aramco lowered its official selling prices for Asian buyers. India, highly dependent on imports, is striving to diversify its sources of crude oil as sanctions risks complicate the purchase of Russian oil. Against this backdrop, even major refiner Reliance is reportedly reselling Middle Eastern oil cargoes – a move considered atypical.
The US natural gas prices (XNG/USD) rose to around $4.30 per million British thermal units (MMBtu), reaching a high since March. The increase was driven by near-record demand for LNG exports: the average gas flow to the eight largest terminals in November hit 17.4 billion cubic feet per day, surpassing the October record. Exports are expected to grow further as Europe continues to seek alternatives to Russian gas, and Asian buyers negotiate long-term supply deals with the US.
Asian markets saw solid gains yesterday. Japan’s Nikkei 225 (JP225) rose by 1.34%, China’s FTSE China A50 (CHA50) climbed by 1.21%, Hong Kong’s Hang Seng (HK50) gained 2.12%, and Australia’s ASX 200 (AU200) recorded a positive result of 0.30%. On Friday, the offshore Chinese yuan weakened to around 7.12 per dollar, pulling back from the previous session’s gain as an unexpected contraction in Chinese exports amplified economic pressure. China’s exports in October 2025 declined for the first time in eight months, falling to the lowest level since February. Shipments to the US fell for the seventh consecutive month by more than 25%. Meanwhile, imports grew at the slowest pace since May and were significantly weaker than market expectations, signaling weak domestic demand and labor market uncertainty.
S&P 500 (US500) 6,720.32 −75.97 (−1.12%)
Dow Jones (US30) 46,912.30 −398.70 (−0.84%)
DAX (DE40) 23,734.02 −315.72 (−1.31%)
FTSE 100 (UK100) 9,735.78 −41.30 (−0.42%)
USD Index 99.70 −0.51% (−0.51%)
News feed for: 2025.11.07
China Trade Balance (m/m) at 05:00 (GMT+2);
German Trade Balance (m/m) at 09:00 (GMT+2);
Mexico Inflation Rate (m/m) at 14:00 (GMT+2);
Canada Unemployment Rate (m/m) at 15:30 (GMT+2);
US Michigan Consumer Sentiment (m/m) at 17:00 (GMT+2).
This article reflects a personal opinion and should not be interpreted as an investment advice, and/or offer, and/or a persistent request for carrying out financial transactions, and/or a guarantee, and/or a forecast of future events.
The USD/JPY pair retreated to 153.10 on Friday, with the yen retaining a portion of its recent gains amid a flight to safety. A sharp uptick in stock market volatility, driven by concerns over a potential overvaluation of artificial intelligence stocks, prompted investors to seek refuge in traditional safe-haven assets, thereby supporting the Japanese currency.
The pair faced additional pressure from a broadly weaker US dollar. Signs of a cooling US labour market have reinforced market expectations of an imminent interest rate cut from the Federal Reserve.
Domestic data from Japan presented a mixed picture. Consumer spending in September rose by a modest 1.8%, following a 2.3% increase in August and falling short of the 2.5% forecast. While nominal wage growth accelerated to 1.9%, real household incomes continued their decline, falling 1.4% year-on-year. This marks the ninth consecutive month of decline in real incomes, highlighting the persistent squeeze on purchasing power.
In light of this, Bank of Japan Governor Kazuo Ueda stated that the central bank’s wage growth forecast for 2026 will be a critical determinant for resuming rate hikes. For now, the BoJ maintains its accommodative stance, leaving monetary policy unchanged.
Technical Analysis: USD/JPY
H4 Chart:
On the H4 chart, USD/JPY is forming a consolidation range around 153.33. We anticipate a near-term expansion of this range to the downside, targeting 152.20. Following this, the primary scenario involves an upward breakout, initiating a new bullish wave towards 155.70. An alternative downward breakout would signal a deeper correction towards 149.90 before any sustained recovery can begin. The MACD indicator supports this view, with its signal line below zero and pointing downward, confirming the current corrective momentum.
H1 Chart:
On the H1 chart, the pair is completing a corrective rise to test 153.50 from below. A tight consolidation range is forming around this level. We expect this range to break downwards initially, with a first target at 152.52. A rebound to 153.50 may follow. The broader trajectory hinges on the subsequent breakout. An upward breakout opens the path to 155.70, while a downward breakout would likely extend the correction towards 149.90. The Stochastic oscillator on the H1 offers a conflicting short-term signal. Its signal line is above 50 and rising towards 80, suggesting the potential for limited near-term upside before the next directional move.
Conclusion
USD/JPY is caught between a weaker US dollar and mixed domestic signals from Japan. The immediate driver is risk sentiment, which has provided the yen with temporary support. Technically, the pair is in a consolidation phase, with a near-term bias for a dip towards 152.20. The medium-term outlook, however, remains tentatively bullish, targeting 155.70, contingent on a successful upside breakout from the current range.
Disclaimer:
Any forecasts contained herein are based on the author’s particular opinion. This analysis may not be treated as trading advice. RoboForex bears no responsibility for trading results based on trading recommendations and reviews contained herein.
DroneShield Ltd. (DRO:ASX; DRSHF:OTC) is rolling out a new airport counter‑drone framework as incursions continue disrupting major aviation hubs. The company is partnering with SRI Group to deliver independent threat assessments for airport operators worldwide.
DroneShield Ltd. (DRO:ASX; DRSHF:OTC) has announced the publication of a new white paper titled Best Practices for Counter-Drone Deployment at Civil Airports, part of a broader effort to address the growing threat of drones to civil aviation. The white paper was released alongside a strategic partnership with SRI Group, an aviation security and technology advisory firm led by former U.S. Transportation Security Administration (TSA) Deputy Administrator John Halinski. According to DroneShield, the initiative aims to guide airport operators and regulatory bodies in implementing practical, technology-driven frameworks to counter drone-related disruptions.
SRI Group will support the initiative by providing airport operators with vendor-neutral Counter-Unmanned Aircraft Systems (C-UAS) Threat and Risk Assessments. The assessments are designed to identify vulnerabilities, guide mitigation strategies, and offer independent insights that inform procurement decisions. In September 2025, Copenhagen Airport, the busiest aviation hub in Scandinavia, was forced to shut down for nearly four hours due to unauthorized drone activity. The incident caused 77 flight cancellations and 217 delays, underscoring the urgency of airport drone threat mitigation.
“This is about more than technology, it’s about leadership,” said DroneShield CEO Oleg Vornik in the announcement. Halinski added that DroneShield’s efforts “show a real commitment to the safety of airports and the passengers they serve.” The partnership will also be on display at the upcoming Airports Council World Annual Assembly in Canada, where airport executives can begin the drone threat assessment process and receive tailored recommendations from SRI Group.
DroneShield has also reported significant operational milestones for the third quarter of 2025. Quarterly revenue reached AU$92.9 million, marking a 1,091% year-over-year increase, with cash receipts totaling AU$77.4 million. Year-to-date secured revenues have reached AU$193.1 million, compared to AU$57.5 million for all of 2024.
Security Pressures Drive Growth in Counter‑Drone Detection
The same report noted that airports, border zones, and major infrastructure were increasingly integrating anti‑drone systems due to unauthorized incursions. It also stated that drone detection ecosystems incorporated “radar, radio frequency sensors, electro-optical and infrared cameras, acoustic arrays, and artificial intelligence analytics” to enhance situational awareness. Markets and Markets added that system providers were focusing on “enhancing detection accuracy, minimizing false alarms, and optimizing system interoperability” as part of sector competition.
On November 3, Bell Potter Securities reiterated its Buy rating on DroneShield and maintained a 12-month price target of AU$5.30 per share.
Officials said the effort “strengthen[ed] the Indian Army’s response capability against evolving aerial threats” and allowed experimentation with indigenous technologies. The Defense Ministry stated that the exercise validated preparedness for next‑generation warfare by integrating aerial and ground assets and testing multi‑domain command and control.
Concerns around elevated security environments continued through global reporting. On November 3, The U.S. Sun detailed how unidentified drones were observed twice in 24 hours above the Kleine‑Brogel air base in Belgium. Belgian Defense Minister Theo Francken said the flights were “not a typical overflight, but a clear mission targeting Kleine Brogel,” and he urged additional counter‑UAS resources after jammer responses “proved ineffective.” He explained that security forces increased vigilance as the incidents involved “larger drones flying at higher altitudes” over a strategically sensitive location. The reporting referenced multiple recent drone‑related disruptions affecting European airports and military installations.
Analyst Endorsements Support Long-Term Value Proposition
Akra also drew attention to DroneShield’s strategic fit with regional defense initiatives, including a proposed multi-country “drone wall” in Eastern Europe. He identified the company as a leading contender to supply technology for such programs as they continue to take shape.
On November 3, Bell Potter Securities reiterated its Buy rating on DroneShield and maintained a 12-month price target of AU$5.30 per share. The report, authored by analyst Baxter Kirk, projected a total expected return of 38.4% and highlighted several key drivers of confidence in the company’s outlook.
According to Bell Potter, DroneShield had secured a US$25.3 million contract from a defense customer in Latin America. Kirk wrote that before this contract signing, the firm’s CY25 revenue forecasts of US$200 million were “97% secured.”
Kirk emphasized DroneShield’s technological advantage, stating, “We believe DRO has the market-leading counter-drone offering and a strengthening competitive advantage owing to its years of experience and large R&D team, focused on detection and defeat capabilities.” He also noted the broader industry context, pointing out that 2026 could represent “an inflection point for the global counter-drone industry” as governments allocate increased funding for soft-kill solutions.
The report referenced the company’s active sales pipeline of US$2.55 billion and the expectation that “material contracts” could result over the following three to six months. Bell Potter’s valuation was based on a blended discounted cash flow model, combining both base and bull case scenarios. The target price of AU$5.30 represented a 19% upside to the share price at the time of publication.
Expanding Threats, Expanding Opportunity
DroneShield is positioning itself as a first responder to the rising operational risks posed by drone incursions in civil aviation, as outlined in its October 2025 Investor Presentation. The newly launched SentryCiv product, offered as a subscription-only solution for civilian infrastructure such as airports, plays a central role in the company’s strategy to expand its presence in non-military markets. SentryCiv was designed to be cashflow positive from the outset, and management expects the civilian segment to account for up to 50% of overall revenue within five years.
Software-as-a-service (SaaS) is becoming increasingly important to DroneShield’s business model, with third-quarter SaaS revenues growing by 400% year-over-year. The company aims to integrate multiple SaaS modules into its deployed hardware, including products like DroneSentry-C2 and DroneOptID. This shift is supported by growing demand from government and infrastructure clients for modular, software-driven counter-UAS systems that can evolve alongside the threat landscape.
From a strategic standpoint, DroneShield continues to build out its global manufacturing footprint. A new 3,000-square-meter production facility in Sydney is being established, with European and U.S. facilities expected to follow in 2026. These expansions are aimed at increasing annual production capacity from the current US$500 million equivalent to US$2.4 billion by the end of 2026.
Streetwise Ownership Overview*
DroneShield Ltd. (DRO:ASX; DRSHF:OTC)
Retail: 77.68%
Substantial holders over 5%: 21.02%
Management and Insiders: 1.3%
*Share Structure as of 10/27/2025
The company’s AU$2.55 billion pipeline includes more than 300 potential projects across geographies and customer types, including 307 expected to materialize in 2025 and 2026. With the release of its latest white paper, strategic partnerships, SaaS-driven offerings, and recent recognition for technical innovation, DroneShield appears to be consolidating its position as a go-to integrator and thought leader in counter-drone strategy.
Ownership and Share Structure1
Recent filings reveal that Vanguard Group has become a substantial shareholder in DroneShield, holding a 5.45% stake, Fidelity Management and Research holds approximately 7.49% and State Street Corporation holds approximately 5.35%.
Management and insiders hold 1.30%, according to the company.
DroneShield has 905.97 million outstanding shares and 863.8M free float traded shares. Its market cap is AU$3B. Its 52-week range is AU$0.58–AU$6.70 per share.
Important Disclosures:
As of the date of this article, officers and/or employees of Streetwise Reports LLC (including members of their household) own securities of Droneshield.
James Guttman wrote this article for Streetwise Reports LLC and provides services to Streetwise Reports as an employee.
This article does not constitute investment advice and is not a solicitation for any investment. Streetwise Reports does not render general or specific investment advice and the information on Streetwise Reports should not be considered a recommendation to buy or sell any security. Each reader is encouraged to consult with his or her personal financial adviser and perform their own comprehensive investment research. By opening this page, each reader accepts and agrees to Streetwise Reports’ terms of use and full legal disclaimer. Streetwise Reports does not endorse or recommend the business, products, services or securities of any company.
The information listed above was updated on the date this article was published and was compiled from information from the company and various other data providers.
Red Cloud Securities has a bullish outlook on gold, silver, copper and zinc now and through at least 2027, analysts noted in a thematic report.
Red Cloud Securities raised its gold, silver, copper, and zinc forecasts for Q4/25, 2026, and 2027, its mining analysts reported in their Q4/25 Commodity Price Update dated Oct. 10.
“A remarkable precious metals run shows no signs of abating,” the analysts wrote. “We are bullish on copper long term and have a solid outlook on zinc.”
The analysts explained the rationale for their higher estimates in each metal.
‘Gold Cold War’
The gold price has been breaking record after record in its current multiyear rally. This year alone, it is up 61%. Capital continues to flood into the yellow metal from central banks and investors.
“Central banks remain voracious buyers, led by China’s aggressive accumulation of reserves and its new effort to position the Shanghai Gold Exchange as a global custodian for sovereign bullion,” the analysts wrote.
As for investors, they have flocked to gold, given its safe-haven status, in the face of mounting global economic and geopolitical uncertainty.
Meanwhile, we are in a global dedollarization cycle without an end in sight, fueled by trade tensions, uncertainty about the long-term dominance of the U.S. dollar, and outflows of capital from the U.S.
“In our view, this is no longer just a bull market,” the analysts wrote. “It’s the opening phase of a global ‘Gold Cold War,’ where nations compete for monetary security, investors seek protection from policy volatility, and the metal’s long-term trajectory looks decisively higher.”
Also, the analysts expect future rate cuts by the U.S. Federal Reserve, rising inflation, and, ultimately, a weaker U.S. dollar. Anticipating these factors will “remain in place,” they raised their gold price for Q4/24, 2026, and 2027 and beyond by about $100/oz.
Silver Outperforms Gold
Silver is up 84% year to date, and since May, it has outperformed gold. This is evidenced by the gold:silver ratio dropping to about 80:1 from roughly 100:1 during that time period.
“We are increasingly bullish on silver,” wrote the analysts. “We expect the silver price to continue to keep pace with gold.”
Looming Copper Deficit
The London Metal Exchange (LME) copper price rose about 22% this year to around $4.80 per pound ($4.80/lb). Accidents and disruptions at major mines in Chile, Indonesia, and the Democratic Republic of the Congo caused the recent run in copper prices.
Looking ahead, the analysts forecast a 6% decrease in U.S. copper demand next year, driven by U.S. trade wars and plummeting consumer demand.
“We see near-term price support and a rapid shift back to a deficit in 2027 as the global grid build-out continues to cope with the rise of artificial intelligence,” the analysts wrote.
Zinc Supply to Increase
Red Cloud analysts’ long-term zinc price is $1.30/lb, about where the London Metal Exchange zinc price is now.
Near-term availability of the metal is tight. However, mine supply of zinc is expected to grow over the next two years and peak in 2027, thanks to new projects coming online.
Lithium in Oversupply
During the summer, lithium carbonate and spodumene prices dropped to multiyear lows of about US$8,000 per ton ($8,000/t) and US$600/t, respectively. In August, they began moving up after supply disruptions at some Chinese mining operations. Since lithium carbonate has traded between US$9,000 and US$10,000/t.
“On continued oversupply concerns and weak demand in the short term, we are reducing our forecast for 2026 but leaving 2027 and beyond prices unchanged,” wrote the analysts. “We are also increasing our spodumene concentrate prices slightly.”
They pointed out that the premium lithium hydroxide had over lithium carbonate has had historically no longer exists.
“Constantly evolving battery technologies have prompted Chinese lithium producers to build flexibility into their production lines, allowing shifts in production between hydroxide and carbonate based on battery demand,” the analysts explained.
Here is a chart of Red Cloud’s updated metals forecasts:
Favorite Names Now
In their report, the Red Cloud analysts pointed out their Top Picks. They are:
Blackrock Silver Corp. (BRC:TSX.V; BKRRF:OTCQX)
Kootenay Silver Inc. (KTN:TSX.V)
Koryx Copper Inc. (KRY:TSX.V; KRYXF:OTCMKTS)
Northisle Copper and Gold Inc. (NCX:TSX; NTCPF:OTCPK)
As of the date of this article, officers, contractors, shareholders, and/or employees of Streetwise Reports LLC (including members of their household) own securities of Outcrop Silver & Gold Corp.
Doresa Banning wrote this article for Streetwise Reports LLC and provides services to Streetwise Reports as an independent contractor.
This article does not constitute investment advice and is not a solicitation for any investment. Streetwise Reports does not render general or specific investment advice and the information on Streetwise Reports should not be considered a recommendation to buy or sell any security. Each reader is encouraged to consult with his or her personal financial adviser and perform their own comprehensive investment research. By opening this page, each reader accepts and agrees to Streetwise Reports’ terms of use and full legal disclaimer. Streetwise Reports does not endorse or recommend the business, products, services or securities of any company.
Disclosures for Red Cloud Securities, October 20, 2025
Disclosure Statement Updated October 20, 2025 Disclosure Requirement Red Cloud Securities Inc. is registered as an Investment Dealer and is a member of the Canadian Investment Regulatory Organization (CIRO). Red Cloud Securities registration as an Investment Dealer is specific to the provinces of Alberta, British Columbia, Manitoba, Ontario, Quebec, and Saskatchewan. We are registered and authorized to conduct business solely within these jurisdictions. We do not operate in or hold registration in any other regions, territories, or countries outside of these provinces. Red Cloud Securities bears no liability for any consequences arising from the use or misuse of our services, products, or information outside the registered jurisdictions. Part of Red Cloud Securities Inc.’s business is to connect mining companies with suitable investors. Red Cloud Securities Inc., its affiliates and their respective officers, directors, representatives, researchers and members of their families may hold positions in the companies mentioned in this document and may buy and/or sell their securities. Additionally, Red Cloud Securities Inc. may have provided in the past, and may provide in the future, certain advisory or corporate finance services and receive financial and other incentives from issuers as consideration for the provision of such services. Red Cloud Securities Inc. has prepared this document for general information purposes only. This document should not be considered a solicitation to purchase or sell securities or a recommendation to buy or sell securities. The information provided has been derived from sources believed to be accurate but cannot be guaranteed. This document does not take into account the particular investment objectives, financial situations, or needs of individual recipients and other issues (e.g. prohibitions to investments due to law, jurisdiction issues, etc.) which may exist for certain persons. Recipients should rely on their own investigations and take their own professional advice before investment. Red Cloud Securities Inc. will not treat recipients of this document as clients by virtue of having viewed this document. Red Cloud Securities Inc. takes no responsibility for any errors or omissions contained herein, and accepts no legal responsibility for any errors or omissions contained herein, and accepts no legal responsibility from any losses resulting from investment decisions based on the content of this report. Company Specific Disclosure Details
Company Name Ticker Disclosures Company Name Ticker Disclosures Aftermath Silver Ltd. TSXV:AAG Kesselrun Resources Ltd. TSXV:KES Aldebaran Resources Inc. TSXV:ALDE 1,2 Kootenay Silver Inc. TSXV:KTN 1,2,3 Alkane Resources Ltd TSX:ALK Koryx Copper Inc. TSXV:KRY 3 Apollo Silver Corp. TSXV:APGO 3 Loncor Gold Inc. TSX:LN 3 Argentina Lithium & Energy Corp. TSXV:LIT 3 Lumina Gold Corp. TSXV:LUM Aris Mining Corporation TSX:ARIS 1,2 Major Drilling Group International Inc. TSX:MDI Aurion Resources Ltd. TSXV:AU 3 NeXGold Mining Corp. TSXV:NEXG 3 Aztec Minerals Corp. TSXV:AZT 3 NorthIsle Copper and Gold Inc. TSXV:NCX 1,2,3 Blackrock Silver Corp. TSXV:BRC 1,2,3 Orosur Mining Inc. TSXV:OMI 3 Borealis Mining Company Limited TSXV:BOGO 3 Outcrop Silver & Gold Corporation TSXV:OCG 3 Brunswick Exploration Inc. TSXV:BRW 3 Seabridge Gold Inc. TSX:SEA 1,2,3 Cassiar Gold Corp. TSXV:GLDC 3 Silver Storm Mining Ltd. TSXV:SVRS 3 Cerrado Gold Inc. TSXV:CERT 7 Silver Viper Minerals Corp. TSXV:VIPR 3,6 Critical Elements Lithium Corporation TSXV:CRE Silver X Mining Corp. TSXV:AGX 3 Defiance Silver Corp. TSXV:DEF 3,8 SolGold Plc LSE:SOLG Denarius Metals Corp. NEOE:DMET 3 Southern Cross Gold Consolidated Ltd. TSX:SXGC 3 Empress Royalty Corp. TSXV:EMPR Southern Silver Exploration Corp. TSXV:SSV 1,2,3 Excellon Resources Inc. TSXV:EXN 3 Spanish Mountain Gold Ltd. TSXV:SPA 3 Falco Resources Ltd. TSXV:FPC Strickland Metals Limited ASX:STK 1,2 Galleon Gold Corp. TSXV:GGO Torex Gold Resources Inc. TSX:TXG 1,2 GR Silver Mining Ltd. TSXV:GRSL 1,2,3 Troilus Gold Corp. TSX:TLG 3 Grid Metals Corp. TSXV:GRDM 1,2 West Red Lake Gold Mines Ltd. TSXV:WRLG 1,2 Jaguar Mining Inc. TSX:JAG 3 Westhaven Gold Corp. TSXV:WHN 1,2,3 Japan Gold Corp. TSXV:JG 3
1. The analyst has visited the head/principal office of the issuer or has viewed its material operations. 2. The issuer paid for or reimbursed the analyst for a portion, or all of the travel expense associated with a visit. 3. In the last 12 months preceding the date of issuance of the research report or recommendation, Red Cloud Securities Inc. has performed investment banking services for the issuer. 4. In the last 12 months, a partner, director or officer of Red Cloud Securities Inc., or an analyst involved in the preparation of the research report has provided services other than in the normal course investment advisory or trade execution services to the issuer for remuneration. 5. An analyst who prepared or participated in the preparation of this research report has an ownership position (long or short) in, or discretion or control over an account holding, the issuer’s securities, directly or indirectly. 6. Red Cloud Securities Inc. and its affiliates collectively beneficially own 1% or more of a class of the issuer’s equity securities. 7. Robert Sellars, who is a partner, director, officer, employee or agent of Red Cloud Securities Inc., serves as a partner, director, officer or employee of (or in an equivalent advisory capacity to) the issuer. 8. Red Cloud Securities Inc. is a market maker in the equity of the issuer. 9. There are material conflicts of interest with Red Cloud Securities Inc. or the analyst who prepared or participated in the preparation of the research report, and the issuer. Analysts are compensated through a combined base salary and bonus payout system. The bonus payout is determined by revenues generated from various departments including Investment Banking, based on a system that includes the following criteria: reports generated, timeliness, performance of recommendations, knowledge of industry, quality of research and client feedback. Analysts are not directly compensated for specific Investment Banking transactions.
Recommendation Terminology Red Cloud Securities Inc. recommendation terminology is as follows: • BUY – expected to outperform its peer group • HOLD – expected to perform with its peer group • SELL – expected to underperform its peer group • Tender – clients are advised to tender their shares to a takeover bid • Not Rated or NA – currently restricted from publishing, or we do not yet have a rating • Under Review – our rating and target are under review pending, prior estimates and rating should be disregarded. Companies with BUY, HOLD or SELL recommendations may not have target prices associated with a recommendation. Recommendations without a target price are more speculative in nature and may be followed by “(S)” or “(Speculative)” to reflect the higher degree of risk associated with the company. Additionally, our target prices are set based on a 12-month investment horizon. Dissemination Red Cloud Securities Inc. distributes its research products simultaneously, via email, to its authorized client base. All research is then available on www.redcloudsecurities.com via login and password. Analyst Certification Any Red Cloud Securities Inc. research analyst named on this report hereby certifies that the recommendations and/or opinions expressed herein accurately reflect such research analyst’s personal views about the companies and securities that are the subject of this report. In addition, no part of any research analyst’s compensation is, or will be, directly or indirectly, related to the specific recommendations or views expressed by such research analyst in this report.
On Wednesday, the Dow Jones Index (US30) rose by 0.48%. The S&P 500 Index (US500) gained 0.37%. The technology-heavy Nasdaq Index (US100) closed higher by 0.65%. A positive factor for the market was the skeptical stance of the US Supreme Court regarding the case on Donald Trump’s “reciprocal tariffs,” which reduced the likelihood of their premature application. Against this backdrop, market participants cut their bets on the Supreme Court upholding the imposed tariffs. Further support for risk appetite came from stronger-than-expected employment data: the ADP report showed a moderate job gain of about 42,000, and the ISM Services PMI rose to an eight-month high, signaling continued economic resilience.
The Canadian dollar weakened to 1.41 CAD per US Dollar, nearing a seven-month low, amid the further strengthening of the US currency and heightened trade uncertainty. An additional factor was the announcement of the new federal budget, which will see the deficit more than double to approximately 78.3 billion CAD this year. This significant expansion of fiscal spending eases financial conditions but increases pressure on the currency amid an already weak macroeconomic outlook.
European stock markets grew steadily on Wednesday. Germany’s DAX (DE40) rose by 0.42%, France’s CAC 40 (FR40) closed up by 0.08%, Spain’s IBEX 35 (ES35) gained 0.39%, and the UK’s FTSE 100 (UK100) closed up by 0.64%.
The Swedish Central Bank (Riksbank), as expected, left its key interest rate unchanged at 1.75% at its October meeting, adhering to a course of supporting economic activity and gradually returning inflation to its medium-term target of 2%. The regulator indicated that the borrowing cost is likely to remain unchanged in the near term. Economic growth in the third quarter was slightly above expectations, but the labor market continues to signal weakness. The Swiss franc traded near 0.81 per US dollar, remaining near its maximum levels since 2011, amid increased demand for safe-haven assets and expectations that the Swiss National Bank (SNB) will refrain from cutting rates in the near future. Simultaneously, softer-than-expectations inflation data in Switzerland renewed discussions about the possibility of further policy easing, which could theoretically return rates to negative territory. However, the SNB leadership is exercising caution, citing risks to financial stability.
WTI crude oil prices dropped to the $60 per barrel area. Concerns over excess supply and sluggish demand continued to weigh on the market. According to the US Energy Information Administration (EIA), crude oil inventories rose by 5.202 million barrels for the week – the largest increase since July. Pressure on prices is intensified by rising production from both OPEC+ countries and non-OPEC producers, fueling concerns about a global market glut. Asian markets also declined yesterday. Japan’s Nikkei 225 (JP225) fell by 2.50%, China’s FTSE China A50 (CHA50) dropped by 0.01%, Hong Kong’s Hang Seng (HK50) declined by 0.07%, and Australia’s ASX 200 (AU200) showed a negative result of 0.13%.
Australia’s trade surplus expanded to 3.94 billion AUD in September, compared to a revised 1.11 billion AUD in August, and exceeded the prognosis of 3.85 billion AUD. The increase was driven by a 7.9% jump in exports, primarily due to increased shipments of gold amidst rising prices for the precious metal. Meanwhile, imports rose by 1.1% and reached a record level, supported by an increase in the inflow of capital goods.
S&P 500 (US500) 6,796.29 +24.74 (+0.37%)
Dow Jones (US30) 47,311.00 +225.76 (+0.48%)
DAX (DE40) 24,049.74 +100.63 (+0.42%)
FTSE 100 (UK100) 9,777.08 +62.12 (+0.64%)
USD Index 100.16 -0.06% (-0.06%)
News feed for: 2025.11.06
Japan Average Cash Earnings (m/m) at 01:30 (GMT+2);
Japan Services PMI (m/m) at 02:30 (GMT+2);
Australia Trade Balance (m/m) at 02:30 (GMT+2);
German Industrial Production (m/m) at 09:00 (GMT+2);
Sweden Inflation Rate at 09:00 (GMT+2);
Switzerland Unemployment Rate (m/m) at 10:00 (GMT+2);
This article reflects a personal opinion and should not be interpreted as an investment advice, and/or offer, and/or a persistent request for carrying out financial transactions, and/or a guarantee, and/or a forecast of future events.
The GBP/USD pair is attempting to find support around 1.3062 on Thursday, with investors cautiously positioning themselves ahead of today’s pivotal Bank of England (BoE) monetary policy meeting. The British currency remains under pressure, trading near a seven-month low against the US dollar and at its weakest level in over two years against the euro.
Market pricing currently implies roughly a one-in-three chance of a 25-basis-point rate cut from the BoE. This uncertainty creates significant asymmetric risk, meaning the pound is poised for a sharp move in either direction once the decision and accompanying statement are released.
The pound’s weakness was compounded by the recent release of softer-than-expected UK inflation data, which bolstered expectations for an imminent shift towards policy easing. A simultaneous global sell-off in equity markets, particularly in the tech sector, has further dampened sentiment by reducing appetite for risk-sensitive assets such as sterling.
Adding to the headwinds, investor focus is shifting to the UK budget, due for approval later this month. Chancellor Rachel Reeves has signalled the potential for tax rises, a measure that could stifle economic growth and potentially prompt the BoE to adopt a more dovish stance – another factor weighing on the currency.
Technical Analysis: GBP/USD
H4 Chart:
On the H4 chart, GBP/USD broke downwards from a consolidation range around 1.3140, completing a bearish wave to 1.3010. We now anticipate a technical correction towards 1.3090. Following this pullback, the primary downtrend is expected to resume, with the next key targets at 1.2910 and, ultimately, 1.2811. The MACD indicator supports this bearish outlook. While its signal line is at deeply oversold levels and has diverged from its histogram, suggesting the potential for a short-term corrective rise, the overall structure remains negative.
H1 Chart:
On the H1 chart, the pair similarly broke down from a range around 1.3157, reaching the 1.3010 target. A corrective retracement to test 1.3100 from below is now expected. Once this correction is complete, the downtrend is likely to extend towards at least 1.2950. The Stochastic oscillator aligns with this view. Its signal line is in overbought territory above 80 and appears poised to turn down towards 20, indicating that any near-term strength is likely corrective before selling pressure reasserts itself.
Conclusion
GBP/USD is stabilising at multi-month lows ahead of a high-stakes BoE meeting. The combination of dovish inflation data, a risk-off market mood, and looming fiscal uncertainty has created a profoundly negative backdrop for sterling. Technically, the path of least resistance remains downward. While a short-covering bounce back towards 1.3100 is possible post-decision, the broader trend suggests further losses, with key targets at 1.2910 and 1.2811.
Disclaimer:
Any forecasts contained herein are based on the author’s particular opinion. This analysis may not be treated as trading advice. RoboForex bears no responsibility for trading results based on trading recommendations and reviews contained herein.


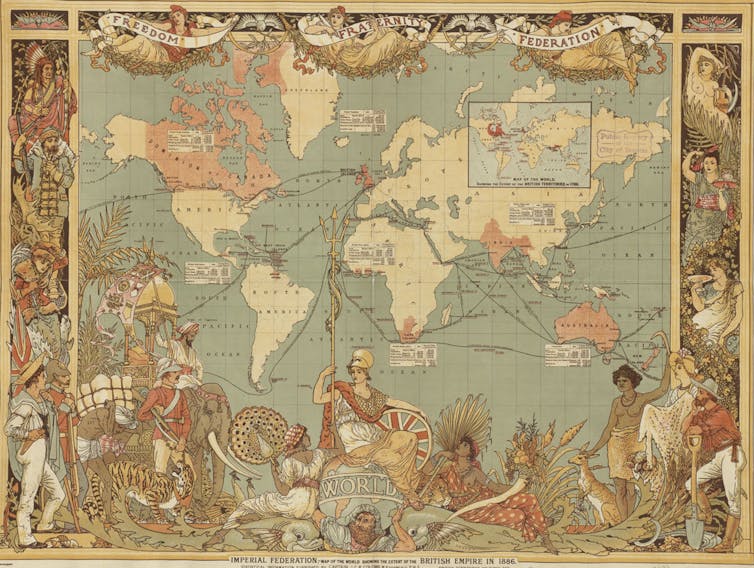 A world map showing the extent of the British Empire in 1886.


.jpg)