By Sergi Basco
Booms and busts are a recurring feature of modern economics, but when an asset’s value becomes overinflated, a boom quickly becomes a bubble.
The two most recent major bubble episodes were the dot-com bubble in the United States (1996-2000) and the housing bubbles that emerged around 2006 in different countries. Both ended in recession – the former relatively mild, and the latter catastrophically bad. Recent, dizzying increases in the stock prices of AI-related companies have now got many investors asking “are we witnessing another asset price bubble?”
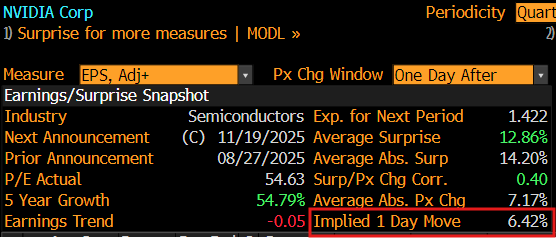
It is important to put the current AI boom in context. The stock price of Nvidia – which manufactures many of the computer chips that power the AI industry – has multiplied by 13 since the start of 2023. Stocks in other AI-related companies like Microsoft and Google’s parent company Alphabet have multiplied by 2.1 and 3.2, respectively. In comparison, the S&P 500, which tracks the stocks of the most important US firms, has multiplied by just 1.8 in the same period.
It is important to emphasise that these AI-related companies are included in the S&P 500, making the difference with non-AI companies even larger. Accordingly, it seems that there is an AI-bubble – but it won’t necessarily end in a repeat of 2008.
How a bubble forms
The price of any stock can be broken down into two components: its fundamental value, and the inflated bubble value. If the stock’s price is above its fundamental value, there is a bubble in its price.
The fundamental value of an asset is the discounted sum of its expected future dividends. The key word here is “expected”. Given that no one, not even ChatGPT, can predict the future, the fundamental value depends on the subjective expectations of each investor. They might be optimistic or pessimistic; in time, some will be proven right, and others wrong.
Optimistic investors expect that AI will change the world, and that the owners of this technology will make (almost) infinite profits. Not knowing which company will emerge victorious, they invest in all AI-related companies.
In contrast, pessimistic investors think that AI is just sophisticated software, as opposed to truly groundbreaking technology, and they will see bubbles everywhere.
A third possibility is the more sophisticated investors. These are people that think – or know – that there is a bubble, but keep investing in the hope of being able to ride the wave and get off before it is too late.
The last of these possibilities is reminiscent of the infamous quote from Citigroup CEO Chuck Prince before the 2008 housing bubble burst: “as long as the music is playing, you’ve got to get up and dance”.
As an economist, I can say safely that it is impossible for all AI-related companies to end up dominating the market. This means, beyond a doubt, that the value of at least some AI-related stocks have a large bubble component.
A shortage of assets
Asset price bubbles can be the market’s natural response to a shortage of assets. In a moment when the demand for assets exceeds the supply (especially for safe assets like government bonds), there is room for other, newer assets to emerge.
This pattern explains the emergence of, for example, the 1990s dot-com bubble and the subsequent 2000s housing bubble. In that context, the growing role of China in financial markets increased the demand for assets in the West – the money first went to dot-com companies in the 1990s and, when that bubble burst, to fund housing via mortgage-backed securities.
In today’s context, a combination of factors have paved the way for the AI bubble: excitement around new technology, low interest rates (another sign of shortage of assets) and huge amounts of of cash flowing into large corporations.
The bubble bursts: good, bad and ugly scenarios
At the very least, part of the soaring value of AI-related stocks is a bubble – and a bubble cannot stay inflated forever. It has to either burst on its own, or, ideally, be carefully deflated through targeted government or Central Bank measures. The current AI bubble could end in one of three scenarios: good, bad, or ugly.
Good: boom not bubble
During the dot-com bubble, many bad firms received too much money – the classic example was Pets.com. But the bubble also provided financing to companies like Google, which (arguably) contributed to making the internet a productivity-enhancing technology.
Something similar may happen with AI, as the current flurry of investment could, in the long run, create something good: technology that benefits humanity, and eventually yields return on investment. Without bubble-levels of cashflow, it would not be funded.
In this optimistic scenario I am assuming that AI, even though it may displace some jobs in the short term (as most technology does), will turn out to be good for workers. I am also assuming that it, obviously, won’t lead to the extinction of humanity. For this to be the case, governments need to introduce proper, robust regulations. It is also important to emphasise that there is no need for countries to invent or invest in new technologies – they must adapt them and provide applications to make them useful.
Bad: a gentle burst
All bubbles eventually burst. As things stand, we do not know when this will happen, nor the extent of the potential damage, but there will probably be a market correction when enough investors realise that multiple companies are overvalued. This decline in the stock market is bound to cause a recession.
Hopefully, it will be short-lived like the 2001 recession that followed the burst of the dot-com bubble. While no recession is painless, this one was relatively mild, and lasted less than one year in the US.
However, the burst of the AI bubble may be more painful because more households participate (either directly or indirectly via mutual funds) in the stock market than 20 years ago.
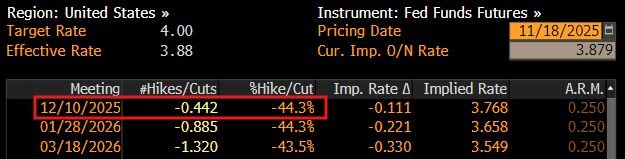
Even though the job of Central Banks is not to control asset prices, they may need to consider raising interest rates to deflate the bubble before it gets too large. The more sudden the crash, the deeper and costlier any ensuing recession will be.
Ugly: crash and burn
The burst of the AI-bubble would be ugly if it shares more features than we imagine with the 2000s housing bubble. On the positive side, AI stocks are not houses. This is good because when housing bubbles burst, the impacts on the economy are larger and longer-lasting than with other assets.
The housing bubble alone did not cause the 2008 financial crisis – it also caused the global financial system to collapse. Another reason to be optimistic is that the role of commercial banks in AI finance is much smaller than in housing – a vast amount of every bank’s money is perpetually tied up in mortgages.
However, one important caveat is that we do not how the financial system will react if these huge AI companies default on their debt. Alarmingly, this seems to be how they are currently financing new investments – a recent Bank of America analysis warned that large tech companies are relying heavily on debt to build new data centres, many of which are to cover demand that doesn’t actually exist yet.

A weekly e-mail in English featuring expertise from scholars and researchers. It provides an introduction to the diversity of research coming out of the continent and considers some of the key issues facing European countries. Get the newsletter!![]()
Sergi Basco, Profesor Agregado de Economia, Universitat de Barcelona
This article is republished from The Conversation under a Creative Commons license. Read the original article.