The BTC has been growing for three days in a row, and on Monday is consolidating near $30,445. Meanwhile, since the beginning of the year, it has already lost 52% and 58.2% of the high of 28 March. For the past 8 weeks, the BTC has been mostly losing.
Here, we should remind you of the serious correlation that exists between the crypto market and the US stock market. Between the S&P 500, Nasdaq and the BTC there is a definite correlation. The market remains turbulent due to the toughening of the monetary policy by the Federal Reserve system. The Fed is serious about beating inflation and uses all possible mechanisms to reach this goal.
By the way, that past week became the seventh negative one in a row for the S&P 500. This is the longest negative phase for the index since 2001.
Capitalisation of the crypto market is now estimated as $1.288 trillion. The BTC makes up for 44.5% of it and the ETH – 19%.
The tech picture of the BTC looks as follows. The protection area remains between $29,000 USD and $30,000, and the past week demonstrated the stability of the area. However, while the BTC is close to it, it can still drop to $20,000. The demand for risky assets is quite unlikely to return any time soon. However, if the miracle does happen, and we see energetic buys in the BTC, it will need to secure above $32,700 to reverse the trend.
Over these past 24 hours, out of the Top 10 cryptocurrencies, capitalisation increased most noticeably in the ETH (+3.07%), ADA (+3.18%), and SOL (+4.15%). DOGE (+1.96%), BNB (+2.05%), and BTC (+2.08%) are somewhat dragging behind. Investors have calmed down a bit, the market has accounted for the possible steps that the Fed might take against inflation, and decided to take a rest.
Ethereum: switching to Proof-of-Stake
In June already, Ethereum will change the mechanism of its main test public network Ropsten to Proof-of-Stake. This is an important step toward implementing this mechanism in the whole Ethereum network. Ropsten is expected to introduce it in two steps. The first one will be made on 30 May and the second one – on 8 June. This is good fundamental news for the ETH.
As was thought, the Terra story is just beginning. Now the prosecution services of South Korea are going to check the company for evidence of a financial pyramid. After several investors announced they were going to sue the company for the recent decline in the token price, this news does not look surprising. Specifically, the prosecutor is interested in whether the Anchor Protocol that promises the owners of TerraUSD 20% of annual profit should be charged for the criminal offence.
Attention! Forecasts presented in this section only reflect the author’s private opinion and should not be considered as guidance for trading. RoboForex LP bears no responsibility for trading results based on trading recommendations described in these analytical reviews.
According to the latest Eurostat data, consumer confidence in Europe is declining. ECB representative Visco believes that Europe may face a moderate recession, which may worsen depending on the circumstances related to the war in Ukraine. Asked about a 50 basis point interest rate hike, Visco said the ECB should come out of negative rates without adding uncertainty to the market. Analysts are confident that the ECB will start raising rates this summer. This is the reason why the euro has started to strengthen, as future scenarios are always priced in.
Trading recommendations
Support levels: 1.0545, 1.0509, 1.0445, 1.0379, 1.0342
From a technical point of view, the trend on the EUR/USD currency pair on the hourly time frame has changed to bullish. The price broke through the priority change level and consolidated above the moving averages. The MACD indicator became positive, but a divergence appeared. Under such market conditions, investors can look for buy trades on intraday time frames from the support level of 1.0545, but only with short targets and confirmation. Sell trades can be considered from the resistance level of 1.0595, but only after the additional confirmation.
Alternative scenario: if the price breaks out through the 1.0445 support level and fixes below, the downtrend will likely resume.
News feed for 2022.05.23:
– Eurozone Germany Ifo Business Climate (m/m) at 11:00 (GMT+3);
– Eurozone Eurogroup Meetings (Tentative).
The GBP/USD currency pair
Technical indicators of the currency pair:
Prev Open: 1.2461
Prev Close: 1.2491
% chg. over the last day: +0.24%
Former Bank of England Governor Mervyn King criticized central banks, including the Bank of England, blaming them for the cost of living crisis, fueling rising inflation, and printing hundreds of billions of pounds and dollars during the pandemic. At the same time, Lord King added that the British should prepare for a “very unpleasant period,” as a sharp rise in interest rates would hit the economy very hard. According to the former governor, interest rates have been kept too low for too long, with too much “quantitative easing” (QE) when banks print money to pump up the economy.
Trading recommendations
Support levels: 1.2485, 1.2437, 1.2398, 1.2283, 1.2199
Resistance levels: 1.2602, 1.2695, 1.2792, 1.2981
On the hourly time frame, the GBP/USD currency pair trend changed to bullish. The MACD indicator became positive, but divergence appeared. Under such market conditions, buy deals may be considered from the support level of 1.2485, but only with additional confirmation. Sell deals should be looked for from the resistance level of 1.2602, but with confirmation in the form of sellers’ initiative.
Alternative scenario: if the price breaks down through the 1.2282 support level and fixes below, the mid-term downtrend will likely be resumed.
News feed for 2022.05.23:
– UK BoE Gov Bailey Speaks at 19:15 (GMT+3).
The USD/JPY currency pair
Technical indicators of the currency pair:
Prev Open: 127.70
Prev Close: 127.91
% chg. over the last day: +0.16%
A conflict between the government and the Bank of Japan is growing in Japan. Japanese Prime Minister Kishida believes that rising commodity prices and a weak yen are negatively affecting households and businesses. In turn, Bank of Japan Governor Kuroda said that the Bank of Japan will continue with its soft monetary policy, as inflation is still unsustainable, even if it has reached the target level.
The medium-term trend on the USD/JPY currency is bearish. The MACD indicator is in the negative zone, but sellers’ pressure is getting weaker; there are signs of divergence. Buy trades can be considered from the support level of 127.46, but with confirmation. For sell deals, resistance level of 127.94 may be considered, but only with additional confirmation.
Alternative scenario: If the price fixes above 129.07, the uptrend will likely be resumed.
There is no news feed for today.
The USD/CAD currency pair
Technical indicators of the currency pair:
Prev Open: 1.2823
Prev Close: 1.2836
% chg. over the last day: +0.10%
The Bank of Canada is on the way to aggressive rate hikes, just like the US Fed. But unlike the US, Canada is showing no signs of a slowing economy. Recent indicators point to solid growth and a strong labor market. Rising energy prices give confidence to the Canadian dollar, as the Canadian dollar is a commodity currency. But, on the other hand, it leads to the growth of domestic fuel prices, which leaves some negative consequences, not in favor of the economy.
Trading recommendations
Support levels: 1.2789, 1.2774, 1.2692, 1.2644, 1.2607, 1.2521
The USD/CAD currency pair is bearish in terms of technical analysis. The MACD indicator has become inactive, while there is a divergence, signifying sellers’ weakness. Under such market conditions, it is better to look for buy trades on the lower time frames from the support level of 1.2774 or 1.2789, but only with additional confirmation. For sell deals, it is better to consider the resistance level of 1.2826, but also better with confirmation and short targets.
Alternative scenario: if the price breaks through and consolidates above 1.2953, the uptrend will likely be resumed.
This article reflects a personal opinion and should not be interpreted as an investment advice, and/or offer, and/or a persistent request for carrying out financial transactions, and/or a guarantee, and/or a forecast of future events.
According to former Morgan Stanley Asia chairman Stephen Roche, stagflation in the US is inevitable. He warns that the US is on a dangerous path that leads to higher prices combined with slower economic growth. “The markets are not even close to discounting the full extent of what’s going to be required to bring the demand side under control… That underscores the deep hole Jerome Powell is in right now.”
Many analysts believe that if fuel and food prices continue to rise, the real estate market and the labor market will be next under attack. The real estate market plays a fairly important role in the US economy, with approximately 65% of the units being owner-occupied. This makes homes an important source of household wealth, and housing is a key source of employment.
The stock market plunge accelerated over the past two weeks after the Federal Reserve said it would raise interest rates relentlessly and even slow the US economy if necessary. At the close of the stock market on Friday, the Dow Jones index (US30) added 0.03% (-2.77% for the week), the S&P 500 index (US500) increased by 0.57% (-2.78% for the week), and the technology index NASDAQ (US100) lost 0.30% (-3.19% for the week). All three indices ended the week with losses. This is the 7th consecutive week of declines, the longest losing streak since the dot-com crash of the late 1990s. This indicates that more and more market participants fear a slowing economy and a move into a recession.
President Biden on Saturday signed a law providing $40 billion in additional US aid to Ukraine. The law was passed by Congress with bipartisan support, reinforcing the US commitment to Ukraine. US officials have warned of a possible protracted conflict.
Major European indices traded higher on Friday. German DAX (DE30) gained 0.72% (-0.03% for the week), French CAC 40 (FR40) added 0.20% (-0.48% for the week), Spanish IBEX 35 (ES35) increased by 0.93% (+2.01% for the week), British FTSE 100 (UK100) added +1.19% (-0.38% for the week). European Central Bank (ECB) President Christine Lagarde said the first interest rate hike in more than a decade could come in July but downplayed the idea of a 0.5% increase amid concerns about economic growth. ECB officials are increasingly alarmed about record inflation and are focusing on problems caused by rising prices and supply chain problems that could undermine a pandemic recovery. With inflation in Europe almost four times more than the 2% target and the US Federal Reserve raising interest rates several times, growing criticism is that the ECB has been too slow to act. German producer price index data showed a higher-than-expected jump, indicating that consumer prices will remain high in the short term.
Russia’s Gazprom halted gas exports to Finland on Saturday, the Finnish gas system operator said, due to its refusal to pay in rubles.
Oil prices continue to rise as gasoline markets remain tight amid strong demand ahead of peak driving season in the US and other countries. The peak driving season in the US traditionally begins in late May and ends on Labor Day in September. Oil refineries are in capacity-building mode, but at the moment, demand far exceeds supply, causing prices to rise.
Gold prices added 2% for the week. Gold prices are inversely correlated with the dollar index and US government bond yields. The benchmark 10-year US Treasury bond yield fell to 2.79% from a peak of 3.2%. But that doesn’t mean yields will continue to decline because the more aggressive monetary policy, the higher bond yields.
Asian markets closed in the green territory last week. Japan’s Nikkei 225 (JP225) gained 1.27% for the week, Hong Kong’s Hang Seng (HK50) increased 2.96% for the week, and Australia’s S&P/ASX 200 (AU200) added 1.15% for the week. Singapore’s annual inflation rate remained at 5.4% (forecast 5.5%), with the core consumer price level rising (excluding food and fuel prices) to 3.3%. Last month, Singapore’s central bank tightened monetary policy and stepped up its fight against rising prices, exacerbated by the war in Ukraine and global supply problems.
In the commodities market, futures on natural gas (+5.15%), sugar (+4.23%), silver (+3.64), soybeans (+3.6%), copper (+3.03%), orange juice (+2.96%), gold (+2.04%) and platinum (+1.92%) showed the biggest gains by the end of the week. Lumber futures (-12.86%), gasoline (-3.02%) and cocoa (-2.35%) showed the biggest drop.
Main market quotes:
S&P 500 (F) (US500) 3,901.36 +0.57 (+0.02%)
Dow Jones (US30) 31,261.90 +8.77 (+0.03%)
DAX (DE40) 13,981.91 +99.61 (+0.72%)
FTSE 100 (UK100) 7,389.98 +87.24 (+1.19%)
USD Index 103.03 +0.30 (+0.29%)
Important events for today:
– Singapore Consumer Price Index (m/m) at 08:00 (GMT+3);
– Eurozone Germany Ifo Business Climate (m/m) at 11:00 (GMT+3);
This article reflects a personal opinion and should not be interpreted as an investment advice, and/or offer, and/or a persistent request for carrying out financial transactions, and/or a guarantee, and/or a forecast of future events.
Now is the time for investors to consider diversifying into less traditional asset classes, affirms the CEO and founder of one of the world’s largest independent financial advisory, asset management and fintech organizations.
The assessment from deVere Group’s Nigel Green comes as global stocks continue to experience turbulence.
He says: “The three major equity indexes on Wall Street are experiencing their worst stretch of losses in decades, and this is being echoed globally.
“It comes amid investors’ concerns over inflation, which is forcing central banks to slam the breaks on their economies, the ongoing war in Ukraine, Covid lockdowns in China’s manufacturing heartlands known as the ‘factory of the world’, and some household name companies posting weak results.
“This backdrop is creating a yield-starved environment for investors.”
He continues: “As such, for those looking for both capital appreciation and capital preservation, now is the time to consider diversifying into less traditional, return-enhancing asset classes.
“These could include venture capital, structured products, cryptocurrencies, high dividend stock, hedge funds, managed futures, and direct real estate, amongst others.”
“Such investments could also be useful tools to improve the risk-return characteristics of your investment portfolio. This is because they increase diversification and reduce volatility, due to their low correlations to more traditional investments such as stocks and bonds; and they can hedge some portfolio exposures.”
However, says the deVere CEO, considering that these investments are often more complex than their traditional counterparts, working alongside a good fund manager will likely be critical to ensuring return-boosting results.
He goes on to say that whilst less conventional asset classes should also be considered, investors should remain invested in the traditional markets too “because financial history teaches us that stock markets go up over time.”
Nigel Green concludes: “Yield-starved investors should explore less traditional opportunities, not only for potentially higher returns, but also as they provide diversification and downside protection for their portfolios.”
About:
deVere Group is one of the world’s largest independent advisors of specialist global financial solutions to international, local mass affluent, and high-net-worth clients. It has a network of more than 70 offices across the world, over 80,000 clients and $12bn under advisement.
Today we are running two longer articles looking at the men who are vying to be the next Australian prime minister. You can read Michelle Grattan’s profile of Scott Morrison here.
Karen Middleton’s 2016 biography of Anthony Albanese concludes with a speech he made that year, on the 20th anniversary of his election to parliament.
“I’m patient”, he told his clapping audience, “I’m patient — I’m a Souths fan”. The South Sydney Rabbitohs are the Rugby League club Albanese supports, which for the greater part of his adult life was notorious for its competitive under-performance.
The audience realised, of course, that in proclaiming his long-suffering dedication, Albanese was really alluding to his political vocation and his other underachieving “tribe” — the Labor Party.
Albanese’s journey in Labor politics has indeed been long and arduous. He was still a boy when he began accompanying his mother and grandparents to local branch meetings of the Labor Party; he remembers handing out for Gough Whitlam in 1972 when only nine. He formally joined the ALP as a teenager. Up to his ears in student Labor politics as an undergraduate, upon leaving Sydney University he went to work for the elder statesman of the New South Wales left faction, Tom Uren. By his mid-20s he was assistant secretary of New South Wales Labor, and won the seat of Grayndler for the ALP in 1996 on his 33rd birthday.
Even his path to leadership has been unusually slow. One has to go back to the middle of last century for an opposition leader who was older (56) and who had served for longer in the parliament (23 years) when first elected to that position.
His wait for the chance to become prime minister has been of far longer duration than most of Australia’s recent national leaders. Kevin Rudd, Julia Gillard, Malcolm Turnbull and Scott Morrison averaged only around a decade between entering parliament and attaining office. For Albanese, it will be a quarter of a century if Labor wins Saturday’s election.
To continue the slow burn theme, if Albanese is to be believed, his ambition for leadership formed late. Those who reach leadership positions are typically consumed with an aspiration for the top job from early in their parliamentary careers — if not before. They are fuelled by a sense of their own prime-ministerial destiny.
Albanese is different. On his telling, it was only in 2013, on the defeat of Rudd’s second government, that he first entertained thoughts of becoming leader. Until then he had contented himself with the role of “counsellor and kingmaker”.
And still he had to wait. Despite winning a comfortable majority of the rank-and-file vote, he narrowly lost the leadership to Bill Shorten in 2013 because several of his left faction Caucus colleagues defected to support Shorten. Albanese then had to stay his hand in 2016 when Shorten’s better-than-expected performance at that year’s election insulated him from a leadership contest. When Shorten seemed poised for victory in 2019, Albanese must have figured his chance to be party leader had passed. But then came “Morrison’s miracle” and Albanese emerged as the only candidate to succeed Shorten within a demoralised Labor caucus.
Playing the long game has also been the hallmark of Albanese’s leadership over the past three years. Beginning with “listening tours” of the regions where Labor badly faltered in 2019 — most notably in Queensland — it has been painstaking and unglamorous graft.
As journalist Katharine Murphy has observed, to his detractors his approach has been akin to a campaign of “attrition”. Those critics have harped on the theme of his leadership being a small target and his program prosaic. This is not how Labor wins office, they have insisted. Drawing on a sample size of three — the number of times Labor has claimed government from opposition since the end of the second world war under the leaderships of Whitlam, Bob Hawke and Rudd — the critics have argued the template for Labor success is a bold, transformative reform program and a charismatic, popular leader. Under Albanese, they complain, Labor has neither.
One can quibble at the edges of the critics’ reading of history. Though Whitlam unquestionably heralded an expansive reform program in 1972, the Labor Party was sufficiently concerned about his image that it launched an unprecedented advertising blitz to humanise him in the eyes of the public.
When Hawke won in 1983, Labor’s program for government was all but subsumed by the leader’s messianic appeal as encapsulated in the slogan, “Bob Hawke Bringing Australia Together”.
Rudd’s victory in 2007 was on the back of a campaign in which Labor selectively staked out policy differences with the Coalition. The nerdy Rudd painted himself as more of a fiscal conservative than John Howard, and was reassuringly perceived as a kind of youthful version of the prime minister. In short, the idea of Labor relying on larger-than-life platforms and leaders to win government is exaggerated.
This is not to deny that under Albanese, Labor is running on a considerably less daring agenda than it did in 2019. Indeed, it is an irony — or confirmation that ideological tags count for nothing in the contemporary Labor Party — that the right faction’s Shorten campaigned on an aggressively redistributive program spiced by “class war” rhetoric about the “big end of town”. In contrast, the left faction’s Albanese has abandoned those redistributive measures and has been emollient in his language towards business.
The plan to curb franking credits was first to go under Albanese, followed by the dumping of plans for changes to negative gearing, capital gains and, most recently, family trusts. As well, Labor has announced that in government it will not repeal the third tranche of the Coalition’s tax cuts that benefit high income earners. Simultaneously, Albanese has portrayed himself as a friend of aspiration. He believes, he says, in an Australia “where nobody is held back and nobody is left behind”.
To be fair to Albanese, it makes sense Labor changed tack from 2019. The party’s review of that defeat blamed it on “a cluttered policy agenda that looked risky and an unpopular leader”. In a speech to the National Press Club on the release of that review, Albanese indicated he had got the message: “too many people were confused or even frightened by our policies”. Elsewhere, he has pointedly noted none of Labor’s past successful opposition leaders campaigned on increases in taxes.
If there is a playbook to Albanese walking away from the Shorten program, then it is from the other side of politics. In 1996, heeding the lesson of John Hewson losing the unlosable election three years earlier on a radical neoliberal manifesto headlined by a new tax (the GST), John Howard renounced the GST as well as other contentious policies from Hewson’s Fightback! program. Howard determinedly narrowed the points of difference with Prime Minister Paul Keating, driving the latter to distraction.
Albanese has been unabashed about his strategy of not rejoining the battles of 2019, declaring he has no intention to “relitigate the past”. To those who cavil that Labor has abandoned its ideals by dropping the redistributive policies he has been equally blunt: “One of my Labor principles is for Labor to win elections”. This might not be as caustic as Whitlam’s famed put-down of the Labor hard left: “Only the impotent are pure”, but the point is fundamentally the same. To change the nation, Labor first has to win at the ballot box.
The abandonment of the Shorten-era revenue measures has curtailed Labor’s scope for campaign initiatives. According to the Coalition, Albanese is like a thief in the night, trying to steal his way into office on a meagre policy program. This is largely unfair. Beginning at a leisurely pace, Albanese gradually accelerated the roll out of policies.
Another conclusion of Labor’s review of its 2019 election campaign was that there was an absence of a clear narrative binding together the party’s policies. Albanese too has struggled in that space. In the second half of 2021, he seemed to be feeling his way there by talking about the reconstructive role of government following the crisis of the pandemic. This was potentially redolent of a great Labor reformist era (post-war reconstruction) and a sharp contrast to Morrison’s “can-do capitalism” mantra. Yet his prosecution of the case for the transformative power of government has remained inchoate.
Albanese’s predilection, as exposed on the hustings, for wandering into verbal marshes has not helped either in providing coherence of theme. But the lack of a compelling story line also goes back to the abiding caution of his approach.
The party’s policy on a 2030 carbon emissions reduction target is an illustration. This is another area where Labor kept its powder dry, delaying the release of its target until after the Glasgow Climate Change Conference. When Albanese finally announced a reduction target of 43%, it was almost as if the policy dare not speak its name. He declared it “a modest policy. We do not pretend it is a radical policy”. Hardly the inspirational stuff of “the great moral challenge of our time”.
Making amends for the disappointment of 2019 brings us squarely to the subject of leadership. If Shorten was a millstone on Labor’s vote, a perusal of opinion poll leadership ratings indicates Albanese, though not popular, has not been subject to anything like the antipathy that dogged his predecessor.
In the first half of this year, his leadership ratings edged into positive territory and, unusually for an opposition leader, he was nipping at the heels of the incumbent on the question of preferred prime minister. This was a good place to be.
Probably the most consistent take-out from the leadership polling over the past three years, however, is that Albanese has not made a major impression on the public. The relatively high number of respondents who have nominated “don’t know” when asked to rate his performance has been an indicator of this. The pandemic is one reason Albanese remained indistinct in the electorate’s mind. For stretches of the past parliamentary term, and particularly during 2020, he struggled for oxygen.
Yet undoubtedly the tepid response towards Albanese is also a function of the fact he has bent over backwards to be a non-threatening rather than arresting figure. For someone once styled as a warrior of the left, there has been nothing remotely incendiary from him.
That Albanese has journeyed a long way from his pugilistic younger days is a sign of maturity. But the charisma he displayed as a firebrand student politician has also leached away. He presents as a slightly rough-hewn, inoffensive type, workmanlike rather than exceptional. One senses he is more visceral than cerebral, with reserves of emotional intelligence. Colleagues testify that authenticity and decency are his defining attributes: a shorthand way of saying he is the antithesis of Morrison.
Altogether, Albanese’s is an unusually modest persona for an aspiring prime minister, which goes with his insistence he never had a sense of entitlement to leadership. At the same time, there is a core of resilience and self-belief. His inner strength is rooted in his hard scrabble backstory to which he routinely harks back. This is the story of being brought up as the only child of a single mother and invalid pensioner in council housing. His mother’s struggles are the lodestar of his political vocation.
In another way, though, Albanese was blessed as a child. Like past Labor luminaries, Whitlam, Hawke and Keating, he was the recipient of maternal special investment: what he remembers is his mother’s “absolute unconditional love” for him.
While he might not have believed it was his destiny to be prime minister, his mother harboured that ambition for him. Middleton’s biography records that she “believed he could go far — as far as a person can go in the Australian political system”.
What sort of prime minister can we expect Albanese to be if he wins power on Saturday? He has referenced Hawke and, to the gall of Liberals, even invoked Howard as prime ministers he will take a leaf from. The gold standard of modern Labor prime ministers, it is hardly surprising that Albanese looks to Hawke as a role model. He says that, like Hawke, he will govern by consensus, bringing business, unions and civil society together.
The transactional business of forging networks of support is second nature to Albanese: a craft he mastered as a left faction operative in the hostile environment of the right dominated New South Wales Labor Party.
There is evidence of his capacity for wrangling a middle ground. As leader of the House of Representatives during Gillard’s prime ministership, he was integral to the functioning of Labor’s minority government by closely liaising with the crossbenches. Gillard later remarked: “Albo is a very persuasive person. He’s good at talking people into things”.
While Albanese’s leadership style over the past three years has largely escaped analysis, it is notable he has mostly kept Labor united in common purpose. The walking away from the redistributive policies of the Shorten era required extensive consultation to work through the changes within the parliamentary party and beyond.
In the end, the result was achieved with surprisingly little rancour. Albanese’s collaborative abilities are also attested to by the strong leadership team he has assembled around him. In addition to his deputy, Richard Marles, and Labor’s talented shadow treasurer, Jim Chalmers, that leadership group includes Katy Gallagher, Mark Butler, Kristina Keneally, Penny Wong and Tony Burke.
Like all Labor leaders since Rudd, Albanese insists he has learnt the lessons of the dysfunction of that period of government. He will observe “proper” processes allowing genuine debate in Cabinet. Albanese’s team approach is a welcome contrast to the Coalition side, with Morrison giving the impression of running the show himself. If elected, Albanese’s ability to orchestrate consensus will hold him in good stead for tackling thorny policy challenges of which there will be many ahead.
Still, questions linger about whether Albanese has the stuff to be a substantial prime minister. Although a gifted transactional politician, does he boast the erudition and imagination to meaningfully shape the nation? He has demonstrated a flinty pragmatism over the past three years, but less certain is whether he has the driving sense of purpose required to achieve hard-fought reform.
And, like the best leaders, has he the ability to modulate his approach? Can he switch to a more dynamic galvanising mode of leadership or will the circumspection that has defined him in opposition shackle him in government? On the other hand, just maybe his unassuming leadership will provide for a dogged but conscientious form of government that suits Australia’s purposes.
With Labor enjoying a substantial lead in the opinion polls, Albanese’s patience looks set to be rewarded on Saturday. If the polls are right, on two-party preferred terms, the ALP is on track to achieve at least as handsome a victory as when the party won office in 1972, 1983 and 2007. Albanese will have defied the critics and bent the template of how the ALP wins government from opposition. Non-heroic in leadership style, he will nonetheless be celebrated as a Labor hero.
But there remain gnawing fears in the Labor camp that a low primary vote, fickle preference flows and a patchy swing might yet deny them majority government. Should a hung parliament result from Saturday’s contest, Albanese’s persuasive capacities will be tested immediately in wooing the crossbenchers. The probability is that in any negotiations he will have a stronger hand than Morrison because of an edge in numbers and the fact he is unencumbered by the same baggage as the prime minister.
It will be a final minor delay in Albanese’s protracted journey to the political summit.
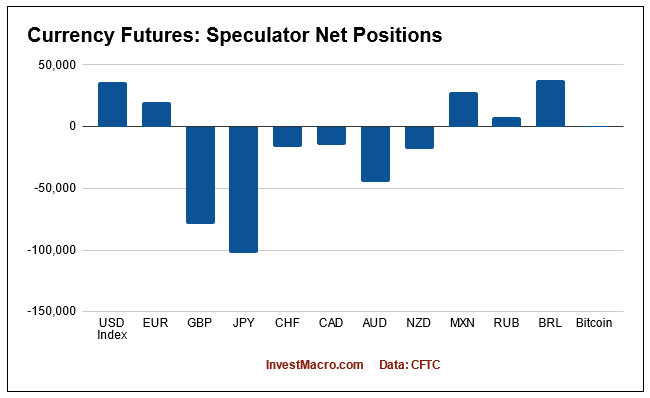
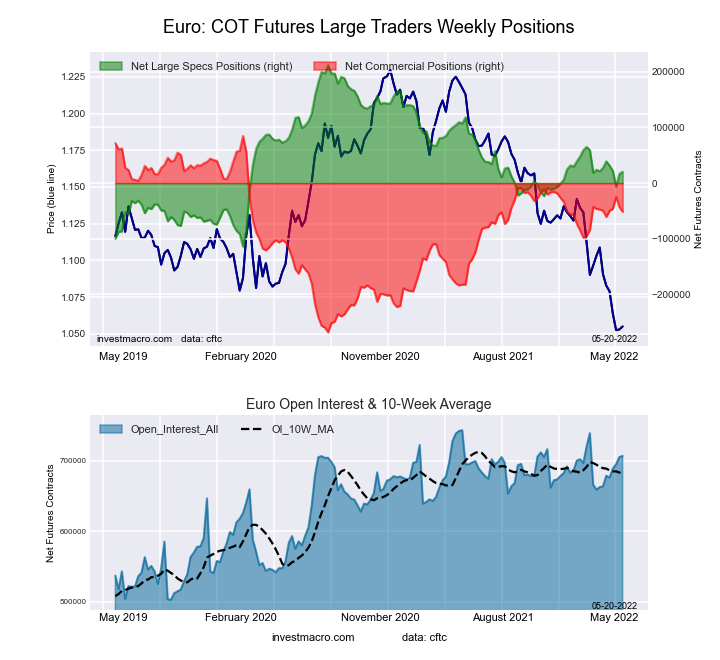
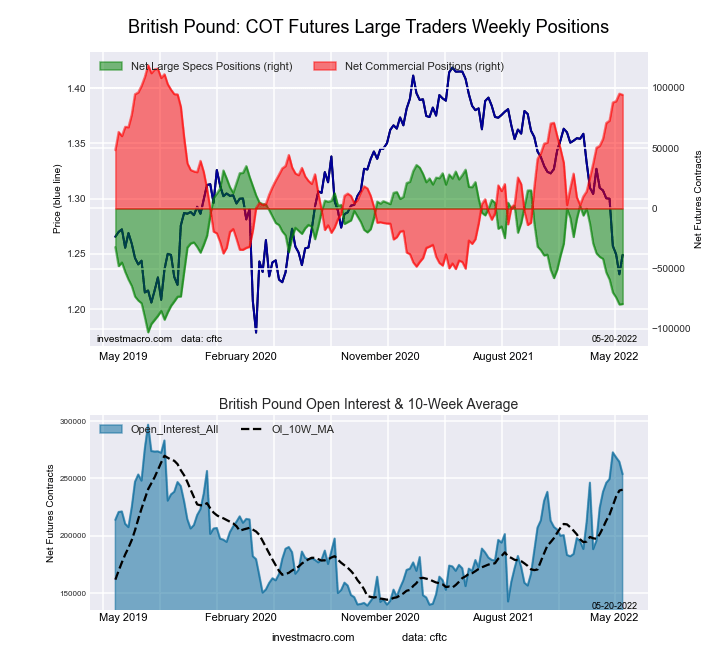
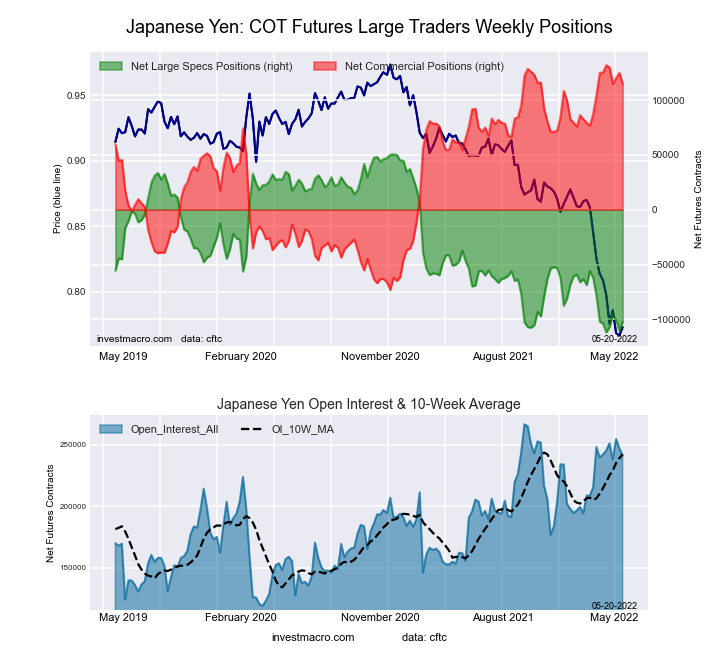
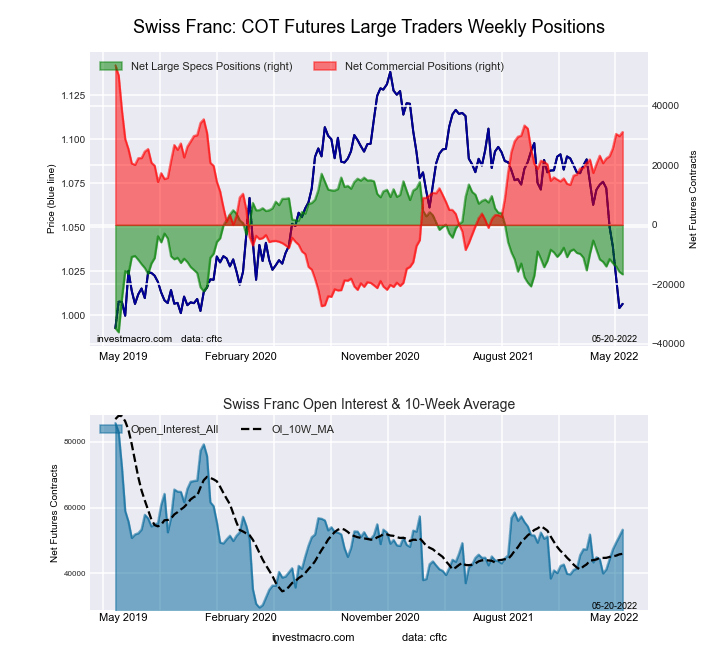
Here are the latest charts and statistics for the Commitment of Traders (COT) data published by the Commodities Futures Trading Commission (CFTC).
The latest COT data is updated through Tuesday May 17th and shows a quick view of how large traders (for-profit speculators and commercial entities) were positioned in the futures markets. All currency positions are in direct relation to the US dollar where, for example, a bet for the euro is a bet that the euro will rise versus the dollar while a bet against the euro will be a bet that the euro will decline versus the dollar.
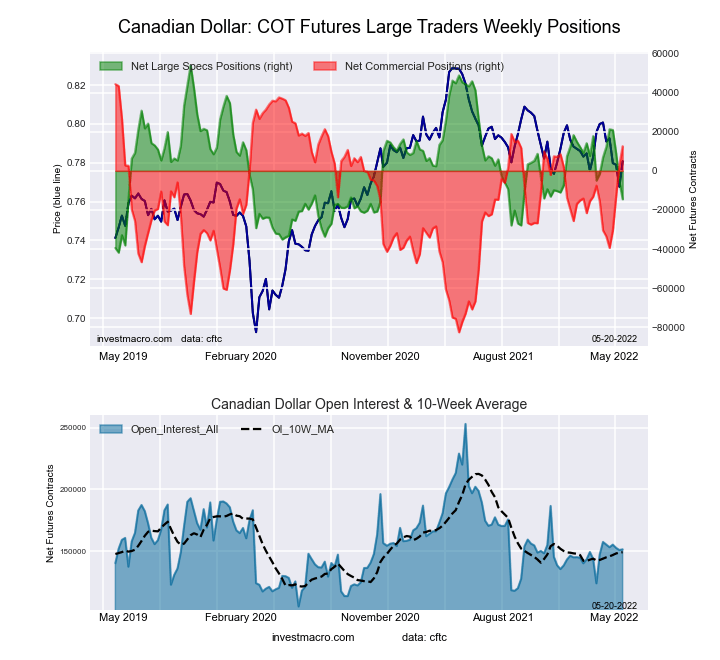
Highlighting the COT currency data was the commodity currency speculator positions that have been on the defensive in recent weeks. Canadian dollar positions declined for a fourth straight week this week and have fallen by a total of -35,722 contracts over the past four weeks. This has pushed the overall speculator standing into a bearish position for a second straight week and to the most bearish level since October 2021. Previously, from the middle of January, CAD positions had started to trend higher and mostly maintained a bullish position into April, reaching a 40-week high on April 19th before seeing speculator sentiment weaken (-14,496 contracts this week).
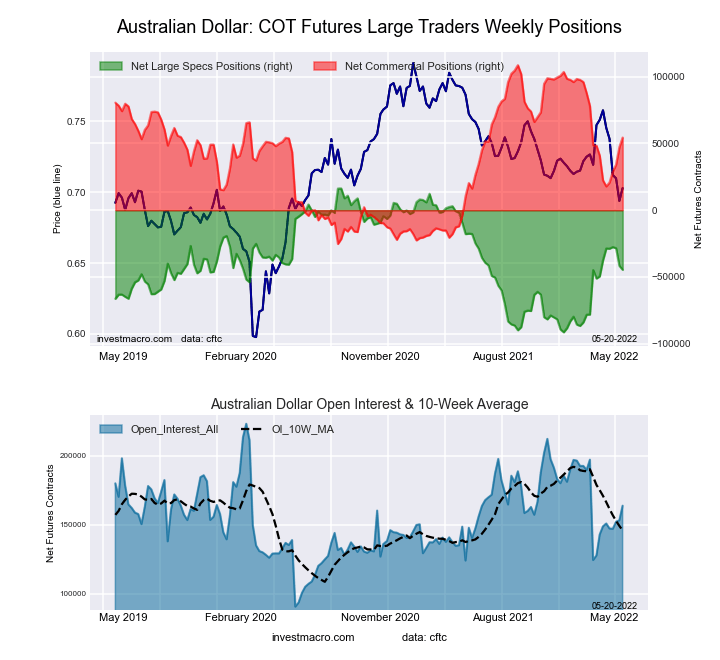
Australian dollar spec positions slipped for a third straight week this week and the overall speculator position has now hit a 7-week low. Aussie positions have maintained a bearish speculator bias since last May (52 consecutive weeks in bearish territory) but had recently seen a reprieve of the weak sentiment. Aussie positions improved strongly from late-February to late-April with a 10-week contract rise of +59,043 positions from February 22nd to April 26th. The speculator positions hit the least bearish level (on April 26th) of the previous 42 weeks before these past 3 weeks has seen speculators re-up their bearish levels.
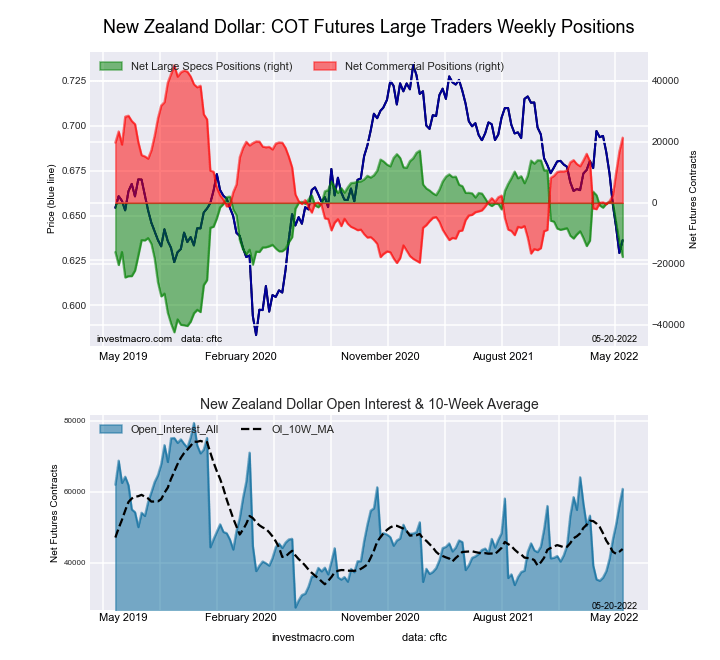
New Zealand dollar speculators also added to their bearish bets for a fourth straight week and have now pushed the position to the most bearish level since March 17th of 2020, a span of 113 weeks. Kiwi speculator positions had spent almost all of 2021 in bullish levels but spec bets started to falter at the end of the year and into the new year (through early March). Recently, positions had turned positive to bullish positioning in the middle of March and again later in April before turning lower in recent weeks. The NZD speculator sentiment has now been in bearish territory for the past three weeks after dropping by a total of -18,132 contracts from April 26th to this week.
Overall, the currencies with higher speculator bets this week were the US Dollar Index (1,437 contracts), Japanese yen (8,145 contracts), Euro (3,810 contracts), British pound sterling (357 contracts), Bitcoin (103 contracts) and the Mexican peso (11,490 contracts).
The currencies with declining bets were the New Zealand dollar (-4,771 contracts), Canadian dollar (-9,089 contracts), Australian dollar (-2,928 contracts), Brazil real (-2,683 contracts) and the Swiss franc (-829 contracts).
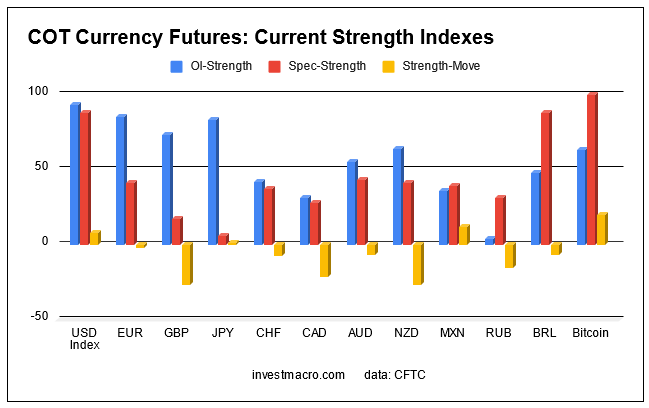
Speculator strength standings for each Commodity where strength index is current net position compared to past three years, above 80 is bullish extreme, below 20 is bearish extreme OI Strength = Current Open Interest level compared to last 3 years range Spec Strength = Current Net Speculator level compared to last 3 years range Strength Move = Six week change of Spec Strength
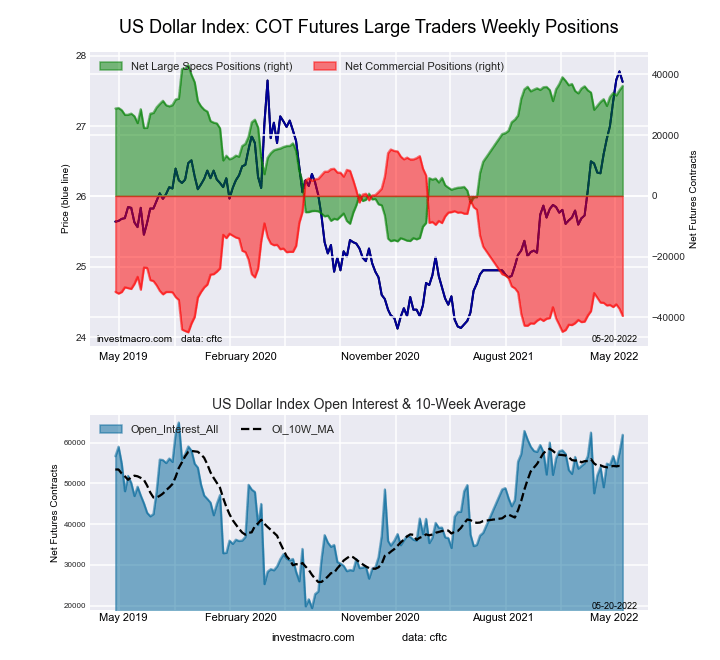
The US Dollar Index large speculator standing this week resulted in a net position of 36,213 contracts in the data reported through Tuesday. This was a weekly rise of 1,437 contracts from the previous week which had a total of 34,776 net contracts.
This week’s current strength score (the trader positioning range over the past three years, measured from 0 to 100) shows the speculators are currently Bullish-Extreme with a score of 88.2 percent. The commercials are Bearish-Extreme with a score of 9.0 percent and the small traders (not shown in chart) are Bullish with a score of 52.5 percent.
US DOLLAR INDEX Statistics
SPECULATORS
COMMERCIALS
SMALL TRADERS
– Percent of Open Interest Longs:
86.5
3.4
8.8
– Percent of Open Interest Shorts:
28.0
67.2
3.5
– Net Position:
36,213
-39,506
3,293
– Gross Longs:
53,519
2,105
5,449
– Gross Shorts:
17,306
41,611
2,156
– Long to Short Ratio:
3.1 to 1
0.1 to 1
2.5 to 1
NET POSITION TREND:
– Strength Index Score (3 Year Range Pct):
88.2
9.0
52.5
– Strength Index Reading (3 Year Range):
Bullish-Extreme
Bearish-Extreme
Bullish
NET POSITION MOVEMENT INDEX:
– 6-Week Change in Strength Index:
7.5
-7.2
-0.5
Euro Currency Futures:
The Euro Currency large speculator standing this week resulted in a net position of 20,339 contracts in the data reported through Tuesday. This was a weekly boost of 3,810 contracts from the previous week which had a total of 16,529 net contracts.
This week’s current strength score (the trader positioning range over the past three years, measured from 0 to 100) shows the speculators are currently Bearish with a score of 41.2 percent. The commercials are Bullish with a score of 61.4 percent and the small traders (not shown in chart) are Bearish with a score of 26.0 percent.
EURO Currency Statistics
SPECULATORS
COMMERCIALS
SMALL TRADERS
– Percent of Open Interest Longs:
32.7
52.7
12.1
– Percent of Open Interest Shorts:
29.8
59.9
7.7
– Net Position:
20,339
-51,517
31,178
– Gross Longs:
230,770
372,113
85,455
– Gross Shorts:
210,431
423,630
54,277
– Long to Short Ratio:
1.1 to 1
0.9 to 1
1.6 to 1
NET POSITION TREND:
– Strength Index Score (3 Year Range Pct):
41.2
61.4
26.0
– Strength Index Reading (3 Year Range):
Bearish
Bullish
Bearish
NET POSITION MOVEMENT INDEX:
– 6-Week Change in Strength Index:
-2.2
-0.5
14.8
British Pound Sterling Futures:
The British Pound Sterling large speculator standing this week resulted in a net position of -79,241 contracts in the data reported through Tuesday. This was a weekly advance of 357 contracts from the previous week which had a total of -79,598 net contracts.
This week’s current strength score (the trader positioning range over the past three years, measured from 0 to 100) shows the speculators are currently Bearish-Extreme with a score of 16.9 percent. The commercials are Bullish-Extreme with a score of 85.5 percent and the small traders (not shown in chart) are Bearish with a score of 24.3 percent.
BRITISH POUND Statistics
SPECULATORS
COMMERCIALS
SMALL TRADERS
– Percent of Open Interest Longs:
10.5
79.4
8.2
– Percent of Open Interest Shorts:
41.7
42.3
14.1
– Net Position:
-79,241
94,344
-15,103
– Gross Longs:
26,613
201,647
20,811
– Gross Shorts:
105,854
107,303
35,914
– Long to Short Ratio:
0.3 to 1
1.9 to 1
0.6 to 1
NET POSITION TREND:
– Strength Index Score (3 Year Range Pct):
16.9
85.5
24.3
– Strength Index Reading (3 Year Range):
Bearish-Extreme
Bullish-Extreme
Bearish
NET POSITION MOVEMENT INDEX:
– 6-Week Change in Strength Index:
-27.0
21.6
1.9
Japanese Yen Futures:
The Japanese Yen large speculator standing this week resulted in a net position of -102,309 contracts in the data reported through Tuesday. This was a weekly advance of 8,145 contracts from the previous week which had a total of -110,454 net contracts.
This week’s current strength score (the trader positioning range over the past three years, measured from 0 to 100) shows the speculators are currently Bearish-Extreme with a score of 5.9 percent. The commercials are Bullish-Extreme with a score of 91.8 percent and the small traders (not shown in chart) are Bearish with a score of 27.5 percent.
JAPANESE YEN Statistics
SPECULATORS
COMMERCIALS
SMALL TRADERS
– Percent of Open Interest Longs:
5.0
84.7
8.7
– Percent of Open Interest Shorts:
47.4
37.0
14.0
– Net Position:
-102,309
115,062
-12,753
– Gross Longs:
12,113
204,417
20,933
– Gross Shorts:
114,422
89,355
33,686
– Long to Short Ratio:
0.1 to 1
2.3 to 1
0.6 to 1
NET POSITION TREND:
– Strength Index Score (3 Year Range Pct):
5.9
91.8
27.5
– Strength Index Reading (3 Year Range):
Bearish-Extreme
Bullish-Extreme
Bearish
NET POSITION MOVEMENT INDEX:
– 6-Week Change in Strength Index:
0.9
-5.0
17.6
Swiss Franc Futures:
The Swiss Franc large speculator standing this week resulted in a net position of -16,592 contracts in the data reported through Tuesday. This was a weekly reduction of -829 contracts from the previous week which had a total of -15,763 net contracts.
This week’s current strength score (the trader positioning range over the past three years, measured from 0 to 100) shows the speculators are currently Bearish with a score of 36.6 percent. The commercials are Bullish with a score of 72.3 percent and the small traders (not shown in chart) are Bearish-Extreme with a score of 13.8 percent.
SWISS FRANC Statistics
SPECULATORS
COMMERCIALS
SMALL TRADERS
– Percent of Open Interest Longs:
9.8
74.5
15.2
– Percent of Open Interest Shorts:
41.0
16.0
42.6
– Net Position:
-16,592
31,181
-14,589
– Gross Longs:
5,240
39,722
8,094
– Gross Shorts:
21,832
8,541
22,683
– Long to Short Ratio:
0.2 to 1
4.7 to 1
0.4 to 1
NET POSITION TREND:
– Strength Index Score (3 Year Range Pct):
36.6
72.3
13.8
– Strength Index Reading (3 Year Range):
Bearish
Bullish
Bearish-Extreme
NET POSITION MOVEMENT INDEX:
– 6-Week Change in Strength Index:
-7.9
12.9
-19.8
Canadian Dollar Futures:
The Canadian Dollar large speculator standing this week resulted in a net position of -14,496 contracts in the data reported through Tuesday. This was a weekly reduction of -9,089 contracts from the previous week which had a total of -5,407 net contracts.
This week’s current strength score (the trader positioning range over the past three years, measured from 0 to 100) shows the speculators are currently Bearish with a score of 28.5 percent. The commercials are Bullish with a score of 75.0 percent and the small traders (not shown in chart) are Bearish with a score of 33.6 percent.
CANADIAN DOLLAR Statistics
SPECULATORS
COMMERCIALS
SMALL TRADERS
– Percent of Open Interest Longs:
23.8
52.7
20.6
– Percent of Open Interest Shorts:
33.4
44.4
19.3
– Net Position:
-14,496
12,591
1,905
– Gross Longs:
36,069
79,825
31,228
– Gross Shorts:
50,565
67,234
29,323
– Long to Short Ratio:
0.7 to 1
1.2 to 1
1.1 to 1
NET POSITION TREND:
– Strength Index Score (3 Year Range Pct):
28.5
75.0
33.6
– Strength Index Reading (3 Year Range):
Bearish
Bullish
Bearish
NET POSITION MOVEMENT INDEX:
– 6-Week Change in Strength Index:
-22.4
33.9
-43.0
Australian Dollar Futures:
The Australian Dollar large speculator standing this week resulted in a net position of -44,642 contracts in the data reported through Tuesday. This was a weekly decrease of -2,928 contracts from the previous week which had a total of -41,714 net contracts.
This week’s current strength score (the trader positioning range over the past three years, measured from 0 to 100) shows the speculators are currently Bearish with a score of 43.4 percent. The commercials are Bullish with a score of 59.5 percent and the small traders (not shown in chart) are Bearish with a score of 28.5 percent.
AUSTRALIAN DOLLAR Statistics
SPECULATORS
COMMERCIALS
SMALL TRADERS
– Percent of Open Interest Longs:
25.3
60.4
11.7
– Percent of Open Interest Shorts:
52.6
27.1
17.7
– Net Position:
-44,642
54,437
-9,795
– Gross Longs:
41,473
98,903
19,187
– Gross Shorts:
86,115
44,466
28,982
– Long to Short Ratio:
0.5 to 1
2.2 to 1
0.7 to 1
NET POSITION TREND:
– Strength Index Score (3 Year Range Pct):
43.4
59.5
28.5
– Strength Index Reading (3 Year Range):
Bearish
Bullish
Bearish
NET POSITION MOVEMENT INDEX:
– 6-Week Change in Strength Index:
-6.6
24.0
-60.9
New Zealand Dollar Futures:
The New Zealand Dollar large speculator standing this week resulted in a net position of -17,767 contracts in the data reported through Tuesday. This was a weekly decrease of -4,771 contracts from the previous week which had a total of -12,996 net contracts.
This week’s current strength score (the trader positioning range over the past three years, measured from 0 to 100) shows the speculators are currently Bearish with a score of 41.5 percent. The commercials are Bullish with a score of 63.4 percent and the small traders (not shown in chart) are Bearish-Extreme with a score of 10.4 percent.
NEW ZEALAND DOLLAR Statistics
SPECULATORS
COMMERCIALS
SMALL TRADERS
– Percent of Open Interest Longs:
24.7
71.1
3.9
– Percent of Open Interest Shorts:
53.9
35.9
9.8
– Net Position:
-17,767
21,390
-3,623
– Gross Longs:
14,998
43,219
2,358
– Gross Shorts:
32,765
21,829
5,981
– Long to Short Ratio:
0.5 to 1
2.0 to 1
0.4 to 1
NET POSITION TREND:
– Strength Index Score (3 Year Range Pct):
41.5
63.4
10.4
– Strength Index Reading (3 Year Range):
Bearish
Bullish
Bearish-Extreme
NET POSITION MOVEMENT INDEX:
– 6-Week Change in Strength Index:
-27.2
32.7
-57.5
Mexican Peso Futures:
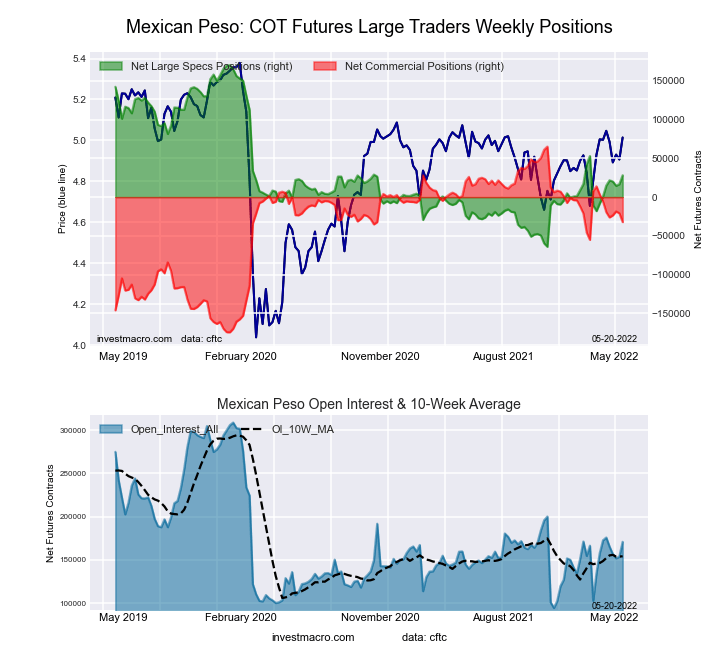
The Mexican Peso large speculator standing this week resulted in a net position of 28,215 contracts in the data reported through Tuesday. This was a weekly gain of 11,490 contracts from the previous week which had a total of 16,725 net contracts.
This week’s current strength score (the trader positioning range over the past three years, measured from 0 to 100) shows the speculators are currently Bearish with a score of 39.4 percent. The commercials are Bullish with a score of 59.4 percent and the small traders (not shown in chart) are Bullish with a score of 60.1 percent.
MEXICAN PESO Statistics
SPECULATORS
COMMERCIALS
SMALL TRADERS
– Percent of Open Interest Longs:
45.5
49.1
4.1
– Percent of Open Interest Shorts:
29.0
67.9
1.7
– Net Position:
28,215
-32,249
4,034
– Gross Longs:
77,819
83,844
7,000
– Gross Shorts:
49,604
116,093
2,966
– Long to Short Ratio:
1.6 to 1
0.7 to 1
2.4 to 1
NET POSITION TREND:
– Strength Index Score (3 Year Range Pct):
39.4
59.4
60.1
– Strength Index Reading (3 Year Range):
Bearish
Bullish
Bullish
NET POSITION MOVEMENT INDEX:
– 6-Week Change in Strength Index:
11.6
-11.0
-3.5
Brazilian Real Futures:
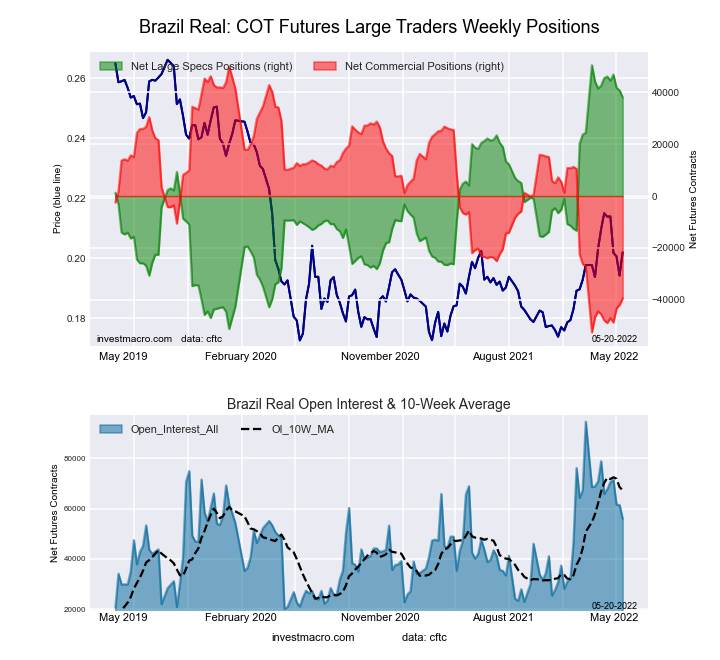
The Brazilian Real large speculator standing this week resulted in a net position of 38,095 contracts in the data reported through Tuesday. This was a weekly decline of -2,683 contracts from the previous week which had a total of 40,778 net contracts.
This week’s current strength score (the trader positioning range over the past three years, measured from 0 to 100) shows the speculators are currently Bullish-Extreme with a score of 87.8 percent. The commercials are Bearish-Extreme with a score of 12.8 percent and the small traders (not shown in chart) are Bullish-Extreme with a score of 80.5 percent.
BRAZIL REAL Statistics
SPECULATORS
COMMERCIALS
SMALL TRADERS
– Percent of Open Interest Longs:
76.8
16.9
6.1
– Percent of Open Interest Shorts:
8.7
87.3
3.7
– Net Position:
38,095
-39,436
1,341
– Gross Longs:
42,989
9,470
3,438
– Gross Shorts:
4,894
48,906
2,097
– Long to Short Ratio:
8.8 to 1
0.2 to 1
1.6 to 1
NET POSITION TREND:
– Strength Index Score (3 Year Range Pct):
87.8
12.8
80.5
– Strength Index Reading (3 Year Range):
Bullish-Extreme
Bearish-Extreme
Bullish-Extreme
NET POSITION MOVEMENT INDEX:
– 6-Week Change in Strength Index:
-7.3
8.3
-12.8
Bitcoin Futures:
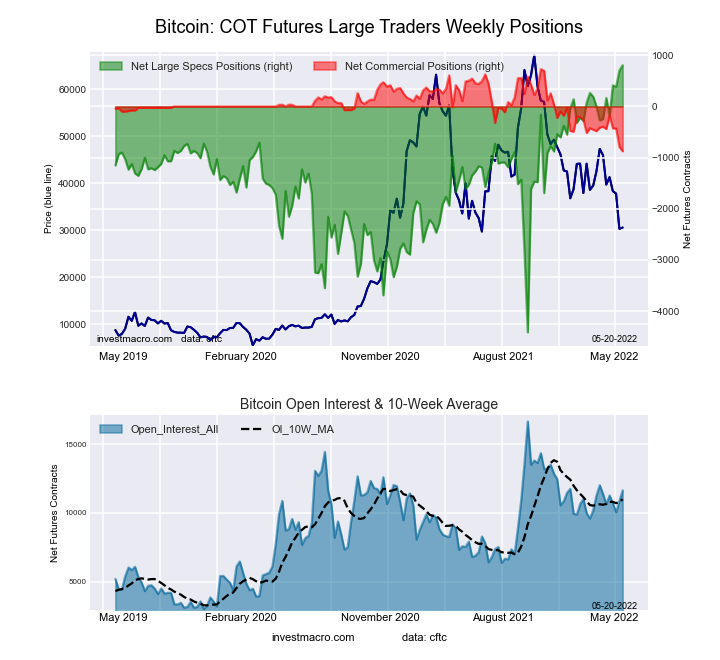
The Bitcoin large speculator standing this week resulted in a net position of 806 contracts in the data reported through Tuesday. This was a weekly gain of 103 contracts from the previous week which had a total of 703 net contracts.
This week’s current strength score (the trader positioning range over the past three years, measured from 0 to 100) shows the speculators are currently Bullish-Extreme with a score of 100.0 percent. The commercials are Bearish-Extreme with a score of 0.0 percent and the small traders (not shown in chart) are Bearish-Extreme with a score of 14.5 percent.
*COT Report: The COT data, released weekly to the public each Friday, is updated through the most recent Tuesday (data is 3 days old) and shows a quick view of how large speculators or non-commercials (for-profit traders) were positioned in the futures markets.
The CFTC categorizes trader positions according to commercial hedgers (traders who use futures contracts for hedging as part of the business), non-commercials (large traders who speculate to realize trading profits) and nonreportable traders (usually small traders/speculators) as well as their open interest (contracts open in the market at time of reporting).See CFTC criteria here.
Here are the latest charts and statistics for the Commitment of Traders (COT) data published by the Commodities Futures Trading Commission (CFTC).
The latest COT data is updated through Tuesday May 17th and shows a quick view of how large traders (for-profit speculators and commercial entities) were positioned in the futures markets.
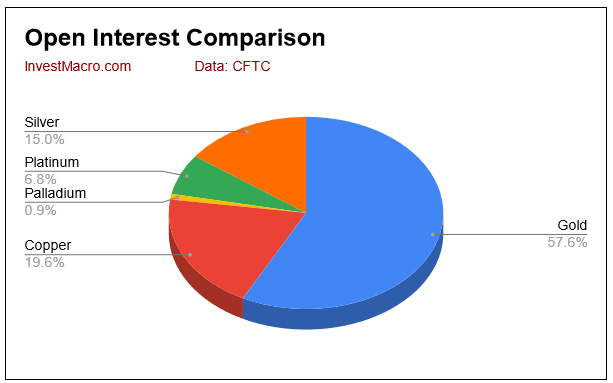
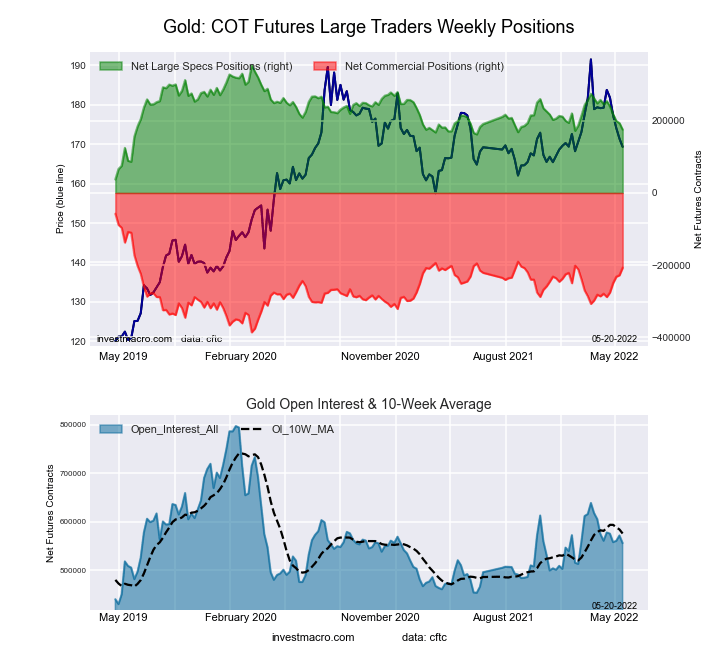
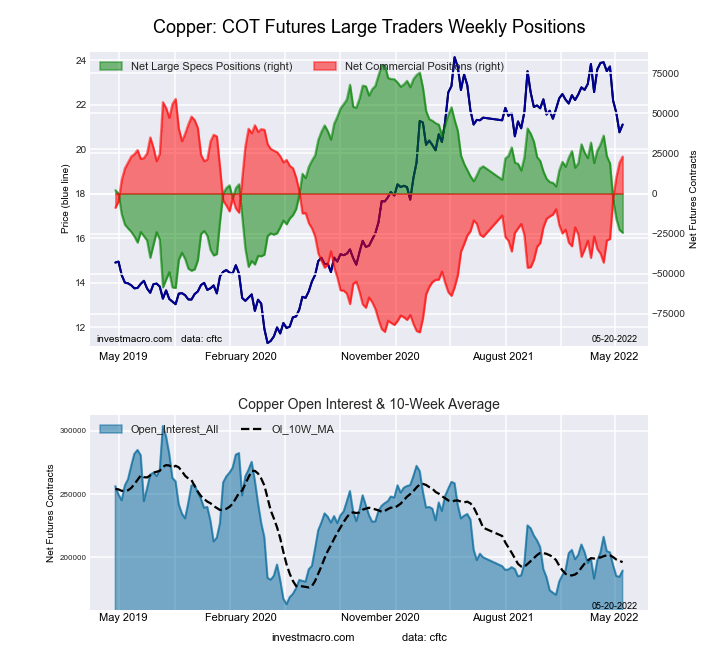
Highlighting the COT metals data is the recent decrease in the Gold and Copper speculative positions. Gold speculator bets fell this week for the fifth straight week and for the eighth time in the past ten weeks as sentiment for the shiny metal has dulled over the past few months. This latest 5-week decline has amounted to a total reduction of -78,927 contracts from the speculator position. The current speculator standing for Gold remains in bullish position but has descended to lowest level of the past fifteen weeks (at +175,360 contracts), dating back to early February.
Copper speculator bets have also cooled over the past couple months and fell this week for the sixth consecutive week. This decline has taken a whopping -60,550 contracts off the speculator position and has dropped the spec level from +36,142 contracts on April 5th to -24,408 contracts this week. This week’s total marks the lowest level for Copper bets in the past 109 weeks, dating back to April 14th of 2020. The slowdown in the Chinese economy and the Covid shutdowns in China have put a dent in the Copper sentiment as China is one of the largest world producers of Copper and is the largest consumer of Copper in the world.
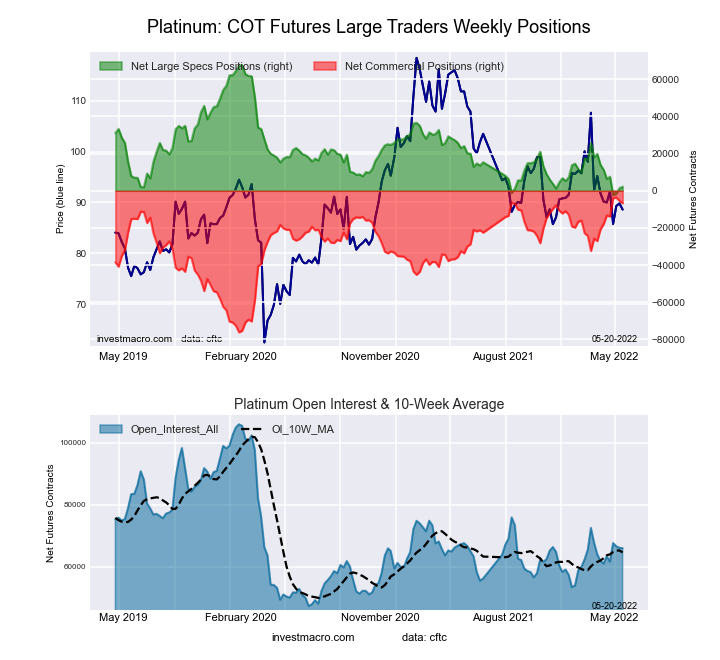
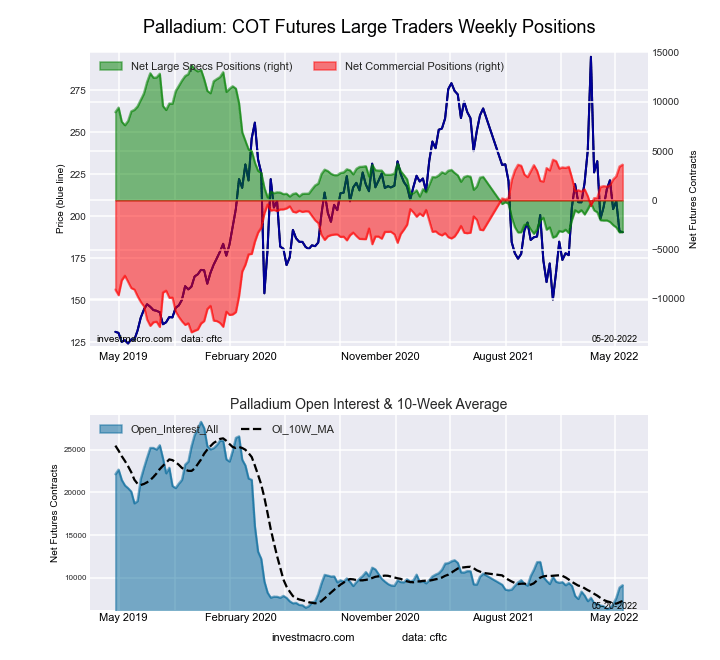
Overall, the markets with higher speculator bets this week were just Platinum (840 contracts) and Palladium (30 contracts).
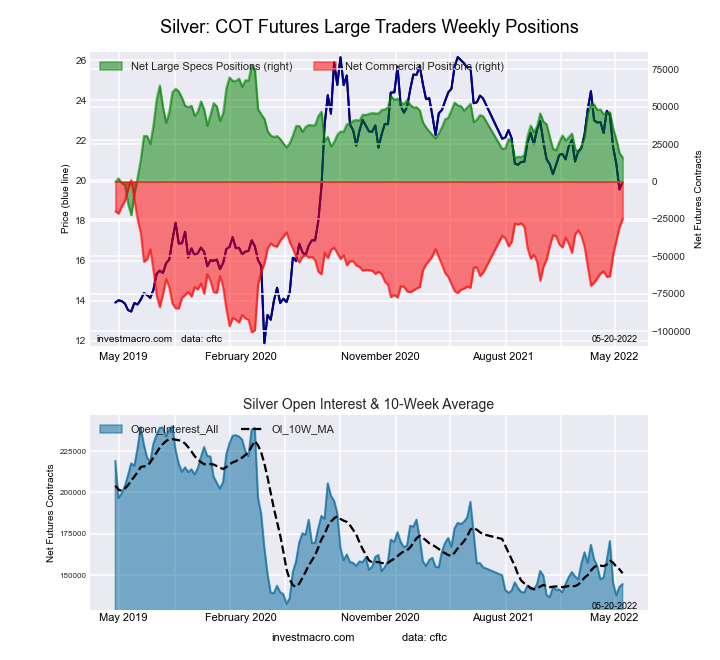
The markets with declining speculator bets this week were Gold (-17,955 contracts), Silver (-2,968 contracts) and Copper (-1,782 contracts).
Data Snapshot of Commodity Market Traders | Columns Legend
May-17-2022
OI
OI-Index
Spec-Net
Spec-Index
Com-Net
COM-Index
Smalls-Net
Smalls-Index
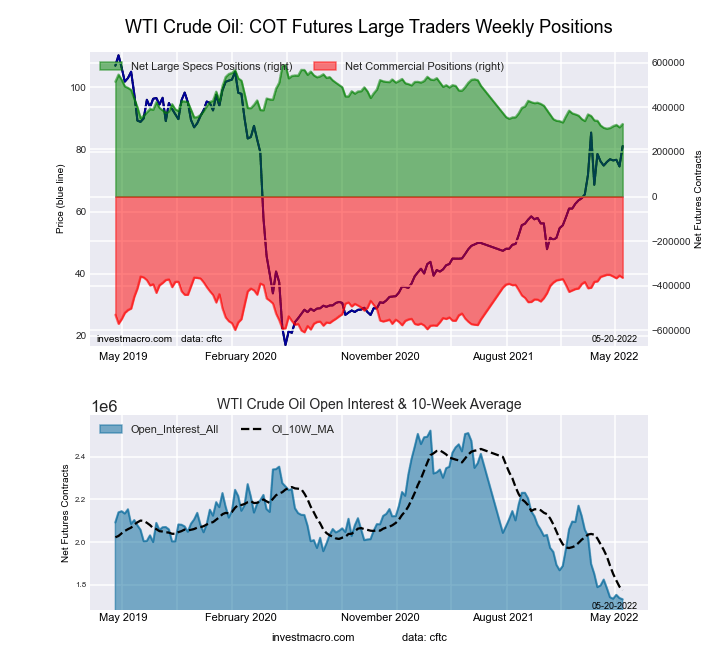
WTI Crude
1,730,665
0
325,637
7
-363,869
95
38,232
69
Gold
555,756
30
175,360
33
-206,879
65
31,519
48
Silver
144,534
11
16,114
38
-24,841
75
8,727
0
Copper
189,483
19
-24,408
25
23,059
75
1,349
33
Palladium
9,114
13
-3,215
3
3,621
97
-406
20
Platinum
65,926
32
2,203
7
-6,697
96
4,494
25
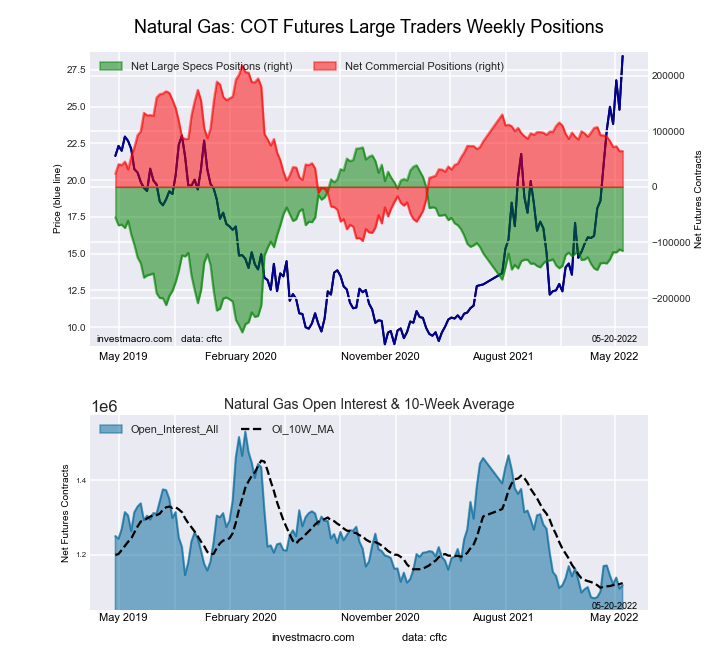
Natural Gas
1,118,417
8
-115,012
44
64,340
51
50,672
100
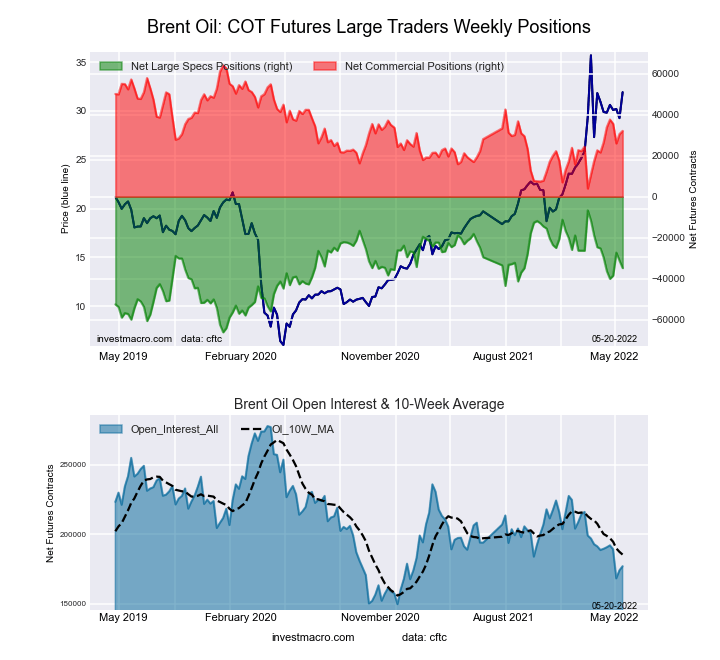
Brent
176,861
21
-34,867
53
32,127
47
2,740
46
Heating Oil
349,618
31
6,455
52
-32,434
37
25,979
88
Soybeans
709,144
24
183,647
73
-156,937
33
-26,710
26
Corn
1,548,438
29
473,743
91
-424,756
11
-48,987
15
Coffee
206,106
0
38,487
72
-40,949
32
2,462
13
Sugar
825,281
6
196,630
77
-245,374
22
48,744
68
Wheat
326,651
8
28,806
57
-26,020
23
-2,786
98
Gold Comex Futures:
The Gold Comex Futures large speculator standing this week came in at a net position of 175,360 contracts in the data reported through Tuesday. This was a weekly reduction of -17,955 contracts from the previous week which had a total of 193,315 net contracts.
This week’s current strength score (the trader positioning range over the past three years, measured from 0 to 100) shows the speculators are currently Bearish with a score of 33.2 percent. The commercials are Bullish with a score of 64.8 percent and the small traders (not shown in chart) are Bearish with a score of 48.0 percent.
Gold Futures Statistics
SPECULATORS
COMMERCIALS
SMALL TRADERS
– Percent of Open Interest Longs:
50.9
24.8
9.1
– Percent of Open Interest Shorts:
19.4
62.0
3.4
– Net Position:
175,360
-206,879
31,519
– Gross Longs:
283,011
137,687
50,588
– Gross Shorts:
107,651
344,566
19,069
– Long to Short Ratio:
2.6 to 1
0.4 to 1
2.7 to 1
NET POSITION TREND:
– Strength Index Score (3 Year Range Pct):
33.2
64.8
48.0
– Strength Index Reading (3 Year Range):
Bearish
Bullish
Bearish
NET POSITION MOVEMENT INDEX:
– 6-Week Change in Strength Index:
-26.3
26.1
-5.4
Silver Comex Futures:
The Silver Comex Futures large speculator standing this week came in at a net position of 16,114 contracts in the data reported through Tuesday. This was a weekly decline of -2,968 contracts from the previous week which had a total of 19,082 net contracts.
This week’s current strength score (the trader positioning range over the past three years, measured from 0 to 100) shows the speculators are currently Bearish with a score of 38.4 percent. The commercials are Bullish with a score of 74.5 percent and the small traders (not shown in chart) are Bearish-Extreme with a score of 0.0 percent.
Silver Futures Statistics
SPECULATORS
COMMERCIALS
SMALL TRADERS
– Percent of Open Interest Longs:
41.4
37.6
16.0
– Percent of Open Interest Shorts:
30.3
54.7
10.0
– Net Position:
16,114
-24,841
8,727
– Gross Longs:
59,857
54,287
23,121
– Gross Shorts:
43,743
79,128
14,394
– Long to Short Ratio:
1.4 to 1
0.7 to 1
1.6 to 1
NET POSITION TREND:
– Strength Index Score (3 Year Range Pct):
38.4
74.5
0.0
– Strength Index Reading (3 Year Range):
Bearish
Bullish
Bearish-Extreme
NET POSITION MOVEMENT INDEX:
– 6-Week Change in Strength Index:
-28.8
34.5
-34.4
Copper Grade #1 Futures:
The Copper Grade #1 Futures large speculator standing this week came in at a net position of -24,408 contracts in the data reported through Tuesday. This was a weekly decrease of -1,782 contracts from the previous week which had a total of -22,626 net contracts.
This week’s current strength score (the trader positioning range over the past three years, measured from 0 to 100) shows the speculators are currently Bearish with a score of 24.8 percent. The commercials are Bullish with a score of 75.3 percent and the small traders (not shown in chart) are Bearish with a score of 33.1 percent.
Copper Futures Statistics
SPECULATORS
COMMERCIALS
SMALL TRADERS
– Percent of Open Interest Longs:
28.1
53.6
8.3
– Percent of Open Interest Shorts:
40.9
41.4
7.6
– Net Position:
-24,408
23,059
1,349
– Gross Longs:
53,159
101,533
15,747
– Gross Shorts:
77,567
78,474
14,398
– Long to Short Ratio:
0.7 to 1
1.3 to 1
1.1 to 1
NET POSITION TREND:
– Strength Index Score (3 Year Range Pct):
24.8
75.3
33.1
– Strength Index Reading (3 Year Range):
Bearish
Bullish
Bearish
NET POSITION MOVEMENT INDEX:
– 6-Week Change in Strength Index:
-43.6
45.4
-32.1
Platinum Futures:
The Platinum Futures large speculator standing this week came in at a net position of 2,203 contracts in the data reported through Tuesday. This was a weekly advance of 840 contracts from the previous week which had a total of 1,363 net contracts.
This week’s current strength score (the trader positioning range over the past three years, measured from 0 to 100) shows the speculators are currently Bearish-Extreme with a score of 6.5 percent. The commercials are Bullish-Extreme with a score of 95.8 percent and the small traders (not shown in chart) are Bearish with a score of 24.7 percent.
Platinum Futures Statistics
SPECULATORS
COMMERCIALS
SMALL TRADERS
– Percent of Open Interest Longs:
42.9
39.4
12.2
– Percent of Open Interest Shorts:
39.5
49.6
5.4
– Net Position:
2,203
-6,697
4,494
– Gross Longs:
28,253
26,002
8,051
– Gross Shorts:
26,050
32,699
3,557
– Long to Short Ratio:
1.1 to 1
0.8 to 1
2.3 to 1
NET POSITION TREND:
– Strength Index Score (3 Year Range Pct):
6.5
95.8
24.7
– Strength Index Reading (3 Year Range):
Bearish-Extreme
Bullish-Extreme
Bearish
NET POSITION MOVEMENT INDEX:
– 6-Week Change in Strength Index:
-13.0
15.5
-29.7
Palladium Futures:
The Palladium Futures large speculator standing this week came in at a net position of -3,215 contracts in the data reported through Tuesday. This was a weekly rise of 30 contracts from the previous week which had a total of -3,245 net contracts.
This week’s current strength score (the trader positioning range over the past three years, measured from 0 to 100) shows the speculators are currently Bearish-Extreme with a score of 3.2 percent. The commercials are Bullish-Extreme with a score of 97.1 percent and the small traders (not shown in chart) are Bearish with a score of 20.4 percent.
*COT Report: The COT data, released weekly to the public each Friday, is updated through the most recent Tuesday (data is 3 days old) and shows a quick view of how large speculators or non-commercials (for-profit traders) were positioned in the futures markets.
The CFTC categorizes trader positions according to commercial hedgers (traders who use futures contracts for hedging as part of the business), non-commercials (large traders who speculate to realize trading profits) and nonreportable traders (usually small traders/speculators) as well as their open interest (contracts open in the market at time of reporting).See CFTC criteria here.
Here are the latest charts and statistics for the Commitment of Traders (COT) data published by the Commodities Futures Trading Commission (CFTC).
The latest COT data is updated through Tuesday May 17th and shows a quick view of how large traders (for-profit speculators and commercial entities) were positioned in the futures markets.
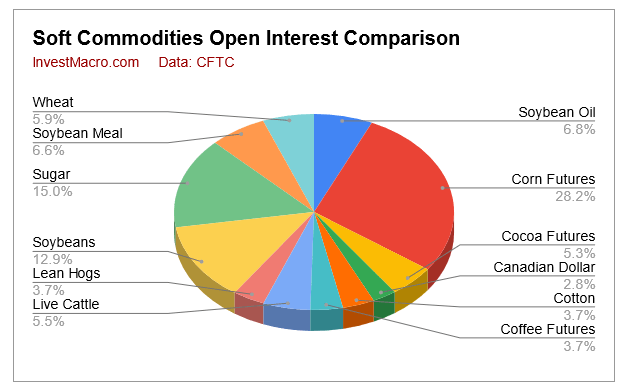
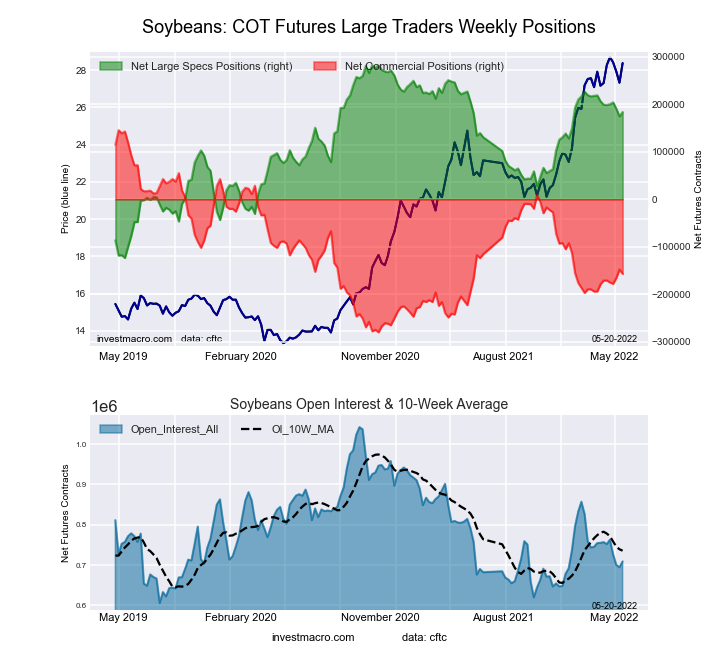
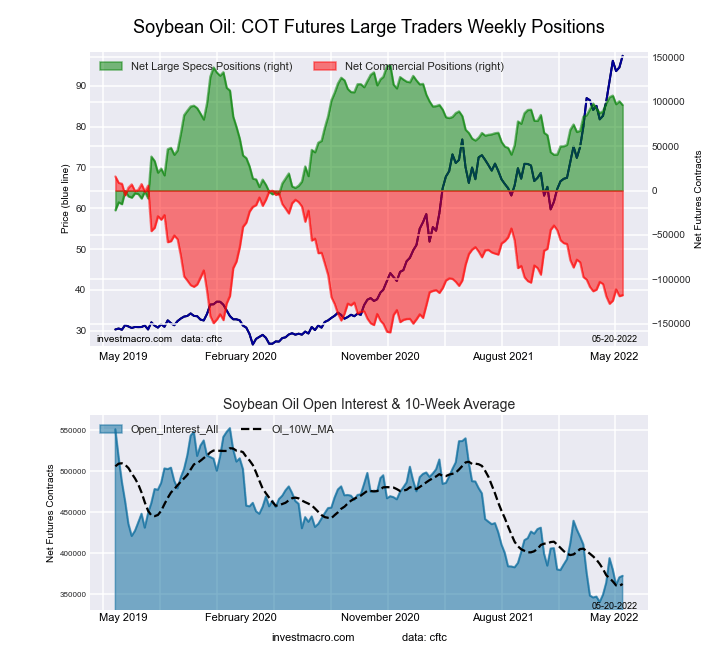
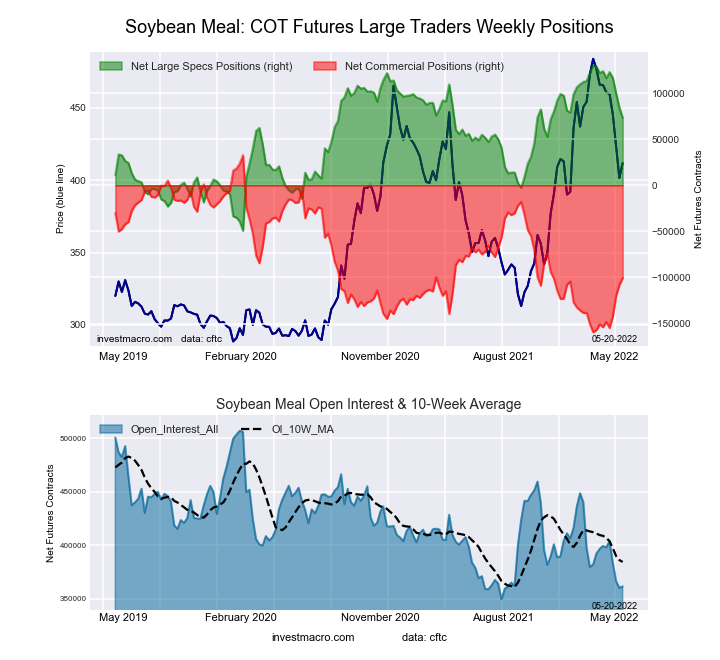
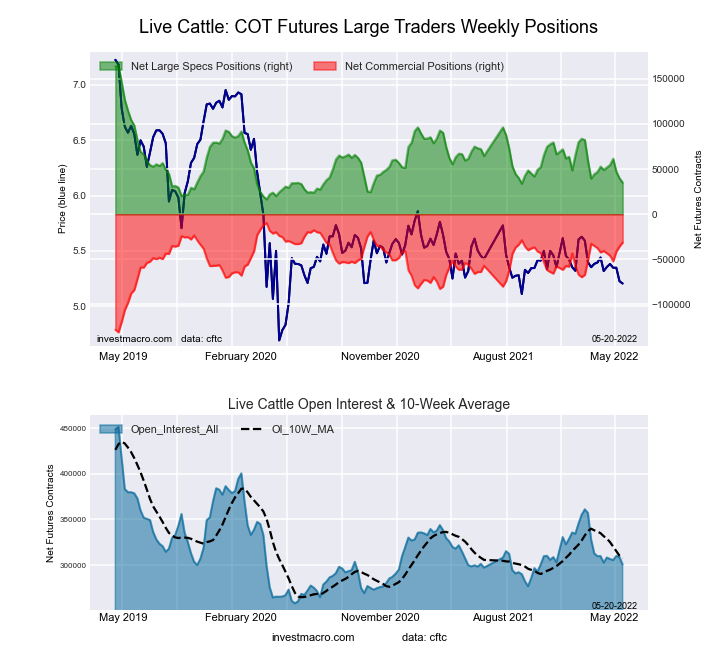
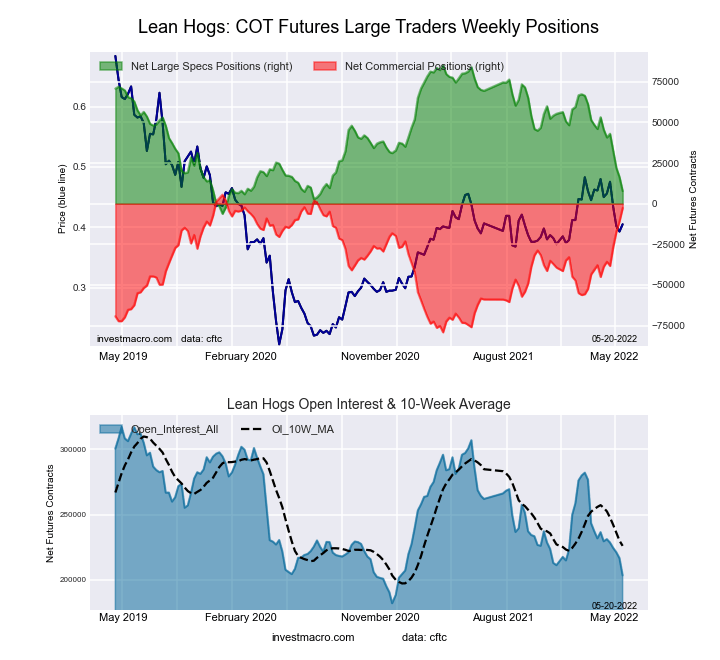
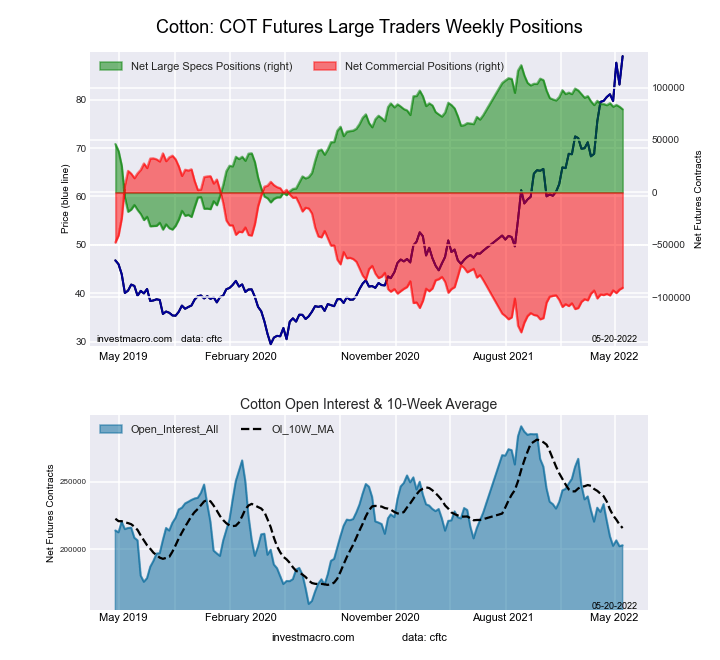
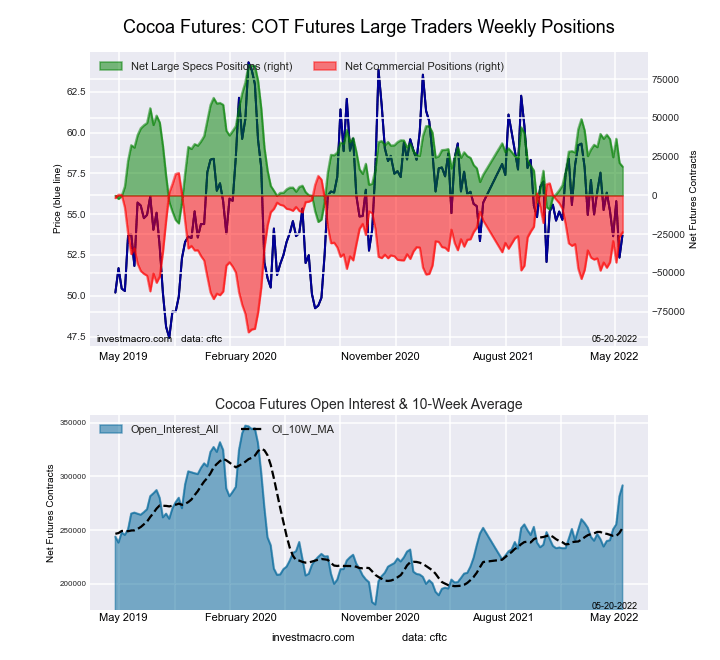
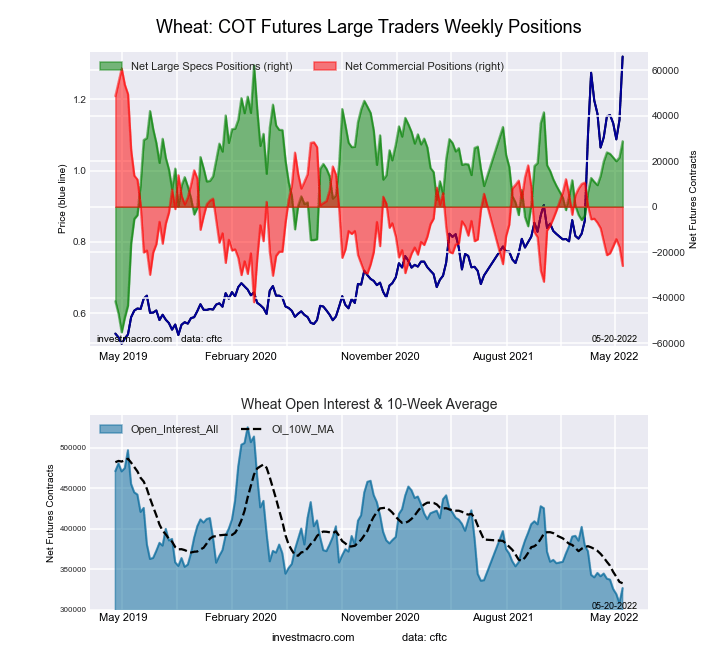
Soft Commodities market speculator bets were mixed this week as five out of the eleven softs markets we cover had higher positioning this week while six markets saw lower positions. Leading the gains for the soft commodities was Sugar (9,445 contracts) and Soybeans (9,039 contracts) with Wheat (7,120 contracts), Coffee (5,932 contracts) and Corn (2,835 contracts) also showing a positive week. Meanwhile, leading the declines in speculator bets this week were Soybean Meal (-10,832 contracts) and Lean Hogs (-8,595 contracts) with Live Cattle (-4,773 contracts), Soybean Oil (-4,295 contracts), Cotton (-2,443 contracts) and Cocoa (-2,463 contracts) also coming in with lower bets on the week.
Data Snapshot of Commodity Market Traders | Columns Legend
May-17-2022
OI
OI-Index
Spec-Net
Spec-Index
Com-Net
COM-Index
Smalls-Net
Smalls-Index
WTI Crude
1,730,665
0
325,637
7
-363,869
95
38,232
69
Gold
555,756
30
175,360
33
-206,879
65
31,519
48
Silver
144,534
11
16,114
38
-24,841
75
8,727
0
Copper
189,483
19
-24,408
25
23,059
75
1,349
33
Palladium
9,114
13
-3,215
3
3,621
97
-406
20
Platinum
65,926
32
2,203
7
-6,697
96
4,494
25
Natural Gas
1,118,417
8
-115,012
44
64,340
51
50,672
100
Brent
176,861
21
-34,867
53
32,127
47
2,740
46
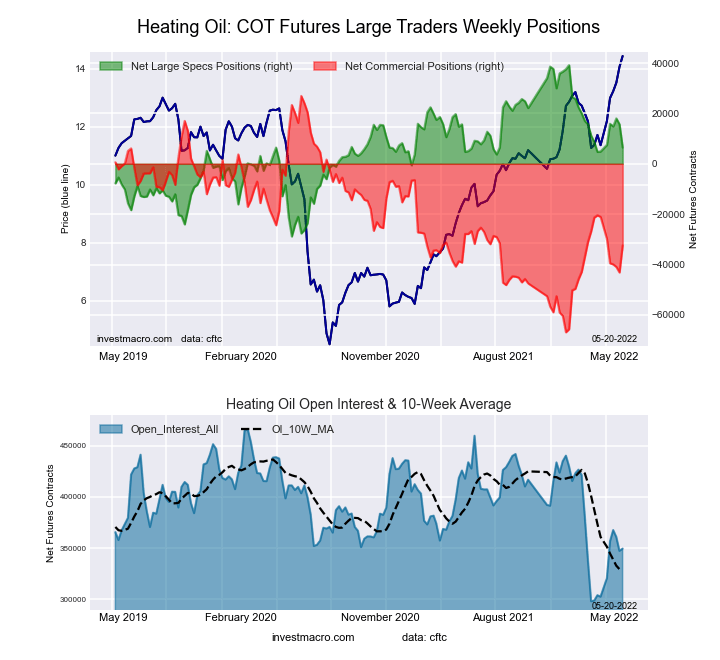
Heating Oil
349,618
31
6,455
52
-32,434
37
25,979
88
Soybeans
709,144
24
183,647
73
-156,937
33
-26,710
26
Corn
1,548,438
29
473,743
91
-424,756
11
-48,987
15
Coffee
206,106
0
38,487
72
-40,949
32
2,462
13
Sugar
825,281
6
196,630
77
-245,374
22
48,744
68
Wheat
326,651
8
28,806
57
-26,020
23
-2,786
98
CORN Futures:
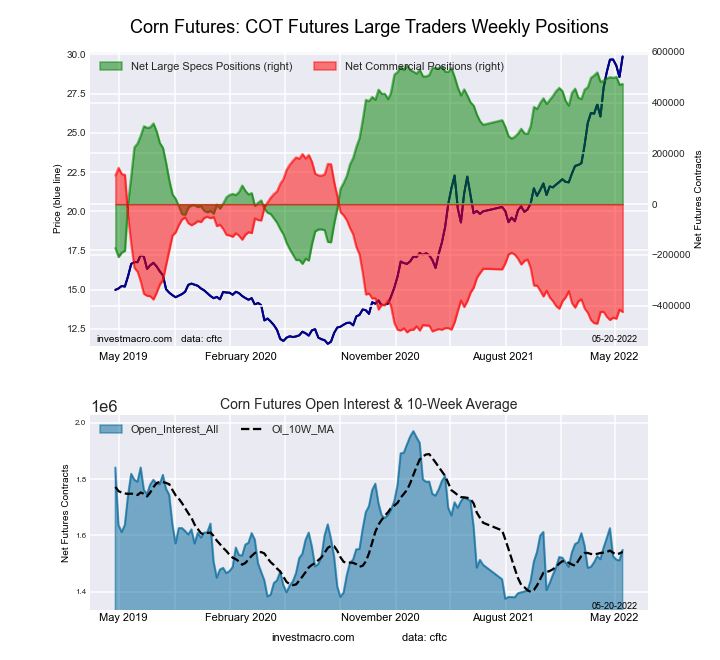
The CORN large speculator standing this week came in at a net position of 473,743 contracts in the data reported through Tuesday. This was a weekly lift of 2,835 contracts from the previous week which had a total of 470,908 net contracts.
This week’s current strength score (the trader positioning range over the past three years, measured from 0 to 100) shows the speculators are currently Bullish-Extreme with a score of 90.6 percent. The commercials are Bearish-Extreme with a score of 11.4 percent and the small traders (not shown in chart) are Bearish-Extreme with a score of 14.8 percent.
CORN Futures Statistics
SPECULATORS
COMMERCIALS
SMALL TRADERS
– Percent of Open Interest Longs:
38.1
42.2
9.3
– Percent of Open Interest Shorts:
7.5
69.6
12.4
– Net Position:
473,743
-424,756
-48,987
– Gross Longs:
589,352
653,039
143,508
– Gross Shorts:
115,609
1,077,795
192,495
– Long to Short Ratio:
5.1 to 1
0.6 to 1
0.7 to 1
NET POSITION TREND:
– Strength Index Score (3 Year Range Pct):
90.6
11.4
14.8
– Strength Index Reading (3 Year Range):
Bullish-Extreme
Bearish-Extreme
Bearish-Extreme
NET POSITION MOVEMENT INDEX:
– 6-Week Change in Strength Index:
-1.7
-0.1
8.0
SUGAR Futures:
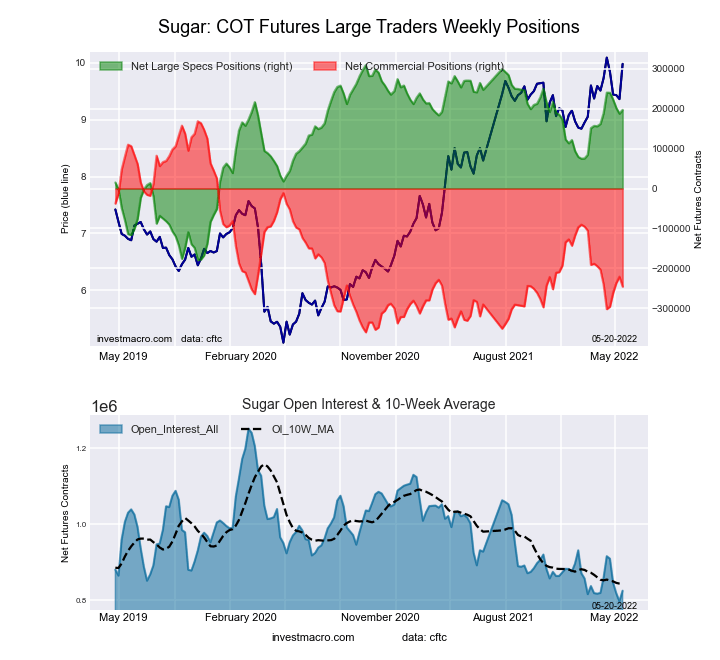
The SUGAR large speculator standing this week came in at a net position of 196,630 contracts in the data reported through Tuesday. This was a weekly advance of 9,445 contracts from the previous week which had a total of 187,185 net contracts.
This week’s current strength score (the trader positioning range over the past three years, measured from 0 to 100) shows the speculators are currently Bullish with a score of 77.0 percent. The commercials are Bearish with a score of 21.6 percent and the small traders (not shown in chart) are Bullish with a score of 68.1 percent.
SUGAR Futures Statistics
SPECULATORS
COMMERCIALS
SMALL TRADERS
– Percent of Open Interest Longs:
30.6
45.9
11.4
– Percent of Open Interest Shorts:
6.8
75.6
5.5
– Net Position:
196,630
-245,374
48,744
– Gross Longs:
252,752
378,422
94,457
– Gross Shorts:
56,122
623,796
45,713
– Long to Short Ratio:
4.5 to 1
0.6 to 1
2.1 to 1
NET POSITION TREND:
– Strength Index Score (3 Year Range Pct):
77.0
21.6
68.1
– Strength Index Reading (3 Year Range):
Bullish
Bearish
Bullish
NET POSITION MOVEMENT INDEX:
– 6-Week Change in Strength Index:
1.7
-1.0
-3.5
COFFEE Futures:
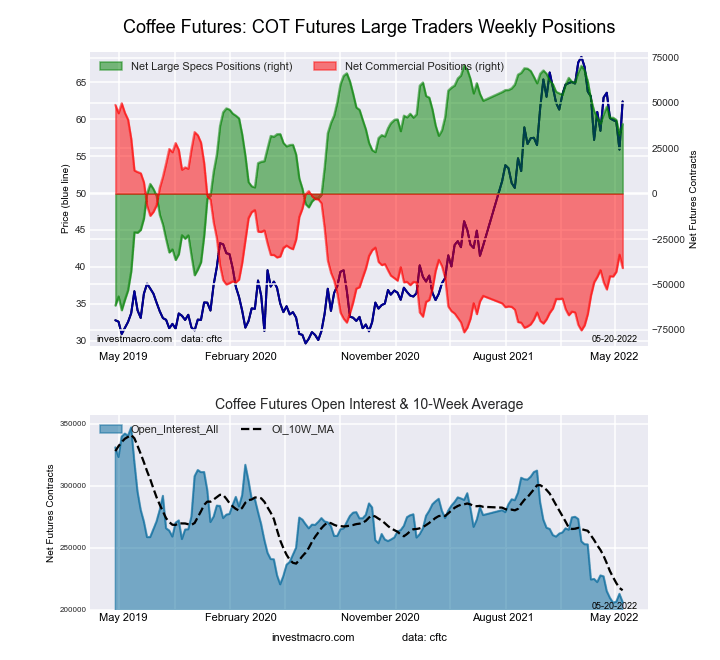
The COFFEE large speculator standing this week came in at a net position of 38,487 contracts in the data reported through Tuesday. This was a weekly increase of 5,932 contracts from the previous week which had a total of 32,555 net contracts.
This week’s current strength score (the trader positioning range over the past three years, measured from 0 to 100) shows the speculators are currently Bullish with a score of 72.1 percent. The commercials are Bearish with a score of 32.1 percent and the small traders (not shown in chart) are Bearish-Extreme with a score of 12.7 percent.
COFFEE Futures Statistics
SPECULATORS
COMMERCIALS
SMALL TRADERS
– Percent of Open Interest Longs:
24.0
54.0
4.1
– Percent of Open Interest Shorts:
5.3
73.9
2.9
– Net Position:
38,487
-40,949
2,462
– Gross Longs:
49,501
111,397
8,495
– Gross Shorts:
11,014
152,346
6,033
– Long to Short Ratio:
4.5 to 1
0.7 to 1
1.4 to 1
NET POSITION TREND:
– Strength Index Score (3 Year Range Pct):
72.1
32.1
12.7
– Strength Index Reading (3 Year Range):
Bullish
Bearish
Bearish-Extreme
NET POSITION MOVEMENT INDEX:
– 6-Week Change in Strength Index:
-4.6
7.1
-21.6
SOYBEANS Futures:
The SOYBEANS large speculator standing this week came in at a net position of 183,647 contracts in the data reported through Tuesday. This was a weekly rise of 9,039 contracts from the previous week which had a total of 174,608 net contracts.
This week’s current strength score (the trader positioning range over the past three years, measured from 0 to 100) shows the speculators are currently Bullish with a score of 72.6 percent. The commercials are Bearish with a score of 33.0 percent and the small traders (not shown in chart) are Bearish with a score of 25.9 percent.
SOYBEANS Futures Statistics
SPECULATORS
COMMERCIALS
SMALL TRADERS
– Percent of Open Interest Longs:
32.7
47.8
7.0
– Percent of Open Interest Shorts:
6.8
69.9
10.8
– Net Position:
183,647
-156,937
-26,710
– Gross Longs:
231,911
338,718
49,750
– Gross Shorts:
48,264
495,655
76,460
– Long to Short Ratio:
4.8 to 1
0.7 to 1
0.7 to 1
NET POSITION TREND:
– Strength Index Score (3 Year Range Pct):
72.6
33.0
25.9
– Strength Index Reading (3 Year Range):
Bullish
Bearish
Bearish
NET POSITION MOVEMENT INDEX:
– 6-Week Change in Strength Index:
-4.3
3.7
2.3
SOYBEAN OIL Futures:
The SOYBEAN OIL large speculator standing this week came in at a net position of 96,301 contracts in the data reported through Tuesday. This was a weekly decline of -4,295 contracts from the previous week which had a total of 100,596 net contracts.
This week’s current strength score (the trader positioning range over the past three years, measured from 0 to 100) shows the speculators are currently Bullish with a score of 72.5 percent. The commercials are Bearish with a score of 23.8 percent and the small traders (not shown in chart) are Bullish-Extreme with a score of 93.4 percent.
SOYBEAN OIL Futures Statistics
SPECULATORS
COMMERCIALS
SMALL TRADERS
– Percent of Open Interest Longs:
31.1
46.1
10.6
– Percent of Open Interest Shorts:
5.2
77.7
4.9
– Net Position:
96,301
-117,724
21,423
– Gross Longs:
115,709
171,880
39,590
– Gross Shorts:
19,408
289,604
18,167
– Long to Short Ratio:
6.0 to 1
0.6 to 1
2.2 to 1
NET POSITION TREND:
– Strength Index Score (3 Year Range Pct):
72.5
23.8
93.4
– Strength Index Reading (3 Year Range):
Bullish
Bearish
Bullish-Extreme
NET POSITION MOVEMENT INDEX:
– 6-Week Change in Strength Index:
4.2
-7.1
21.4
SOYBEAN MEAL Futures:
The SOYBEAN MEAL large speculator standing this week came in at a net position of 73,300 contracts in the data reported through Tuesday. This was a weekly decrease of -10,832 contracts from the previous week which had a total of 84,132 net contracts.
This week’s current strength score (the trader positioning range over the past three years, measured from 0 to 100) shows the speculators are currently Bullish with a score of 68.3 percent. The commercials are Bearish with a score of 30.6 percent and the small traders (not shown in chart) are Bullish with a score of 75.3 percent.
SOYBEAN MEAL Futures Statistics
SPECULATORS
COMMERCIALS
SMALL TRADERS
– Percent of Open Interest Longs:
28.6
47.3
13.9
– Percent of Open Interest Shorts:
8.4
75.2
6.3
– Net Position:
73,300
-100,729
27,429
– Gross Longs:
103,499
171,144
50,082
– Gross Shorts:
30,199
271,873
22,653
– Long to Short Ratio:
3.4 to 1
0.6 to 1
2.2 to 1
NET POSITION TREND:
– Strength Index Score (3 Year Range Pct):
68.3
30.6
75.3
– Strength Index Reading (3 Year Range):
Bullish
Bearish
Bullish
NET POSITION MOVEMENT INDEX:
– 6-Week Change in Strength Index:
-28.1
27.7
-14.2
LIVE CATTLE Futures:
The LIVE CATTLE large speculator standing this week came in at a net position of 35,030 contracts in the data reported through Tuesday. This was a weekly lowering of -4,773 contracts from the previous week which had a total of 39,803 net contracts.
This week’s current strength score (the trader positioning range over the past three years, measured from 0 to 100) shows the speculators are currently Bearish with a score of 22.7 percent. The commercials are Bullish with a score of 70.8 percent and the small traders (not shown in chart) are Bullish with a score of 69.3 percent.
LIVE CATTLE Futures Statistics
SPECULATORS
COMMERCIALS
SMALL TRADERS
– Percent of Open Interest Longs:
35.6
39.2
10.8
– Percent of Open Interest Shorts:
24.0
49.7
12.0
– Net Position:
35,030
-31,417
-3,613
– Gross Longs:
107,168
117,903
32,549
– Gross Shorts:
72,138
149,320
36,162
– Long to Short Ratio:
1.5 to 1
0.8 to 1
0.9 to 1
NET POSITION TREND:
– Strength Index Score (3 Year Range Pct):
22.7
70.8
69.3
– Strength Index Reading (3 Year Range):
Bearish
Bullish
Bullish
NET POSITION MOVEMENT INDEX:
– 6-Week Change in Strength Index:
-17.2
12.4
16.6
LEAN HOGS Futures:
The LEAN HOGS large speculator standing this week came in at a net position of 7,765 contracts in the data reported through Tuesday. This was a weekly lowering of -8,595 contracts from the previous week which had a total of 16,360 net contracts.
This week’s current strength score (the trader positioning range over the past three years, measured from 0 to 100) shows the speculators are currently Bearish-Extreme with a score of 15.2 percent. The commercials are Bullish-Extreme with a score of 90.3 percent and the small traders (not shown in chart) are Bullish with a score of 70.0 percent.
LEAN HOGS Futures Statistics
SPECULATORS
COMMERCIALS
SMALL TRADERS
– Percent of Open Interest Longs:
28.9
39.9
10.5
– Percent of Open Interest Shorts:
25.1
41.2
13.0
– Net Position:
7,765
-2,647
-5,118
– Gross Longs:
58,847
81,203
21,361
– Gross Shorts:
51,082
83,850
26,479
– Long to Short Ratio:
1.2 to 1
1.0 to 1
0.8 to 1
NET POSITION TREND:
– Strength Index Score (3 Year Range Pct):
15.2
90.3
70.0
– Strength Index Reading (3 Year Range):
Bearish-Extreme
Bullish-Extreme
Bullish
NET POSITION MOVEMENT INDEX:
– 6-Week Change in Strength Index:
-41.1
42.7
8.5
COTTON Futures:
The COTTON large speculator standing this week came in at a net position of 79,316 contracts in the data reported through Tuesday. This was a weekly decrease of -2,443 contracts from the previous week which had a total of 81,759 net contracts.
This week’s current strength score (the trader positioning range over the past three years, measured from 0 to 100) shows the speculators are currently Bullish with a score of 73.2 percent. The commercials are Bearish with a score of 24.9 percent and the small traders (not shown in chart) are Bullish-Extreme with a score of 85.4 percent.
COTTON Futures Statistics
SPECULATORS
COMMERCIALS
SMALL TRADERS
– Percent of Open Interest Longs:
45.1
34.6
9.2
– Percent of Open Interest Shorts:
6.0
79.4
3.5
– Net Position:
79,316
-90,872
11,556
– Gross Longs:
91,525
70,065
18,559
– Gross Shorts:
12,209
160,937
7,003
– Long to Short Ratio:
7.5 to 1
0.4 to 1
2.7 to 1
NET POSITION TREND:
– Strength Index Score (3 Year Range Pct):
73.2
24.9
85.4
– Strength Index Reading (3 Year Range):
Bullish
Bearish
Bullish-Extreme
NET POSITION MOVEMENT INDEX:
– 6-Week Change in Strength Index:
-3.2
4.0
-12.1
COCOA Futures:
The COCOA large speculator standing this week came in at a net position of 18,583 contracts in the data reported through Tuesday. This was a weekly fall of -2,463 contracts from the previous week which had a total of 21,046 net contracts.
This week’s current strength score (the trader positioning range over the past three years, measured from 0 to 100) shows the speculators are currently Bearish with a score of 35.8 percent. The commercials are Bullish with a score of 62.9 percent and the small traders (not shown in chart) are Bearish with a score of 47.4 percent.
COCOA Futures Statistics
SPECULATORS
COMMERCIALS
SMALL TRADERS
– Percent of Open Interest Longs:
29.9
44.5
5.7
– Percent of Open Interest Shorts:
23.5
52.6
4.0
– Net Position:
18,583
-23,668
5,085
– Gross Longs:
87,225
129,740
16,687
– Gross Shorts:
68,642
153,408
11,602
– Long to Short Ratio:
1.3 to 1
0.8 to 1
1.4 to 1
NET POSITION TREND:
– Strength Index Score (3 Year Range Pct):
35.8
62.9
47.4
– Strength Index Reading (3 Year Range):
Bearish
Bullish
Bearish
NET POSITION MOVEMENT INDEX:
– 6-Week Change in Strength Index:
-17.7
19.0
-14.9
WHEAT Futures:
The WHEAT large speculator standing this week came in at a net position of 28,806 contracts in the data reported through Tuesday. This was a weekly advance of 7,120 contracts from the previous week which had a total of 21,686 net contracts.
This week’s current strength score (the trader positioning range over the past three years, measured from 0 to 100) shows the speculators are currently Bullish with a score of 56.5 percent. The commercials are Bearish with a score of 22.7 percent and the small traders (not shown in chart) are Bullish-Extreme with a score of 98.3 percent.
*COT Report: The COT data, released weekly to the public each Friday, is updated through the most recent Tuesday (data is 3 days old) and shows a quick view of how large speculators or non-commercials (for-profit traders) were positioned in the futures markets.
The CFTC categorizes trader positions according to commercial hedgers (traders who use futures contracts for hedging as part of the business), non-commercials (large traders who speculate to realize trading profits) and nonreportable traders (usually small traders/speculators) as well as their open interest (contracts open in the market at time of reporting).See CFTC criteria here.
Here are the latest charts and statistics for the Commitment of Traders (COT) data published by the Commodities Futures Trading Commission (CFTC).
The latest COT data is updated through Tuesday May 17th and shows a quick view of how large traders (for-profit speculators and commercial entities) were positioned in the futures markets.
Energy market speculator bets were mixed this week as three out of the six energy markets we cover had higher positioning this week.
Overall, the energy markets with higher speculator bets this week were WTI Crude Oil (14,834 contracts), Gasoline (2,420 contracts) and the Bloomberg Commodity Index (3,624 contracts).
The markets with declining speculator bets this week were Brent Crude Oil (-3,652 contracts), Natural Gas (-2,483 contracts) and Heating Oil (-9,228 contracts).
Data Snapshot of Commodity Market Traders | Columns Legend
May-17-2022
OI
OI-Index
Spec-Net
Spec-Index
Com-Net
COM-Index
Smalls-Net
Smalls-Index
WTI Crude
1,730,665
0
325,637
7
-363,869
95
38,232
69
Gold
555,756
30
175,360
33
-206,879
65
31,519
48
Silver
144,534
11
16,114
38
-24,841
75
8,727
0
Copper
189,483
19
-24,408
25
23,059
75
1,349
33
Palladium
9,114
13
-3,215
3
3,621
97
-406
20
Platinum
65,926
32
2,203
7
-6,697
96
4,494
25
Natural Gas
1,118,417
8
-115,012
44
64,340
51
50,672
100
Brent
176,861
21
-34,867
53
32,127
47
2,740
46
Heating Oil
349,618
31
6,455
52
-32,434
37
25,979
88
Soybeans
709,144
24
183,647
73
-156,937
33
-26,710
26
Corn
1,548,438
29
473,743
91
-424,756
11
-48,987
15
Coffee
206,106
0
38,487
72
-40,949
32
2,462
13
Sugar
825,281
6
196,630
77
-245,374
22
48,744
68
Wheat
326,651
8
28,806
57
-26,020
23
-2,786
98
WTI Crude Oil Futures:
The WTI Crude Oil Futures large speculator standing this week totaled a net position of 325,637 contracts in the data reported through Tuesday. This was a weekly advance of 14,834 contracts from the previous week which had a total of 310,803 net contracts.
This week’s current strength score (the trader positioning range over the past three years, measured from 0 to 100) shows the speculators are currently Bearish-Extreme with a score of 7.3 percent. The commercials are Bullish-Extreme with a score of 94.9 percent and the small traders (not shown in chart) are Bullish with a score of 68.9 percent.
WTI Crude Oil Futures Statistics
SPECULATORS
COMMERCIALS
SMALL TRADERS
– Percent of Open Interest Longs:
24.0
35.3
5.1
– Percent of Open Interest Shorts:
5.2
56.3
2.9
– Net Position:
325,637
-363,869
38,232
– Gross Longs:
416,190
611,264
88,406
– Gross Shorts:
90,553
975,133
50,174
– Long to Short Ratio:
4.6 to 1
0.6 to 1
1.8 to 1
NET POSITION TREND:
– Strength Index Score (3 Year Range Pct):
7.3
94.9
68.9
– Strength Index Reading (3 Year Range):
Bearish-Extreme
Bullish-Extreme
Bullish
NET POSITION MOVEMENT INDEX:
– 6-Week Change in Strength Index:
6.0
-3.3
-12.1
Brent Crude Oil Futures:
The Brent Crude Oil Futures large speculator standing this week totaled a net position of -34,867 contracts in the data reported through Tuesday. This was a weekly reduction of -3,652 contracts from the previous week which had a total of -31,215 net contracts.
This week’s current strength score (the trader positioning range over the past three years, measured from 0 to 100) shows the speculators are currently Bullish with a score of 52.7 percent. The commercials are Bearish with a score of 46.7 percent and the small traders (not shown in chart) are Bearish with a score of 46.3 percent.
Brent Crude Oil Futures Statistics
SPECULATORS
COMMERCIALS
SMALL TRADERS
– Percent of Open Interest Longs:
15.7
50.8
4.7
– Percent of Open Interest Shorts:
35.4
32.7
3.1
– Net Position:
-34,867
32,127
2,740
– Gross Longs:
27,757
89,898
8,270
– Gross Shorts:
62,624
57,771
5,530
– Long to Short Ratio:
0.4 to 1
1.6 to 1
1.5 to 1
NET POSITION TREND:
– Strength Index Score (3 Year Range Pct):
52.7
46.7
46.3
– Strength Index Reading (3 Year Range):
Bullish
Bearish
Bearish
NET POSITION MOVEMENT INDEX:
– 6-Week Change in Strength Index:
-8.7
9.3
-5.9
Natural Gas Futures:
The Natural Gas Futures large speculator standing this week totaled a net position of -115,012 contracts in the data reported through Tuesday. This was a weekly lowering of -2,483 contracts from the previous week which had a total of -112,529 net contracts.
This week’s current strength score (the trader positioning range over the past three years, measured from 0 to 100) shows the speculators are currently Bearish with a score of 44.1 percent. The commercials are Bullish with a score of 51.1 percent and the small traders (not shown in chart) are Bullish-Extreme with a score of 100.0 percent.
Natural Gas Futures Statistics
SPECULATORS
COMMERCIALS
SMALL TRADERS
– Percent of Open Interest Longs:
20.7
37.5
6.8
– Percent of Open Interest Shorts:
31.0
31.7
2.2
– Net Position:
-115,012
64,340
50,672
– Gross Longs:
231,576
419,033
75,523
– Gross Shorts:
346,588
354,693
24,851
– Long to Short Ratio:
0.7 to 1
1.2 to 1
3.0 to 1
NET POSITION TREND:
– Strength Index Score (3 Year Range Pct):
44.1
51.1
100.0
– Strength Index Reading (3 Year Range):
Bearish
Bullish
Bullish-Extreme
NET POSITION MOVEMENT INDEX:
– 6-Week Change in Strength Index:
6.5
-9.0
15.8
Gasoline Blendstock Futures:
The Gasoline Blendstock Futures large speculator standing this week totaled a net position of 33,798 contracts in the data reported through Tuesday. This was a weekly increase of 2,420 contracts from the previous week which had a total of 31,378 net contracts.
This week’s current strength score (the trader positioning range over the past three years, measured from 0 to 100) shows the speculators are currently Bearish-Extreme with a score of 4.5 percent. The commercials are Bullish-Extreme with a score of 90.3 percent and the small traders (not shown in chart) are Bullish-Extreme with a score of 99.1 percent.
Nasdaq Mini Futures Statistics
SPECULATORS
COMMERCIALS
SMALL TRADERS
– Percent of Open Interest Longs:
24.6
52.8
7.9
– Percent of Open Interest Shorts:
13.6
68.0
3.7
– Net Position:
33,798
-46,770
12,972
– Gross Longs:
75,744
162,371
24,256
– Gross Shorts:
41,946
209,141
11,284
– Long to Short Ratio:
1.8 to 1
0.8 to 1
2.1 to 1
NET POSITION TREND:
– Strength Index Score (3 Year Range Pct):
4.5
90.3
99.1
– Strength Index Reading (3 Year Range):
Bearish-Extreme
Bullish-Extreme
Bullish-Extreme
NET POSITION MOVEMENT INDEX:
– 6-Week Change in Strength Index:
-9.3
3.3
39.2
#2 Heating Oil NY-Harbor Futures:
The #2 Heating Oil NY-Harbor Futures large speculator standing this week totaled a net position of 6,455 contracts in the data reported through Tuesday. This was a weekly decline of -9,228 contracts from the previous week which had a total of 15,683 net contracts.
This week’s current strength score (the trader positioning range over the past three years, measured from 0 to 100) shows the speculators are currently Bullish with a score of 51.9 percent. The commercials are Bearish with a score of 36.7 percent and the small traders (not shown in chart) are Bullish-Extreme with a score of 88.4 percent.
Heating Oil Futures Statistics
SPECULATORS
COMMERCIALS
SMALL TRADERS
– Percent of Open Interest Longs:
17.0
50.8
14.4
– Percent of Open Interest Shorts:
15.1
60.1
6.9
– Net Position:
6,455
-32,434
25,979
– Gross Longs:
59,340
177,626
50,210
– Gross Shorts:
52,885
210,060
24,231
– Long to Short Ratio:
1.1 to 1
0.8 to 1
2.1 to 1
NET POSITION TREND:
– Strength Index Score (3 Year Range Pct):
51.9
36.7
88.4
– Strength Index Reading (3 Year Range):
Bullish
Bearish
Bullish-Extreme
NET POSITION MOVEMENT INDEX:
– 6-Week Change in Strength Index:
4.2
-10.3
23.6
Bloomberg Commodity Index Futures:
The Bloomberg Commodity Index Futures large speculator standing this week totaled a net position of -9,639 contracts in the data reported through Tuesday. This was a weekly advance of 3,624 contracts from the previous week which had a total of -13,263 net contracts.
This week’s current strength score (the trader positioning range over the past three years, measured from 0 to 100) shows the speculators are currently Bullish with a score of 70.6 percent. The commercials are Bearish with a score of 27.9 percent and the small traders (not shown in chart) are Bearish with a score of 42.1 percent.
*COT Report: The COT data, released weekly to the public each Friday, is updated through the most recent Tuesday (data is 3 days old) and shows a quick view of how large speculators or non-commercials (for-profit traders) were positioned in the futures markets.
The CFTC categorizes trader positions according to commercial hedgers (traders who use futures contracts for hedging as part of the business), non-commercials (large traders who speculate to realize trading profits) and nonreportable traders (usually small traders/speculators) as well as their open interest (contracts open in the market at time of reporting).See CFTC criteria here.
Here are the latest charts and statistics for the Commitment of Traders (COT) data published by the Commodities Futures Trading Commission (CFTC).
The latest COT data is updated through Tuesday May 17th and shows a quick view of how large traders (for-profit speculators and commercial entities) were positioned in the futures markets.
Bonds market speculator bets were mostly lower this week as five out of the eight bond markets we cover had lower positioning this week. Most of these markets remain bearish (speculator levels and price levels) in the higher interest rate environment of 2022. The exceptions in the COT speculator positioning are the Fed Funds positions which recently turned positive in early April and have maintained a small bullish level in six out of the past seven weeks. The US Treasury Bond positions also turned positive in early March and have also had a small bullish position in nine out of the past eleven weeks.
Overall, the bond markets with higher speculator bets for this week were Long US Bond (16,554 contracts), 5-Year Bond (65,450 contracts) and the Ultra US Bond (16,954 contracts).
The markets with declining speculator bets this week were the 2-Year Bond (-7,808 contracts), Eurodollar (-273,864 contracts), 10-Year Bond (-74,119 contracts), Ultra 10-Year (-2,421 contracts) and the Fed Funds (-147 contracts).
Speculator strength standings for each Commodity where strength index is current net position compared to past three years, above 80 is bullish extreme, below 20 is bearish extreme OI Strength = Current Open Interest level compared to last 3 years range Spec Strength = Current Net Speculator level compared to last 3 years range Strength Move = Six week change of Spec Strength
The 3-Month Eurodollars large speculator standing this week reached a net position of -2,874,451 contracts in the data reported through Tuesday. This was a weekly decline of -273,864 contracts from the previous week which had a total of -2,600,587 net contracts.
This week’s current strength score (the trader positioning range over the past three years, measured from 0 to 100) shows the speculators are currently Bearish-Extreme with a score of 0.0 percent. The commercials are Bullish-Extreme with a score of 100.0 percent and the small traders (not shown in chart) are Bearish-Extreme with a score of 10.6 percent.
3-Month Eurodollars Statistics
SPECULATORS
COMMERCIALS
SMALL TRADERS
– Percent of Open Interest Longs:
3.2
76.0
3.7
– Percent of Open Interest Shorts:
30.9
44.2
7.8
– Net Position:
-2,874,451
3,300,959
-426,508
– Gross Longs:
336,958
7,889,274
386,384
– Gross Shorts:
3,211,409
4,588,315
812,892
– Long to Short Ratio:
0.1 to 1
1.7 to 1
0.5 to 1
NET POSITION TREND:
– Strength Index Score (3 Year Range Pct):
0.0
100.0
10.6
– Strength Index Reading (3 Year Range):
Bearish-Extreme
Bullish-Extreme
Bearish-Extreme
NET POSITION MOVEMENT INDEX:
– 6-Week Change in Strength Index:
-6.5
5.9
4.6
30-Day Federal Funds Futures:
The 30-Day Federal Funds large speculator standing this week reached a net position of 49,015 contracts in the data reported through Tuesday. This was a weekly lowering of -147 contracts from the previous week which had a total of 49,162 net contracts.
This week’s current strength score (the trader positioning range over the past three years, measured from 0 to 100) shows the speculators are currently Bearish with a score of 45.7 percent. The commercials are Bullish with a score of 54.4 percent and the small traders (not shown in chart) are Bullish with a score of 50.7 percent.
30-Day Federal Funds Statistics
SPECULATORS
COMMERCIALS
SMALL TRADERS
– Percent of Open Interest Longs:
5.6
75.5
2.1
– Percent of Open Interest Shorts:
2.8
78.0
2.3
– Net Position:
49,015
-45,484
-3,531
– Gross Longs:
100,043
1,355,889
37,674
– Gross Shorts:
51,028
1,401,373
41,205
– Long to Short Ratio:
2.0 to 1
1.0 to 1
0.9 to 1
NET POSITION TREND:
– Strength Index Score (3 Year Range Pct):
45.7
54.4
50.7
– Strength Index Reading (3 Year Range):
Bearish
Bullish
Bullish
NET POSITION MOVEMENT INDEX:
– 6-Week Change in Strength Index:
4.6
-5.3
16.5
2-Year Treasury Note Futures:
The 2-Year Treasury Note large speculator standing this week reached a net position of -134,637 contracts in the data reported through Tuesday. This was a weekly lowering of -7,808 contracts from the previous week which had a total of -126,829 net contracts.
This week’s current strength score (the trader positioning range over the past three years, measured from 0 to 100) shows the speculators are currently Bullish with a score of 55.1 percent. The commercials are Bullish with a score of 65.6 percent and the small traders (not shown in chart) are Bearish-Extreme with a score of 17.6 percent.
2-Year Treasury Note Statistics
SPECULATORS
COMMERCIALS
SMALL TRADERS
– Percent of Open Interest Longs:
13.0
76.6
5.8
– Percent of Open Interest Shorts:
18.6
67.8
8.9
– Net Position:
-134,637
209,074
-74,437
– Gross Longs:
307,951
1,818,876
137,690
– Gross Shorts:
442,588
1,609,802
212,127
– Long to Short Ratio:
0.7 to 1
1.1 to 1
0.6 to 1
NET POSITION TREND:
– Strength Index Score (3 Year Range Pct):
55.1
65.6
17.6
– Strength Index Reading (3 Year Range):
Bullish
Bullish
Bearish-Extreme
NET POSITION MOVEMENT INDEX:
– 6-Week Change in Strength Index:
-12.6
8.0
10.7
5-Year Treasury Note Futures:
The 5-Year Treasury Note large speculator standing this week reached a net position of -260,224 contracts in the data reported through Tuesday. This was a weekly boost of 65,450 contracts from the previous week which had a total of -325,674 net contracts.
This week’s current strength score (the trader positioning range over the past three years, measured from 0 to 100) shows the speculators are currently Bearish with a score of 37.5 percent. The commercials are Bullish with a score of 64.2 percent and the small traders (not shown in chart) are Bearish with a score of 37.8 percent.
5-Year Treasury Note Statistics
SPECULATORS
COMMERCIALS
SMALL TRADERS
– Percent of Open Interest Longs:
7.9
81.1
7.5
– Percent of Open Interest Shorts:
14.7
70.1
11.7
– Net Position:
-260,224
417,629
-157,405
– Gross Longs:
298,615
3,074,092
284,595
– Gross Shorts:
558,839
2,656,463
442,000
– Long to Short Ratio:
0.5 to 1
1.2 to 1
0.6 to 1
NET POSITION TREND:
– Strength Index Score (3 Year Range Pct):
37.5
64.2
37.8
– Strength Index Reading (3 Year Range):
Bearish
Bullish
Bearish
NET POSITION MOVEMENT INDEX:
– 6-Week Change in Strength Index:
13.7
-16.5
15.8
10-Year Treasury Note Futures:
The 10-Year Treasury Note large speculator standing this week reached a net position of -160,091 contracts in the data reported through Tuesday. This was a weekly decline of -74,119 contracts from the previous week which had a total of -85,972 net contracts.
This week’s current strength score (the trader positioning range over the past three years, measured from 0 to 100) shows the speculators are currently Bearish with a score of 48.1 percent. The commercials are Bullish with a score of 59.7 percent and the small traders (not shown in chart) are Bearish with a score of 42.1 percent.
10-Year Treasury Note Statistics
SPECULATORS
COMMERCIALS
SMALL TRADERS
– Percent of Open Interest Longs:
8.6
76.9
8.9
– Percent of Open Interest Shorts:
12.9
68.2
13.2
– Net Position:
-160,091
318,592
-158,501
– Gross Longs:
314,613
2,819,008
325,049
– Gross Shorts:
474,704
2,500,416
483,550
– Long to Short Ratio:
0.7 to 1
1.1 to 1
0.7 to 1
NET POSITION TREND:
– Strength Index Score (3 Year Range Pct):
48.1
59.7
42.1
– Strength Index Reading (3 Year Range):
Bearish
Bullish
Bearish
NET POSITION MOVEMENT INDEX:
– 6-Week Change in Strength Index:
30.8
-29.7
11.0
Ultra 10-Year Notes Futures:
The Ultra 10-Year Notes large speculator standing this week reached a net position of -97,837 contracts in the data reported through Tuesday. This was a weekly fall of -2,421 contracts from the previous week which had a total of -95,416 net contracts.
This week’s current strength score (the trader positioning range over the past three years, measured from 0 to 100) shows the speculators are currently Bearish-Extreme with a score of 3.4 percent. The commercials are Bullish-Extreme with a score of 91.8 percent and the small traders (not shown in chart) are Bullish with a score of 53.8 percent.
Ultra 10-Year Notes Statistics
SPECULATORS
COMMERCIALS
SMALL TRADERS
– Percent of Open Interest Longs:
4.6
81.6
12.2
– Percent of Open Interest Shorts:
12.6
65.2
20.7
– Net Position:
-97,837
200,995
-103,158
– Gross Longs:
56,209
1,000,137
150,063
– Gross Shorts:
154,046
799,142
253,221
– Long to Short Ratio:
0.4 to 1
1.3 to 1
0.6 to 1
NET POSITION TREND:
– Strength Index Score (3 Year Range Pct):
3.4
91.8
53.8
– Strength Index Reading (3 Year Range):
Bearish-Extreme
Bullish-Extreme
Bullish
NET POSITION MOVEMENT INDEX:
– 6-Week Change in Strength Index:
-0.6
-8.2
20.7
US Treasury Bonds Futures:
The US Treasury Bonds large speculator standing this week reached a net position of 32,007 contracts in the data reported through Tuesday. This was a weekly increase of 16,554 contracts from the previous week which had a total of 15,453 net contracts.
This week’s current strength score (the trader positioning range over the past three years, measured from 0 to 100) shows the speculators are currently Bullish-Extreme with a score of 95.0 percent. The commercials are Bearish-Extreme with a score of 15.5 percent and the small traders (not shown in chart) are Bearish with a score of 38.8 percent.
US Treasury Bonds Statistics
SPECULATORS
COMMERCIALS
SMALL TRADERS
– Percent of Open Interest Longs:
11.7
72.5
12.3
– Percent of Open Interest Shorts:
9.2
73.6
13.7
– Net Position:
32,007
-14,575
-17,432
– Gross Longs:
146,002
902,140
152,520
– Gross Shorts:
113,995
916,715
169,952
– Long to Short Ratio:
1.3 to 1
1.0 to 1
0.9 to 1
NET POSITION TREND:
– Strength Index Score (3 Year Range Pct):
95.0
15.5
38.8
– Strength Index Reading (3 Year Range):
Bullish-Extreme
Bearish-Extreme
Bearish
NET POSITION MOVEMENT INDEX:
– 6-Week Change in Strength Index:
10.0
-7.4
-6.1
Ultra US Treasury Bonds Futures:
The Ultra US Treasury Bonds large speculator standing this week reached a net position of -294,559 contracts in the data reported through Tuesday. This was a weekly gain of 16,954 contracts from the previous week which had a total of -311,513 net contracts.
This week’s current strength score (the trader positioning range over the past three years, measured from 0 to 100) shows the speculators are currently Bullish with a score of 65.1 percent. The commercials are Bearish with a score of 44.2 percent and the small traders (not shown in chart) are Bullish with a score of 50.1 percent.
*COT Report: The COT data, released weekly to the public each Friday, is updated through the most recent Tuesday (data is 3 days old) and shows a quick view of how large speculators or non-commercials (for-profit traders) were positioned in the futures markets.
The CFTC categorizes trader positions according to commercial hedgers (traders who use futures contracts for hedging as part of the business), non-commercials (large traders who speculate to realize trading profits) and nonreportable traders (usually small traders/speculators) as well as their open interest (contracts open in the market at time of reporting).See CFTC criteria here.