
By InvestMacro | COT | Data Tables | COT Leaders | Downloads | COT Newsletter
Here are the latest charts and statistics for the Commitment of Traders (COT) data published by the Commodities Futures Trading Commission (CFTC).
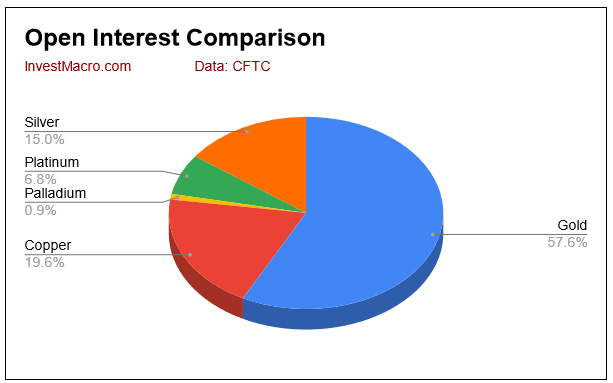
The latest COT data is updated through Tuesday May 17th and shows a quick view of how large traders (for-profit speculators and commercial entities) were positioned in the futures markets.
Highlighting the COT metals data is the recent decrease in the Gold and Copper speculative positions. Gold speculator bets fell this week for the fifth straight week and for the eighth time in the past ten weeks as sentiment for the shiny metal has dulled over the past few months. This latest 5-week decline has amounted to a total reduction of -78,927 contracts from the speculator position. The current speculator standing for Gold remains in bullish position but has descended to lowest level of the past fifteen weeks (at +175,360 contracts), dating back to early February.
Despite the speculator decline, the gold price rebounded by over 1 percent this week (close near $1,842 per ounce) following four straight weeks of decline that brought the Gold futures price down from a high of over $2,000 per ounce in mid-April to roughly $1,800 per ounce to close out last week.
Free Reports:
 Get our Weekly Commitment of Traders Reports - See where the biggest traders (Hedge Funds and Commercial Hedgers) are positioned in the futures markets on a weekly basis.
 Download Our Metatrader 4 Indicators – Put Our Free MetaTrader 4 Custom Indicators on your charts when you join our Weekly Newsletter
Copper speculator bets have also cooled over the past couple months and fell this week for the sixth consecutive week. This decline has taken a whopping -60,550 contracts off the speculator position and has dropped the spec level from +36,142 contracts on April 5th to -24,408 contracts this week. This week’s total marks the lowest level for Copper bets in the past 109 weeks, dating back to April 14th of 2020. The slowdown in the Chinese economy and the Covid shutdowns in China have put a dent in the Copper sentiment as China is one of the largest world producers of Copper and is the largest consumer of Copper in the world.
Overall, the markets with higher speculator bets this week were just Platinum (840 contracts) and Palladium (30 contracts).
The markets with declining speculator bets this week were Gold (-17,955 contracts), Silver (-2,968 contracts) and Copper (-1,782 contracts).
| May-17-2022 | OI | OI-Index | Spec-Net | Spec-Index | Com-Net | COM-Index | Smalls-Net | Smalls-Index |
|---|---|---|---|---|---|---|---|---|
| WTI Crude | 1,730,665 | 0 | 325,637 | 7 | -363,869 | 95 | 38,232 | 69 |
| Gold | 555,756 | 30 | 175,360 | 33 | -206,879 | 65 | 31,519 | 48 |
| Silver | 144,534 | 11 | 16,114 | 38 | -24,841 | 75 | 8,727 | 0 |
| Copper | 189,483 | 19 | -24,408 | 25 | 23,059 | 75 | 1,349 | 33 |
| Palladium | 9,114 | 13 | -3,215 | 3 | 3,621 | 97 | -406 | 20 |
| Platinum | 65,926 | 32 | 2,203 | 7 | -6,697 | 96 | 4,494 | 25 |
| Natural Gas | 1,118,417 | 8 | -115,012 | 44 | 64,340 | 51 | 50,672 | 100 |
| Brent | 176,861 | 21 | -34,867 | 53 | 32,127 | 47 | 2,740 | 46 |
| Heating Oil | 349,618 | 31 | 6,455 | 52 | -32,434 | 37 | 25,979 | 88 |
| Soybeans | 709,144 | 24 | 183,647 | 73 | -156,937 | 33 | -26,710 | 26 |
| Corn | 1,548,438 | 29 | 473,743 | 91 | -424,756 | 11 | -48,987 | 15 |
| Coffee | 206,106 | 0 | 38,487 | 72 | -40,949 | 32 | 2,462 | 13 |
| Sugar | 825,281 | 6 | 196,630 | 77 | -245,374 | 22 | 48,744 | 68 |
| Wheat | 326,651 | 8 | 28,806 | 57 | -26,020 | 23 | -2,786 | 98 |
Gold Comex Futures:
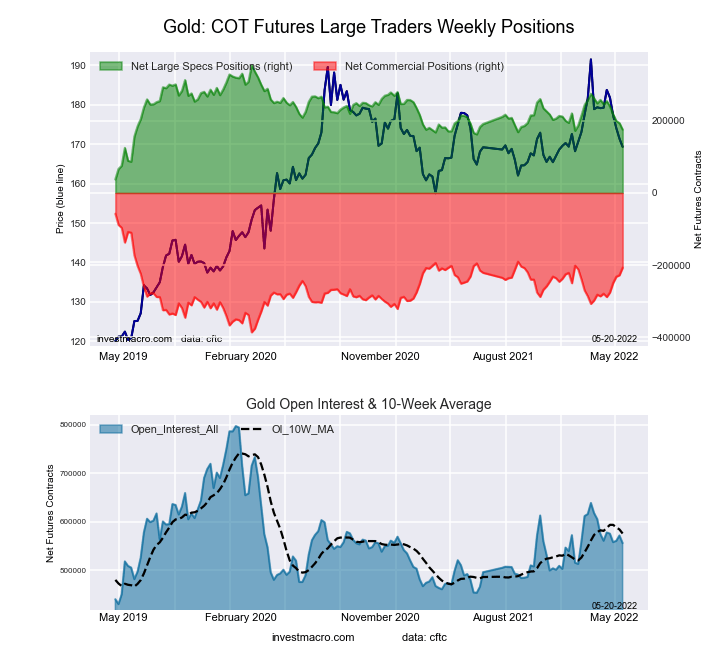 The Gold Comex Futures large speculator standing this week came in at a net position of 175,360 contracts in the data reported through Tuesday. This was a weekly reduction of -17,955 contracts from the previous week which had a total of 193,315 net contracts.
This week’s current strength score (the trader positioning range over the past three years, measured from 0 to 100) shows the speculators are currently Bearish with a score of 33.2 percent. The commercials are Bullish with a score of 64.8 percent and the small traders (not shown in chart) are Bearish with a score of 48.0 percent.
| Gold Futures Statistics | SPECULATORS | COMMERCIALS | SMALL TRADERS |
| – Percent of Open Interest Longs: | 50.9 | 24.8 | 9.1 |
| – Percent of Open Interest Shorts: | 19.4 | 62.0 | 3.4 |
| – Net Position: | 175,360 | -206,879 | 31,519 |
| – Gross Longs: | 283,011 | 137,687 | 50,588 |
| – Gross Shorts: | 107,651 | 344,566 | 19,069 |
| – Long to Short Ratio: | 2.6 to 1 | 0.4 to 1 | 2.7 to 1 |
| NET POSITION TREND: | |||
| – Strength Index Score (3 Year Range Pct): | 33.2 | 64.8 | 48.0 |
| – Strength Index Reading (3 Year Range): | Bearish | Bullish | Bearish |
| NET POSITION MOVEMENT INDEX: | |||
| – 6-Week Change in Strength Index: | -26.3 | 26.1 | -5.4 |
Silver Comex Futures:
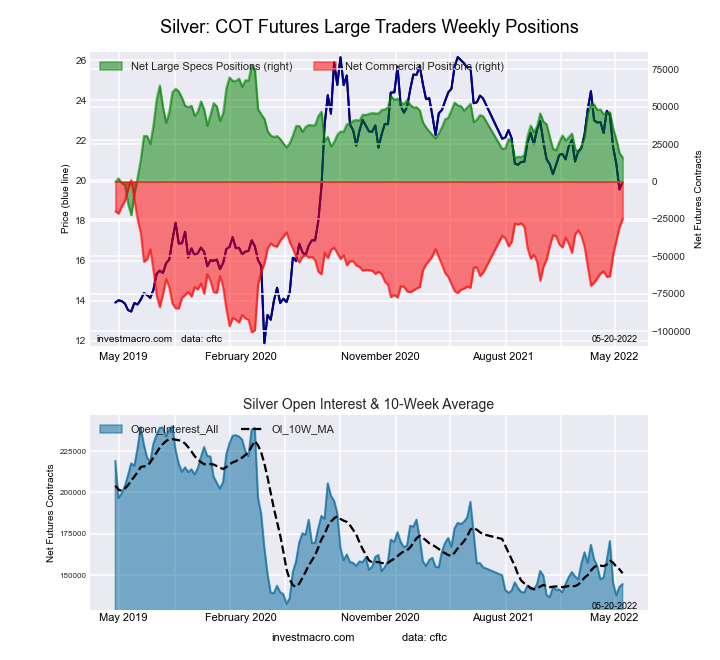 The Silver Comex Futures large speculator standing this week came in at a net position of 16,114 contracts in the data reported through Tuesday. This was a weekly decline of -2,968 contracts from the previous week which had a total of 19,082 net contracts.
This week’s current strength score (the trader positioning range over the past three years, measured from 0 to 100) shows the speculators are currently Bearish with a score of 38.4 percent. The commercials are Bullish with a score of 74.5 percent and the small traders (not shown in chart) are Bearish-Extreme with a score of 0.0 percent.
| Silver Futures Statistics | SPECULATORS | COMMERCIALS | SMALL TRADERS |
| – Percent of Open Interest Longs: | 41.4 | 37.6 | 16.0 |
| – Percent of Open Interest Shorts: | 30.3 | 54.7 | 10.0 |
| – Net Position: | 16,114 | -24,841 | 8,727 |
| – Gross Longs: | 59,857 | 54,287 | 23,121 |
| – Gross Shorts: | 43,743 | 79,128 | 14,394 |
| – Long to Short Ratio: | 1.4 to 1 | 0.7 to 1 | 1.6 to 1 |
| NET POSITION TREND: | |||
| – Strength Index Score (3 Year Range Pct): | 38.4 | 74.5 | 0.0 |
| – Strength Index Reading (3 Year Range): | Bearish | Bullish | Bearish-Extreme |
| NET POSITION MOVEMENT INDEX: | |||
| – 6-Week Change in Strength Index: | -28.8 | 34.5 | -34.4 |
Copper Grade #1 Futures:
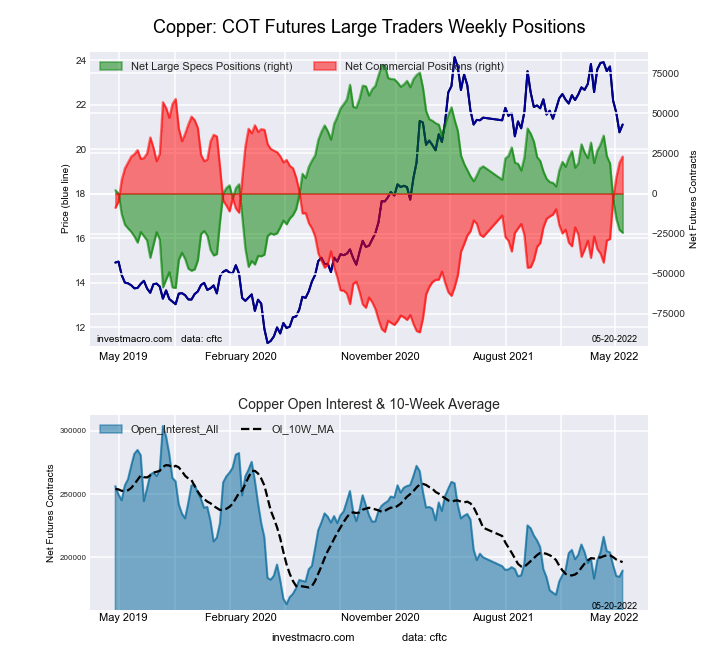 The Copper Grade #1 Futures large speculator standing this week came in at a net position of -24,408 contracts in the data reported through Tuesday. This was a weekly decrease of -1,782 contracts from the previous week which had a total of -22,626 net contracts.
This week’s current strength score (the trader positioning range over the past three years, measured from 0 to 100) shows the speculators are currently Bearish with a score of 24.8 percent. The commercials are Bullish with a score of 75.3 percent and the small traders (not shown in chart) are Bearish with a score of 33.1 percent.
| Copper Futures Statistics | SPECULATORS | COMMERCIALS | SMALL TRADERS |
| – Percent of Open Interest Longs: | 28.1 | 53.6 | 8.3 |
| – Percent of Open Interest Shorts: | 40.9 | 41.4 | 7.6 |
| – Net Position: | -24,408 | 23,059 | 1,349 |
| – Gross Longs: | 53,159 | 101,533 | 15,747 |
| – Gross Shorts: | 77,567 | 78,474 | 14,398 |
| – Long to Short Ratio: | 0.7 to 1 | 1.3 to 1 | 1.1 to 1 |
| NET POSITION TREND: | |||
| – Strength Index Score (3 Year Range Pct): | 24.8 | 75.3 | 33.1 |
| – Strength Index Reading (3 Year Range): | Bearish | Bullish | Bearish |
| NET POSITION MOVEMENT INDEX: | |||
| – 6-Week Change in Strength Index: | -43.6 | 45.4 | -32.1 |
Platinum Futures:
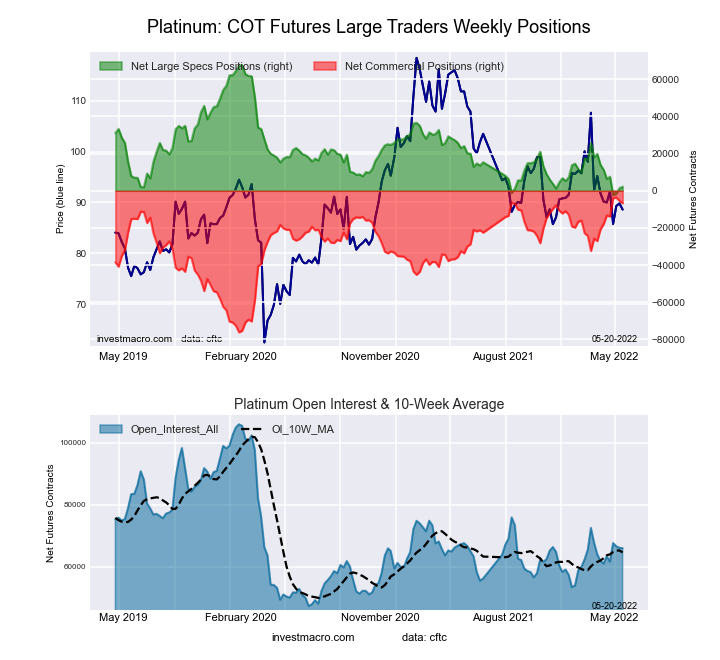 The Platinum Futures large speculator standing this week came in at a net position of 2,203 contracts in the data reported through Tuesday. This was a weekly advance of 840 contracts from the previous week which had a total of 1,363 net contracts.
This week’s current strength score (the trader positioning range over the past three years, measured from 0 to 100) shows the speculators are currently Bearish-Extreme with a score of 6.5 percent. The commercials are Bullish-Extreme with a score of 95.8 percent and the small traders (not shown in chart) are Bearish with a score of 24.7 percent.
| Platinum Futures Statistics | SPECULATORS | COMMERCIALS | SMALL TRADERS |
| – Percent of Open Interest Longs: | 42.9 | 39.4 | 12.2 |
| – Percent of Open Interest Shorts: | 39.5 | 49.6 | 5.4 |
| – Net Position: | 2,203 | -6,697 | 4,494 |
| – Gross Longs: | 28,253 | 26,002 | 8,051 |
| – Gross Shorts: | 26,050 | 32,699 | 3,557 |
| – Long to Short Ratio: | 1.1 to 1 | 0.8 to 1 | 2.3 to 1 |
| NET POSITION TREND: | |||
| – Strength Index Score (3 Year Range Pct): | 6.5 | 95.8 | 24.7 |
| – Strength Index Reading (3 Year Range): | Bearish-Extreme | Bullish-Extreme | Bearish |
| NET POSITION MOVEMENT INDEX: | |||
| – 6-Week Change in Strength Index: | -13.0 | 15.5 | -29.7 |
Palladium Futures:
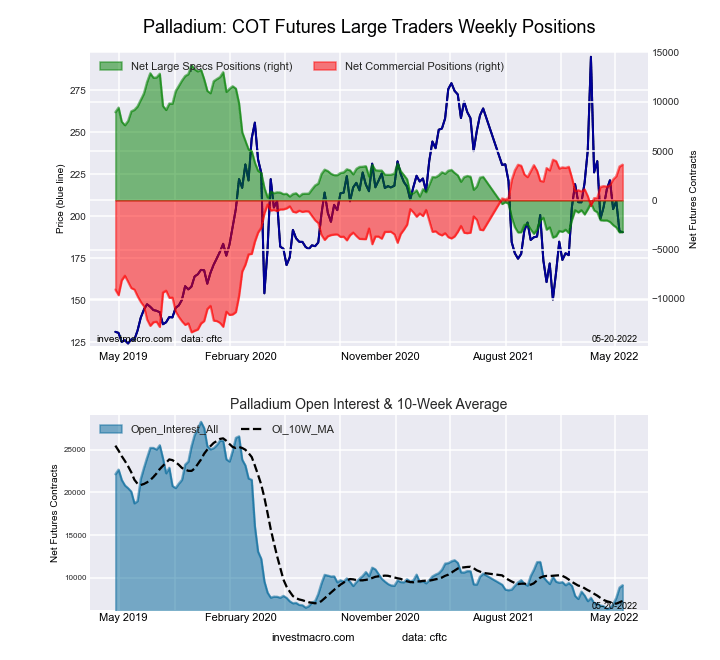 The Palladium Futures large speculator standing this week came in at a net position of -3,215 contracts in the data reported through Tuesday. This was a weekly rise of 30 contracts from the previous week which had a total of -3,245 net contracts.
This week’s current strength score (the trader positioning range over the past three years, measured from 0 to 100) shows the speculators are currently Bearish-Extreme with a score of 3.2 percent. The commercials are Bullish-Extreme with a score of 97.1 percent and the small traders (not shown in chart) are Bearish with a score of 20.4 percent.
| Palladium Futures Statistics | SPECULATORS | COMMERCIALS | SMALL TRADERS |
| – Percent of Open Interest Longs: | 10.9 | 62.7 | 11.2 |
| – Percent of Open Interest Shorts: | 46.2 | 22.9 | 15.7 |
| – Net Position: | -3,215 | 3,621 | -406 |
| – Gross Longs: | 996 | 5,712 | 1,021 |
| – Gross Shorts: | 4,211 | 2,091 | 1,427 |
| – Long to Short Ratio: | 0.2 to 1 | 2.7 to 1 | 0.7 to 1 |
| NET POSITION TREND: | |||
| – Strength Index Score (3 Year Range Pct): | 3.2 | 97.1 | 20.4 |
| – Strength Index Reading (3 Year Range): | Bearish-Extreme | Bullish-Extreme | Bearish |
| NET POSITION MOVEMENT INDEX: | |||
| – 6-Week Change in Strength Index: | -6.7 | 12.4 | -58.1 |
Article By InvestMacro – Receive our weekly COT Reports by Email
*COT Report: The COT data, released weekly to the public each Friday, is updated through the most recent Tuesday (data is 3 days old) and shows a quick view of how large speculators or non-commercials (for-profit traders) were positioned in the futures markets.
The CFTC categorizes trader positions according to commercial hedgers (traders who use futures contracts for hedging as part of the business), non-commercials (large traders who speculate to realize trading profits) and nonreportable traders (usually small traders/speculators) as well as their open interest (contracts open in the market at time of reporting).See CFTC criteria here.

- Geopolitical and macroeconomic conditions continue to pressure market sentiment Jul 20, 2026
- USD/JPY Poised to Continue Gains as Expensive Oil and Lack of Support Weigh on Yen Jul 20, 2026
- COT Metals Charts: Weekly Speculator Bets led by Copper & Steel Jul 18, 2026
- COT Bonds Charts: Weekly Speculator Bets led by 2-Year, SOFR 3M & 5-Year Bonds Jul 18, 2026
- COT Energy Charts: Weekly Speculator Bets led by Brent Oil & Heating Oil Jul 18, 2026
- COT Soft Commodities Charts: Weekly Speculator Bets led by Wheat, Corn & Soybean Meal Jul 18, 2026
- The Bank of Canada kept its interest rate unchanged. Platinum prices reached a three‑week high Jul 16, 2026
- Stock indices rose after the release of US inflation data. China’s GDP slowed sharply Jul 15, 2026
- GBP/USD Awaits Political News: What Will Happen Next Jul 15, 2026
- USD/JPY Holds at Highs: Pressure Lingers on Yen Jul 14, 2026