By InvestMacro
Here are the latest charts and statistics for the Commitment of Traders (COT) data published by the Commodities Futures Trading Commission (CFTC).
The latest COT data is updated through Tuesday December 6th and shows a quick view of how large market participants (for-profit speculators and commercial traders) were positioned in the futures markets. All currency positions are in direct relation to the US dollar where, for example, a bet for the euro is a bet that the euro will rise versus the dollar while a bet against the euro will be a bet that the euro will decline versus the dollar.
British pound sterling & Australian dollar lead Weekly Speculator Changes
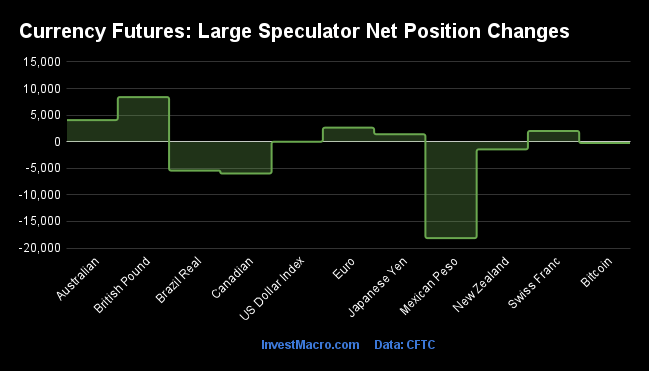
COT currency market speculator bets were slightly lower this week as five out of the eleven currency markets we cover had higher positioning while the other six markets had lower speculator contracts.
Leading the gains for the currency markets was the British pound sterling (8,391 contracts) with the Australian dollar (4,067 contracts), the Euro (2,636 contracts), the Swiss franc (2,017 contracts) and the Japanese yen (1,398 contracts) also showing a positive week.
The currencies leading the declines in speculator bets this week were the Mexican peso (-18,134 contracts) with the Canadian dollar (-5,974 contracts), the Brazilian real (-5,439 contracts), the New Zealand dollar (-1,444 contracts), Bitcoin (-257 contracts) and the US Dollar Index (-6 contracts) also registering lower bets on the week.
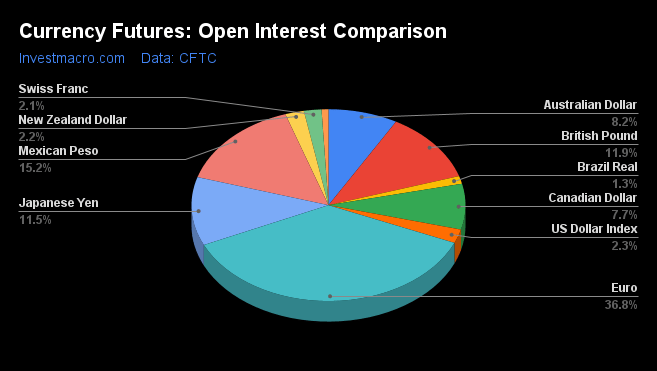
Highlighting the COT currency data this week is the rising Euro positioning. Large speculators increased their bullish bets for the Euro this week for the seventh time out of the past eight weeks and for the twelfth time out of the past thirteen weeks. The Euro speculator position has gone from a total of -47,676 contracts on August 30th to a total of +124,883 contracts this week for a thirteen-week change of +172,559 contracts. The current speculator standing for the Euro has now ascended to the most bullish level since March 2nd of 2021, a span of ninety-two weeks.
The Euro (EURUSD) price has been on a bullish trend as well since falling to an approximate 20-year low in September at a below parity exchange rate of 0.9593. Since the September low, the Euro has rallied by approximately 9 percent and is now trading at the highest levels since June with this week’s close above the 1.0550 exchange rate.
| Dec-06-2022 | OI | OI-Index | Spec-Net | Spec-Index | Com-Net | COM-Index | Smalls-Net | Smalls-Index |
|---|
| USD Index | 45,115 | 56 | 24,886 | 66 | -27,540 | 32 | 2,654 | 46 |
| EUR | 711,537 | 84 | 124,883 | 73 | -160,005 | 31 | 35,122 | 35 |
| GBP | 230,311 | 55 | -28,193 | 45 | 37,774 | 60 | -9,581 | 39 |
| JPY | 223,424 | 64 | -65,996 | 28 | 75,202 | 72 | -9,206 | 35 |
| CHF | 40,171 | 33 | -12,230 | 22 | 17,859 | 74 | -5,629 | 38 |
| CAD | 148,891 | 29 | -22,090 | 15 | 22,905 | 88 | -815 | 28 |
| AUD | 158,755 | 51 | -40,563 | 47 | 42,820 | 51 | -2,257 | 47 |
| NZD | 42,954 | 36 | -6,498 | 37 | 6,301 | 61 | 197 | 54 |
| MXN | 293,708 | 93 | 47,952 | 48 | -53,360 | 51 | 5,408 | 66 |
| RUB | 20,930 | 4 | 7,543 | 31 | -7,150 | 69 | -393 | 24 |
| BRL | 25,464 | 7 | 2,198 | 48 | -4,324 | 51 | 2,126 | 86 |
| Bitcoin | 15,769 | 83 | 67 | 78 | -568 | 0 | 501 | 24 |
Strength Scores led by Bitcoin & EuroFX
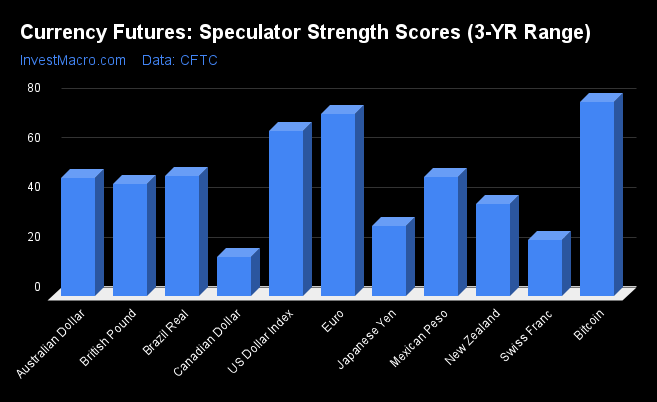
Strength Scores (a normalized measure of Speculator positions over a 3-Year range, from 0 to 100 where above 80 is extreme bullish and below 20 is extreme bearish) showed that Bitcoin (78.1 percent) and the EuroFX (73.3 percent) lead the currency markets currently. The US Dollar Index (66.4 percent) comes in as the next highest in the currency markets in strength scores.
On the downside, the Canadian Dollar (15.5 percent) comes in at the lowest strength level currently and the only currency in an Extreme-Bearish position (below 20 percent).
Strength Statistics:
US Dollar Index (66.4 percent) vs US Dollar Index previous week (66.4 percent)
EuroFX (73.3 percent) vs EuroFX previous week (72.5 percent)
British Pound Sterling (44.8 percent) vs British Pound Sterling previous week (37.6 percent)
Japanese Yen (28.2 percent) vs Japanese Yen previous week (27.4 percent)
Swiss Franc (22.3 percent) vs Swiss Franc previous week (16.9 percent)
Canadian Dollar (15.5 percent) vs Canadian Dollar previous week (22.6 percent)
Australian Dollar (47.2 percent) vs Australian Dollar previous week (43.5 percent)
New Zealand Dollar (36.8 percent) vs New Zealand Dollar previous week (40.7 percent)
Mexican Peso (47.8 percent) vs Mexican Peso previous week (55.5 percent)
Brazilian Real (48.3 percent) vs Brazilian Real previous week (54.1 percent)
Bitcoin (78.1 percent) vs Bitcoin previous week (82.6 percent)
Japanese Yen tops Strength Trends
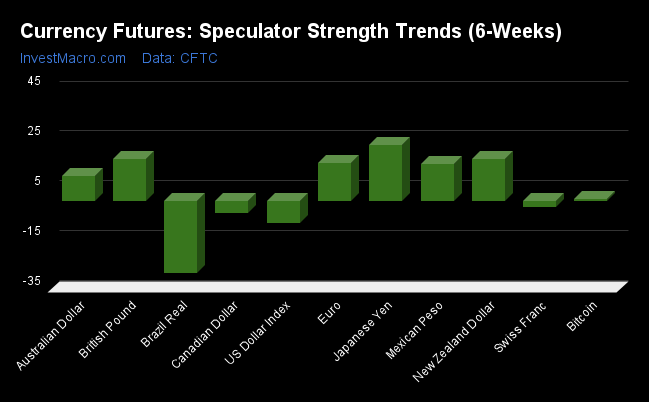
Strength Score Trends (or move index, calculates the 6-week changes in strength scores) show that the Japanese Yen (22.6 percent) leads the past six weeks trends for the currency markets this week. The New Zealand Dollar (17.1 percent), the British Pound Sterling (16.8 percent), the EuroFX (15.3 percent) and the Australian Dollar (10.1 percent) fill out the top movers in the latest trends data.
The Brazilian Real (-28.9 percent) leads the downside trend scores currently while the next markets with lower trend scores were the US Dollar Index (-8.7 percent), the Canadian Dollar (-4.7 percent) and the Swiss Franc (-2.5 percent).
Strength Trend Statistics:
US Dollar Index (-8.7 percent) vs US Dollar Index previous week (-13.0 percent)
EuroFX (15.3 percent) vs EuroFX previous week (22.7 percent)
British Pound Sterling (16.8 percent) vs British Pound Sterling previous week (12.6 percent)
Japanese Yen (22.6 percent) vs Japanese Yen previous week (16.6 percent)
Swiss Franc (-2.5 percent) vs Swiss Franc previous week (-18.9 percent)
Canadian Dollar (-4.7 percent) vs Canadian Dollar previous week (5.3 percent)
Australian Dollar (10.1 percent) vs Australian Dollar previous week (-8.6 percent)
New Zealand Dollar (17.1 percent) vs New Zealand Dollar previous week (35.8 percent)
Mexican Peso (15.1 percent) vs Mexican Peso previous week (37.7 percent)
Brazilian Real (-28.9 percent) vs Brazilian Real previous week (-20.2 percent)
Bitcoin (0.8 percent) vs Bitcoin previous week (5.3 percent)
Individual COT Forex Markets:
US Dollar Index Futures:
 The US Dollar Index large speculator standing this week equaled a net position of 24,886 contracts in the data reported through Tuesday. This was a weekly decrease of -6 contracts from the previous week which had a total of 24,892 net contracts.
This week’s current strength score (the trader positioning range over the past three years, measured from 0 to 100) shows the speculators are currently Bullish with a score of 66.4 percent. The commercials are Bearish with a score of 32.0 percent and the small traders (not shown in chart) are Bearish with a score of 45.6 percent.
| US DOLLAR INDEX Statistics | SPECULATORS | COMMERCIALS | SMALL TRADERS |
| – Percent of Open Interest Longs: | 80.1 | 4.1 | 12.4 |
| – Percent of Open Interest Shorts: | 25.0 | 65.1 | 6.6 |
| – Net Position: | 24,886 | -27,540 | 2,654 |
| – Gross Longs: | 36,157 | 1,838 | 5,610 |
| – Gross Shorts: | 11,271 | 29,378 | 2,956 |
| – Long to Short Ratio: | 3.2 to 1 | 0.1 to 1 | 1.9 to 1 |
| NET POSITION TREND: | | | |
| – Strength Index Score (3 Year Range Pct): | 66.4 | 32.0 | 45.6 |
| – Strength Index Reading (3 Year Range): | Bullish | Bearish | Bearish |
| NET POSITION MOVEMENT INDEX: | | | |
| – 6-Week Change in Strength Index: | -8.7 | 10.8 | -17.6 |
Euro Currency Futures:
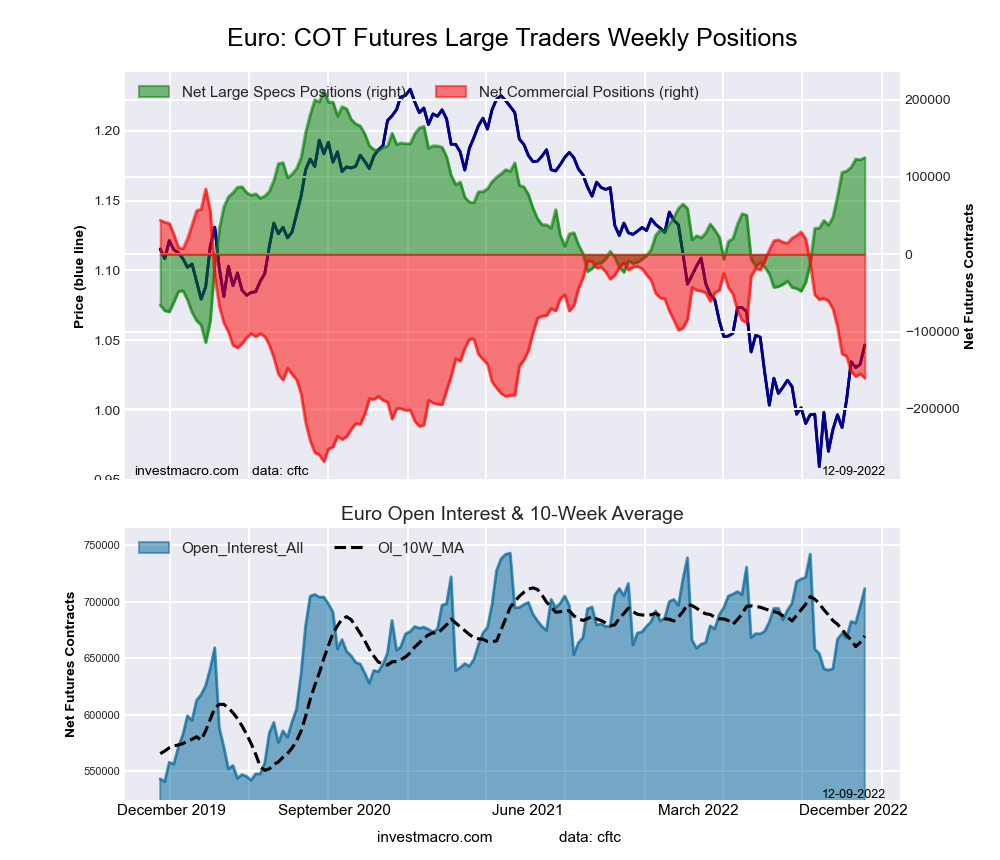 The Euro Currency large speculator standing this week equaled a net position of 124,883 contracts in the data reported through Tuesday. This was a weekly advance of 2,636 contracts from the previous week which had a total of 122,247 net contracts.
This week’s current strength score (the trader positioning range over the past three years, measured from 0 to 100) shows the speculators are currently Bullish with a score of 73.3 percent. The commercials are Bearish with a score of 30.6 percent and the small traders (not shown in chart) are Bearish with a score of 35.0 percent.
| EURO Currency Statistics | SPECULATORS | COMMERCIALS | SMALL TRADERS |
| – Percent of Open Interest Longs: | 34.4 | 51.0 | 12.0 |
| – Percent of Open Interest Shorts: | 16.9 | 73.5 | 7.0 |
| – Net Position: | 124,883 | -160,005 | 35,122 |
| – Gross Longs: | 245,063 | 363,169 | 85,050 |
| – Gross Shorts: | 120,180 | 523,174 | 49,928 |
| – Long to Short Ratio: | 2.0 to 1 | 0.7 to 1 | 1.7 to 1 |
| NET POSITION TREND: | | | |
| – Strength Index Score (3 Year Range Pct): | 73.3 | 30.6 | 35.0 |
| – Strength Index Reading (3 Year Range): | Bullish | Bearish | Bearish |
| NET POSITION MOVEMENT INDEX: | | | |
| – 6-Week Change in Strength Index: | 15.3 | -18.8 | 25.8 |
British Pound Sterling Futures:
 The British Pound Sterling large speculator standing this week equaled a net position of -28,193 contracts in the data reported through Tuesday. This was a weekly increase of 8,391 contracts from the previous week which had a total of -36,584 net contracts.
This week’s current strength score (the trader positioning range over the past three years, measured from 0 to 100) shows the speculators are currently Bearish with a score of 44.8 percent. The commercials are Bullish with a score of 59.7 percent and the small traders (not shown in chart) are Bearish with a score of 39.2 percent.
| BRITISH POUND Statistics | SPECULATORS | COMMERCIALS | SMALL TRADERS |
| – Percent of Open Interest Longs: | 12.4 | 73.3 | 10.0 |
| – Percent of Open Interest Shorts: | 24.6 | 56.9 | 14.1 |
| – Net Position: | -28,193 | 37,774 | -9,581 |
| – Gross Longs: | 28,539 | 168,838 | 22,941 |
| – Gross Shorts: | 56,732 | 131,064 | 32,522 |
| – Long to Short Ratio: | 0.5 to 1 | 1.3 to 1 | 0.7 to 1 |
| NET POSITION TREND: | | | |
| – Strength Index Score (3 Year Range Pct): | 44.8 | 59.7 | 39.2 |
| – Strength Index Reading (3 Year Range): | Bearish | Bullish | Bearish |
| NET POSITION MOVEMENT INDEX: | | | |
| – 6-Week Change in Strength Index: | 16.8 | -19.6 | 18.0 |
Japanese Yen Futures:
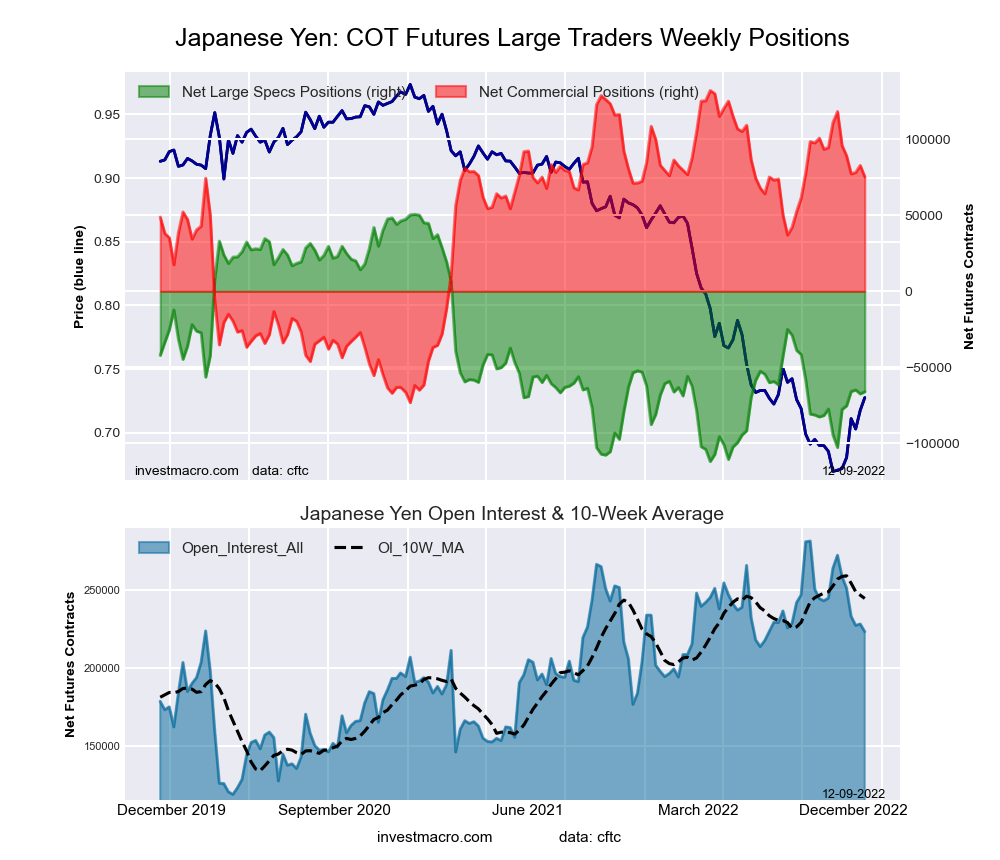 The Japanese Yen large speculator standing this week equaled a net position of -65,996 contracts in the data reported through Tuesday. This was a weekly boost of 1,398 contracts from the previous week which had a total of -67,394 net contracts.
This week’s current strength score (the trader positioning range over the past three years, measured from 0 to 100) shows the speculators are currently Bearish with a score of 28.2 percent. The commercials are Bullish with a score of 72.3 percent and the small traders (not shown in chart) are Bearish with a score of 34.7 percent.
| JAPANESE YEN Statistics | SPECULATORS | COMMERCIALS | SMALL TRADERS |
| – Percent of Open Interest Longs: | 10.6 | 76.1 | 11.1 |
| – Percent of Open Interest Shorts: | 40.1 | 42.4 | 15.3 |
| – Net Position: | -65,996 | 75,202 | -9,206 |
| – Gross Longs: | 23,589 | 169,918 | 24,896 |
| – Gross Shorts: | 89,585 | 94,716 | 34,102 |
| – Long to Short Ratio: | 0.3 to 1 | 1.8 to 1 | 0.7 to 1 |
| NET POSITION TREND: | | | |
| – Strength Index Score (3 Year Range Pct): | 28.2 | 72.3 | 34.7 |
| – Strength Index Reading (3 Year Range): | Bearish | Bullish | Bearish |
| NET POSITION MOVEMENT INDEX: | | | |
| – 6-Week Change in Strength Index: | 22.6 | -20.9 | 12.7 |
Swiss Franc Futures:
 The Swiss Franc large speculator standing this week equaled a net position of -12,230 contracts in the data reported through Tuesday. This was a weekly increase of 2,017 contracts from the previous week which had a total of -14,247 net contracts.
This week’s current strength score (the trader positioning range over the past three years, measured from 0 to 100) shows the speculators are currently Bearish with a score of 22.3 percent. The commercials are Bullish with a score of 74.4 percent and the small traders (not shown in chart) are Bearish with a score of 38.5 percent.
| SWISS FRANC Statistics | SPECULATORS | COMMERCIALS | SMALL TRADERS |
| – Percent of Open Interest Longs: | 3.3 | 70.9 | 25.3 |
| – Percent of Open Interest Shorts: | 33.8 | 26.5 | 39.4 |
| – Net Position: | -12,230 | 17,859 | -5,629 |
| – Gross Longs: | 1,343 | 28,500 | 10,183 |
| – Gross Shorts: | 13,573 | 10,641 | 15,812 |
| – Long to Short Ratio: | 0.1 to 1 | 2.7 to 1 | 0.6 to 1 |
| NET POSITION TREND: | | | |
| – Strength Index Score (3 Year Range Pct): | 22.3 | 74.4 | 38.5 |
| – Strength Index Reading (3 Year Range): | Bearish | Bullish | Bearish |
| NET POSITION MOVEMENT INDEX: | | | |
| – 6-Week Change in Strength Index: | -2.5 | -8.7 | 21.1 |
Canadian Dollar Futures:
 The Canadian Dollar large speculator standing this week equaled a net position of -22,090 contracts in the data reported through Tuesday. This was a weekly lowering of -5,974 contracts from the previous week which had a total of -16,116 net contracts.
This week’s current strength score (the trader positioning range over the past three years, measured from 0 to 100) shows the speculators are currently Bearish-Extreme with a score of 15.5 percent. The commercials are Bullish-Extreme with a score of 87.8 percent and the small traders (not shown in chart) are Bearish with a score of 28.5 percent.
| CANADIAN DOLLAR Statistics | SPECULATORS | COMMERCIALS | SMALL TRADERS |
| – Percent of Open Interest Longs: | 20.6 | 53.3 | 20.8 |
| – Percent of Open Interest Shorts: | 35.5 | 37.9 | 21.4 |
| – Net Position: | -22,090 | 22,905 | -815 |
| – Gross Longs: | 30,717 | 79,379 | 30,984 |
| – Gross Shorts: | 52,807 | 56,474 | 31,799 |
| – Long to Short Ratio: | 0.6 to 1 | 1.4 to 1 | 1.0 to 1 |
| NET POSITION TREND: | | | |
| – Strength Index Score (3 Year Range Pct): | 15.5 | 87.8 | 28.5 |
| – Strength Index Reading (3 Year Range): | Bearish-Extreme | Bullish-Extreme | Bearish |
| NET POSITION MOVEMENT INDEX: | | | |
| – 6-Week Change in Strength Index: | -4.7 | 4.0 | -1.8 |
Australian Dollar Futures:
 The Australian Dollar large speculator standing this week equaled a net position of -40,563 contracts in the data reported through Tuesday. This was a weekly boost of 4,067 contracts from the previous week which had a total of -44,630 net contracts.
This week’s current strength score (the trader positioning range over the past three years, measured from 0 to 100) shows the speculators are currently Bearish with a score of 47.2 percent. The commercials are Bullish with a score of 50.8 percent and the small traders (not shown in chart) are Bearish with a score of 46.9 percent.
| AUSTRALIAN DOLLAR Statistics | SPECULATORS | COMMERCIALS | SMALL TRADERS |
| – Percent of Open Interest Longs: | 22.9 | 63.7 | 10.6 |
| – Percent of Open Interest Shorts: | 48.4 | 36.7 | 12.0 |
| – Net Position: | -40,563 | 42,820 | -2,257 |
| – Gross Longs: | 36,334 | 101,160 | 16,814 |
| – Gross Shorts: | 76,897 | 58,340 | 19,071 |
| – Long to Short Ratio: | 0.5 to 1 | 1.7 to 1 | 0.9 to 1 |
| NET POSITION TREND: | | | |
| – Strength Index Score (3 Year Range Pct): | 47.2 | 50.8 | 46.9 |
| – Strength Index Reading (3 Year Range): | Bearish | Bullish | Bearish |
| NET POSITION MOVEMENT INDEX: | | | |
| – 6-Week Change in Strength Index: | 10.1 | -17.5 | 30.8 |
New Zealand Dollar Futures:
 The New Zealand Dollar large speculator standing this week equaled a net position of -6,498 contracts in the data reported through Tuesday. This was a weekly decline of -1,444 contracts from the previous week which had a total of -5,054 net contracts.
This week’s current strength score (the trader positioning range over the past three years, measured from 0 to 100) shows the speculators are currently Bearish with a score of 36.8 percent. The commercials are Bullish with a score of 61.3 percent and the small traders (not shown in chart) are Bullish with a score of 53.9 percent.
| NEW ZEALAND DOLLAR Statistics | SPECULATORS | COMMERCIALS | SMALL TRADERS |
| – Percent of Open Interest Longs: | 38.0 | 53.4 | 7.9 |
| – Percent of Open Interest Shorts: | 53.1 | 38.8 | 7.4 |
| – Net Position: | -6,498 | 6,301 | 197 |
| – Gross Longs: | 16,302 | 22,950 | 3,397 |
| – Gross Shorts: | 22,800 | 16,649 | 3,200 |
| – Long to Short Ratio: | 0.7 to 1 | 1.4 to 1 | 1.1 to 1 |
| NET POSITION TREND: | | | |
| – Strength Index Score (3 Year Range Pct): | 36.8 | 61.3 | 53.9 |
| – Strength Index Reading (3 Year Range): | Bearish | Bullish | Bullish |
| NET POSITION MOVEMENT INDEX: | | | |
| – 6-Week Change in Strength Index: | 17.1 | -23.5 | 41.4 |
Mexican Peso Futures:
 The Mexican Peso large speculator standing this week equaled a net position of 47,952 contracts in the data reported through Tuesday. This was a weekly fall of -18,134 contracts from the previous week which had a total of 66,086 net contracts.
This week’s current strength score (the trader positioning range over the past three years, measured from 0 to 100) shows the speculators are currently Bearish with a score of 47.8 percent. The commercials are Bullish with a score of 50.5 percent and the small traders (not shown in chart) are Bullish with a score of 65.9 percent.
| MEXICAN PESO Statistics | SPECULATORS | COMMERCIALS | SMALL TRADERS |
| – Percent of Open Interest Longs: | 60.5 | 35.9 | 2.7 |
| – Percent of Open Interest Shorts: | 44.1 | 54.1 | 0.8 |
| – Net Position: | 47,952 | -53,360 | 5,408 |
| – Gross Longs: | 177,555 | 105,410 | 7,854 |
| – Gross Shorts: | 129,603 | 158,770 | 2,446 |
| – Long to Short Ratio: | 1.4 to 1 | 0.7 to 1 | 3.2 to 1 |
| NET POSITION TREND: | | | |
| – Strength Index Score (3 Year Range Pct): | 47.8 | 50.5 | 65.9 |
| – Strength Index Reading (3 Year Range): | Bearish | Bullish | Bullish |
| NET POSITION MOVEMENT INDEX: | | | |
| – 6-Week Change in Strength Index: | 15.1 | -14.0 | -7.7 |
Brazilian Real Futures:
 The Brazilian Real large speculator standing this week equaled a net position of 2,198 contracts in the data reported through Tuesday. This was a weekly decrease of -5,439 contracts from the previous week which had a total of 7,637 net contracts.
This week’s current strength score (the trader positioning range over the past three years, measured from 0 to 100) shows the speculators are currently Bearish with a score of 48.3 percent. The commercials are Bullish with a score of 50.6 percent and the small traders (not shown in chart) are Bullish-Extreme with a score of 85.9 percent.
| BRAZIL REAL Statistics | SPECULATORS | COMMERCIALS | SMALL TRADERS |
| – Percent of Open Interest Longs: | 57.4 | 28.6 | 14.0 |
| – Percent of Open Interest Shorts: | 48.8 | 45.5 | 5.7 |
| – Net Position: | 2,198 | -4,324 | 2,126 |
| – Gross Longs: | 14,625 | 7,271 | 3,566 |
| – Gross Shorts: | 12,427 | 11,595 | 1,440 |
| – Long to Short Ratio: | 1.2 to 1 | 0.6 to 1 | 2.5 to 1 |
| NET POSITION TREND: | | | |
| – Strength Index Score (3 Year Range Pct): | 48.3 | 50.6 | 85.9 |
| – Strength Index Reading (3 Year Range): | Bearish | Bullish | Bullish-Extreme |
| NET POSITION MOVEMENT INDEX: | | | |
| – 6-Week Change in Strength Index: | -28.9 | 28.6 | -3.2 |
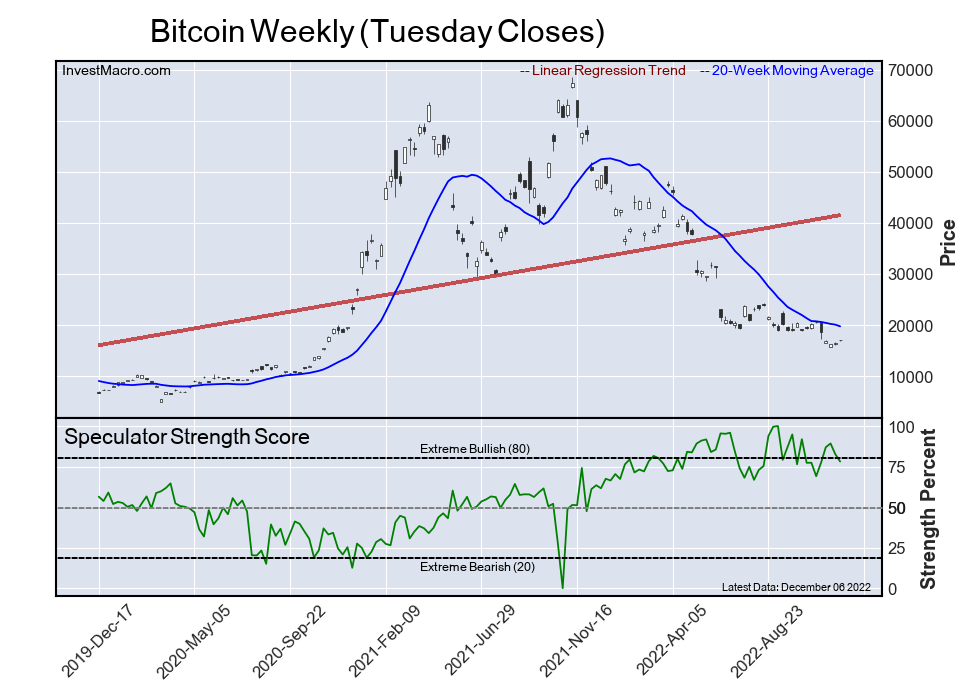
Bitcoin Futures:
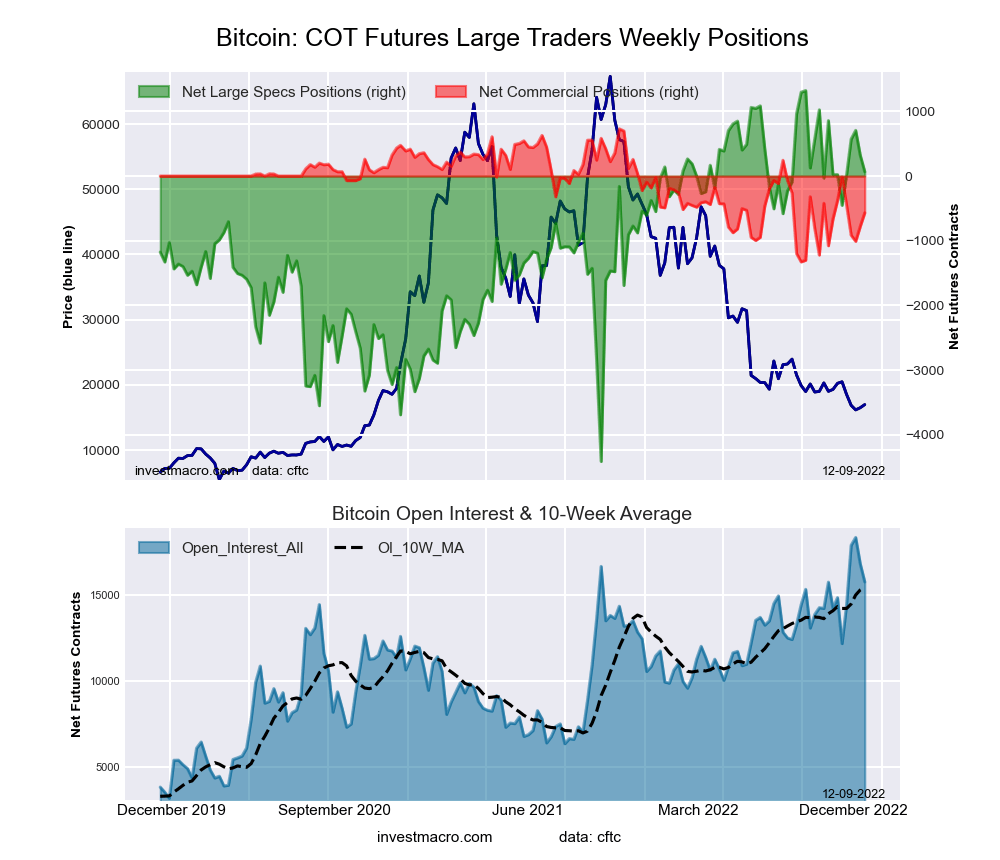 The Bitcoin large speculator standing this week equaled a net position of 67 contracts in the data reported through Tuesday. This was a weekly fall of -257 contracts from the previous week which had a total of 324 net contracts.
This week’s current strength score (the trader positioning range over the past three years, measured from 0 to 100) shows the speculators are currently Bullish with a score of 78.1 percent. The commercials are Bearish with a score of 36.9 percent and the small traders (not shown in chart) are Bearish with a score of 24.3 percent.
| BITCOIN Statistics | SPECULATORS | COMMERCIALS | SMALL TRADERS |
| – Percent of Open Interest Longs: | 80.2 | 1.9 | 8.7 |
| – Percent of Open Interest Shorts: | 79.8 | 5.5 | 5.5 |
| – Net Position: | 67 | -568 | 501 |
| – Gross Longs: | 12,651 | 306 | 1,365 |
| – Gross Shorts: | 12,584 | 874 | 864 |
| – Long to Short Ratio: | 1.0 to 1 | 0.4 to 1 | 1.6 to 1 |
| NET POSITION TREND: | | | |
| – Strength Index Score (3 Year Range Pct): | 78.1 | 36.9 | 24.3 |
| – Strength Index Reading (3 Year Range): | Bullish | Bearish | Bearish |
| NET POSITION MOVEMENT INDEX: | | | |
| – 6-Week Change in Strength Index: | 0.8 | -9.1 | 3.3 |
Article By InvestMacro – Receive our weekly COT Newsletter
*COT Report: The COT data, released weekly to the public each Friday, is updated through the most recent Tuesday (data is 3 days old) and shows a quick view of how large speculators or non-commercials (for-profit traders) were positioned in the futures markets.
The CFTC categorizes trader positions according to commercial hedgers (traders who use futures contracts for hedging as part of the business), non-commercials (large traders who speculate to realize trading profits) and nonreportable traders (usually small traders/speculators) as well as their open interest (contracts open in the market at time of reporting). See CFTC criteria here.


