Don’t be fooled by just seven stocks propelling the S&P bear rally and the Crypto bear rally top is in. Quite often, there are summer rallies in gold so check out Centerra Gold, New Found Gold, and Zonte Metals.
Source: Ron Struthers (6/7/23)
I have been reluctant to make new picks in this flat-to-down market, but there is some opportunity. What we are seeing in markets is unprecedented. This has a lot to do with the Covid-19 policy hangover, the green energy scam with the attack on oil and gas along with government manipulation and corruption at unprecedented levels.
These topics do cause controversy, but they are real. Just two recent examples of the green energy scam is Biden’s use of the SPR to influence energy prices ahead of the election and Trudeau’s relentless attack on oil and gas with carbon taxes. I touched on this yesterday, but the carbon tax will increase to US$170/tonne by 2030 from today’s US$30.
What is slimy about this, it is an automatic increase each year, and the Trudeau government is doing this with other tax increases. This way, the tax increase does not have to be debated in the annual government budget. This tax will add over 35 cents/liter to gasoline, and if you think that does not affect consumers, economies, and markets, think again.
And a recent survey says 73% of Canadians say David Johnston is unfit to be Special Rapporteu. Western government’s push to totalitarianism is affected markets and investments like never before; we just can’t ignore it. I usually use a chart of the S&P 500 with my support and resistance levels, but I will use this version today. There is much talk about this bear rally almost reaching new bull market status with a +20% gain.
Don’t get sucked in by this. This bear rally is simply seven stocks, as shown below. We are in a flat market at best, and I have zero confidence in this rally.
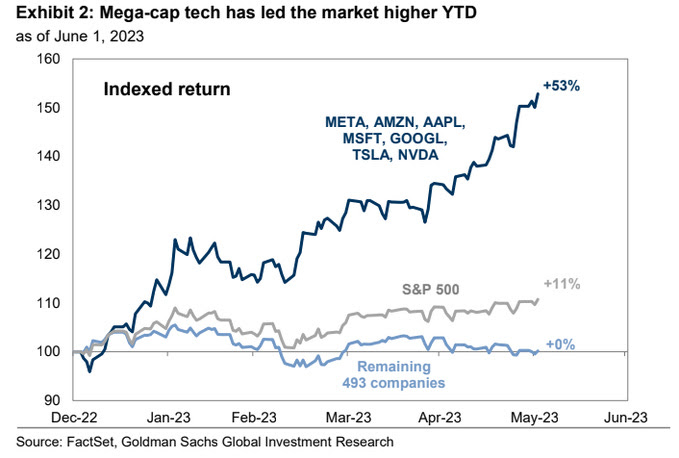
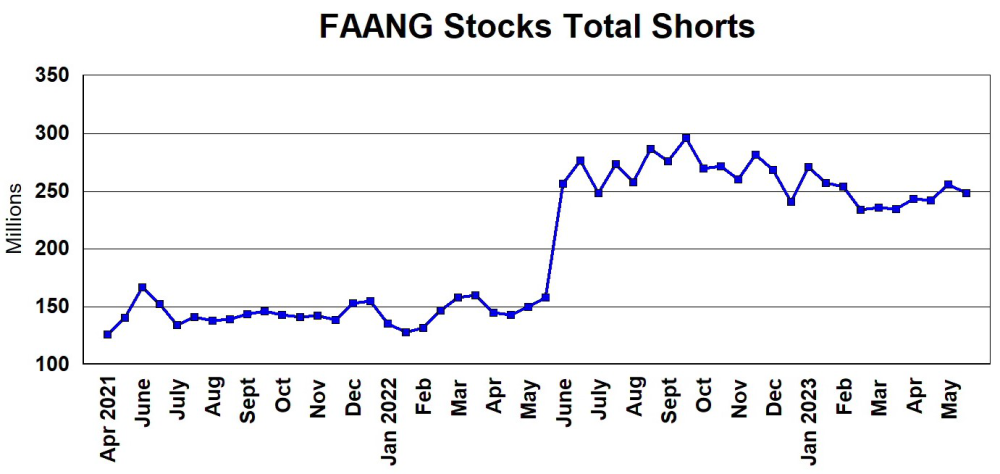
I am not saying this is market manipulation, but it is way easier to manipulate seven stocks to create a bear rally mirage than the whole market. I updated my FAANG stocks short barometer, and the pros are not buying this rally as their short positions remain about the same.
However, the $ value of the shorts has increased by about US$8 billion in the last two months because of their price increase shown in the above chart.
The Russel 2000 fell about 33% and has only rallied about 12%. However, in Canada, what has been pure torture and unprecedented in history is the destruction of the juniors and small-cap sector.
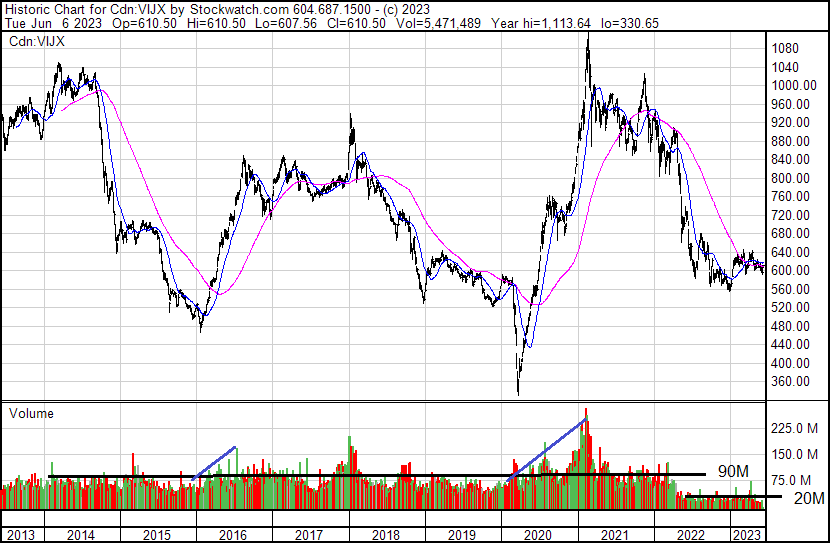
The barometer of the small-cap sector is the TSX Venture index, and on average, it has traded about 90 million shares per day with spikes higher during good rallies.
Since April 2022, the volume has been very sick and unprecedented in history, with a mere 20 million shares per day. Take out the computer trading, and there is virtually zero interest in Canada’s small-cap sector.
With the current government, investment money has fled the country in droves like never before. Foreign investors ditched US$19.1 billion in March 2023 alone for a net investment outflow of US$13.5 billion (last Statcan data available). These numbers don’t include US$100s of billions that fled with U.S. firms selling Canadian assets, especially in the oil patch.
Canadians are voting with their feet as they invested record amounts outside Canada, $US59.661 billion in Q1 2023. This is the second highest on record, with US$67,096 in Q4 2021 a record. If you don’t believe the current government policy is not destroying this country, you are fooling yourself.
In general, these numbers have been on the rise since 2016, soon after the liberals came to power. A longer-term view from Q1 2021 Canadian direct investment abroad is US$271,788 billion compared to foreign direct investment in Canada of US$146,811.
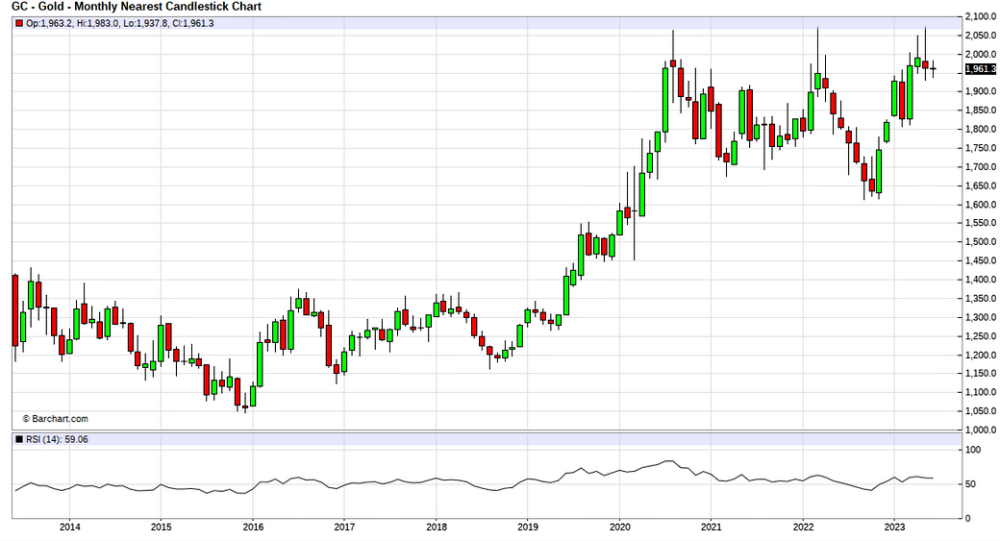
These numbers include mergers and acquisitions. Canada had record foreign investment pre-2008 and another strong period from 2012 to early 2015. These occurred with rising oil prices except in the 2022 oil price rise as negative government oil and gas policy negated that. For things being so negative, in the past ten years, we have seen gold and gold stocks bottom in summer and have summer rallies in six years.
In 2016 and 2017, there were summer rallies, and very strong ones in 2019 and 2020. There was a bottom in the summer of 2018 and the end of summer 2022. In 2023, gold prices peaked in early May, and the jury is still out. We either have a summer rally from the late May lows, or gold goes lower still and bottoms in the summer. Either way, it is not a long wait.
All things considered, I expect these boring sideways markets to continue through the summer with perhaps some upward bias. The bulls can keep markets afloat easier in thin summer trading. I expect a significant market correction in late Q3 and Q4; remember that September and October are the scary months for general equity markets.
Gold can sometimes buck these corrections but sometimes sells off in sympathy at the start of these corrections. The real big mover will be when the Fed pivots. Inflation and the economy have been resilient, but I expect these both will soften in the second half of 2023 and the first half of 2024 sometime.
Two Morgan Stanley analysts, Mike Wilson and Andrew Sheets, are bucking the bulls and consensus of 1.8% earnings growth in 2023, calling for a 16% drop. Their year-end price target for the S&P 500 is 3,900 — approximately 9% below the current level. I think we could see 3,800 and possibly lower.
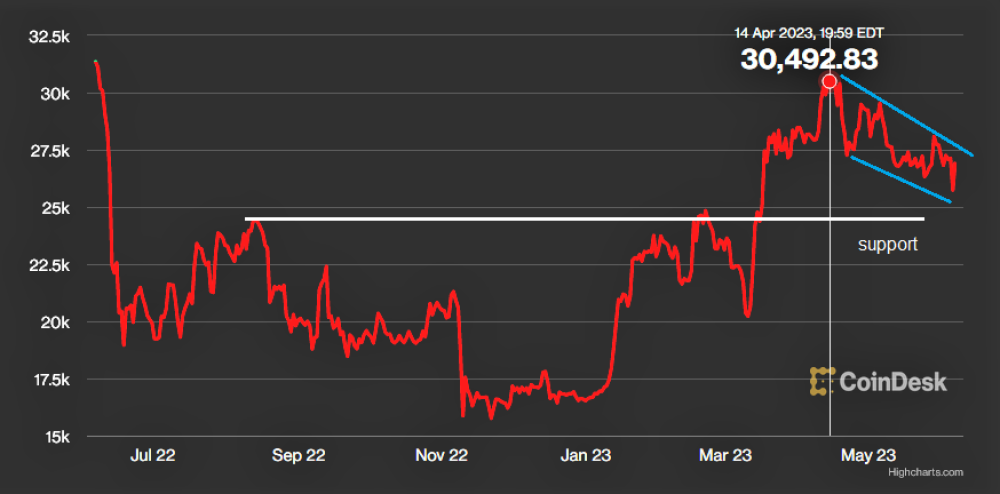
It is looking more so that my call on April 8 to sell crypto again was within days of the top, and my prediction of a US$30k peak was very close, with bitcoin hitting 30,492 on April 14.
Back then, I said a major risk factor was a regulatory crackdown.
“It is not very healthy to have so much trading volume in one place, especially now that Binance is in the gun sights of the regulators. If regulators shut this down and/or prove corruption, it would be disastrous for the crypto market. Is this a risk you should just wait out?”
Bitcoin hit new lows since the April peak, with others on news Monday that the SEC has sued cryptocurrency exchange Binance and its CEO Changpeng Zhao for allegedly violating U.S. securities regulations. The news pushed cryptocurrency prices lower, with Bitcoin (BTC-USD) down 3.8% at US$25.78K and ether (ETHUSD) 2.7% lower at US$1.82K.
Thirteen charges were filed against Binance and CZ, as he is known, including deceiving investors about the sufficiency of its systems to detect and control manipulative trading. The SEC also accused the platform of taking insufficient steps to prohibit U.S. investors from accessing its unregulated exchange.
The Securities Exchange Commission is filing a lawsuit against Coinbase Global Inc. (COIN:NASDAQ) just a day after suing Binance. While the allegations are different — Coinbase centers around the registration of securities and market functions, while Binance includes fraud and efforts to evade — the two are similar in other ways.
“The investing public has the benefit of U.S. securities laws, crypto should be no different, and these platforms and intermediaries need to come into compliance,” SEC Chair Gary Gensler declared. “Frankly, the public should really be more careful . . . We don’t need more digital currency. We already have digital currency. It’s called the U.S. dollar. It’s called the euro, or it’s called the yen; they’re all digital right now.”
Crypto is in the firing sights of the government and regulators. I maintain my US$10,000 target for Bitcoin. The coin is in a new downtrend with next support of about US$24k. A significant break below this would be a bad sign.
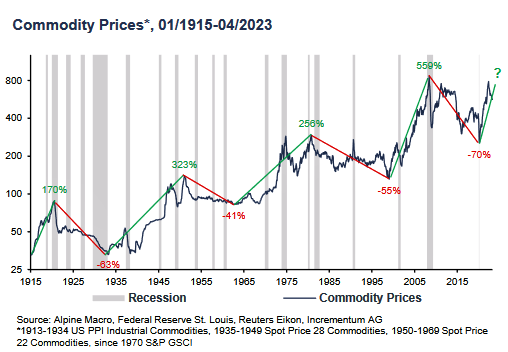
The other thing of interest is the commodity cycle. All major commodity bull markets are driven by investment buying, not the supply/demand fundamentals.
A Fed pivot will likely mean a weaker US$ and hence stronger commodity prices. There is no sign the current commodity bull cycle has ended.
My plan is to take some profits and sell some stocks as the opportunity presents itself in the next two or threee months, with the idea of scooping up some good deals in Q4. I have some very good quality companies on my watch list, more senior-type stocks. The juniors will have their day again, but the big guys have to move first.
Centerra Gold TSX:CG NY:CCAU
Recent Price – CA$8.22
Buy around – US$8.00
With that in mind, check out Centerra Gold Inc. (CG:TSX; CADGF:OTCPK).
We got stopped out of Centarra Gold in 2021 at US$11.00 and can now buy back around US$8.00. The stock was on a very good rally, hitting US$10.00 in April. However, it got hammered after May 15 when Q1 2023 financial statements were released.
Net loss for the quarter of US$73.5 million, or 34 cents per common share, including (net of tax) a non-cash reclamation expense at the care and maintenance sites of US$15.6 million, or seven cents per common share. Also, exploration and evaluation costs at the Goldfield project of US$11.7 million, or six cents per common share. And standby cash costs at the Oksut mine of US$7.8 million, or four cents per common share. Mining costs at the Oksut mine were expensed in the period due to the focus on waste-stripping activities with limited mining, crushing, and stacking of ore. Adjusted net loss for the quarter was US$52.9 million, or 24 cents per common share.
The market seemed surprised, but their Oksut mine activity had been sidelined since August 2022 as they had to upgrade the plant and renew permits. They were processing limiting amounts of stockpiled ore. Eventually, this had to hit the financial numbers, and it did. However, this is now resolved as on May 31, they announced the Turkish Ministry of Environment, Urbanization, and Climate Change had approved Centerra Gold Inc.’s amended environmental impact assessment (EIA) for the Oksut mine in Turkey.
With the EIA approval in hand, along with the receipt of regulatory approvals for the mercury abatement retrofit to the adsorption, desorption, and recovery plant (ADR plant), the company expects to restart full operations at Oksut in the coming weeks.
CEO Tomory commented in the May 15 financial release: “In the first quarter of 2023, the company continued to demonstrate that safety remains Centerra’s top priority, with a number of our sites achieving milestones without a lost time or reportable injury. In Turkey, I’m pleased to announce that we have completed the mercury abatement retrofit to the Oksut mine’s ADR plant and that the system has been tested under the supervision of the Turkish ministry. The regulatory review of Oksut mine’s amended EIA remains on track; all review steps have been completed, and it has been submitted for final ministry approval. Subject to receipt of the final approvals of the EIA and ADR plant, the company will be well-positioned to begin processing the approximately 100,000 recoverable ounces of gold-in-carbon inventory on hand. We will then be able to shift our focus to the additional approximately 200,000 recoverable ounces of gold in the Oksut mine’s gold-in-ore stockpiles and on the heap leach pad.”
Oksut is a major asset for the company and just had its first full year of commercial production in 2021 before the ADR plant issue in 2022. In 2021 Oksut produced 111,703 ounces gold and was projected to double that in 2022, so the ADR plant setback was very significant to the company. The 2Q results will still be impacted by the Oksut mine.
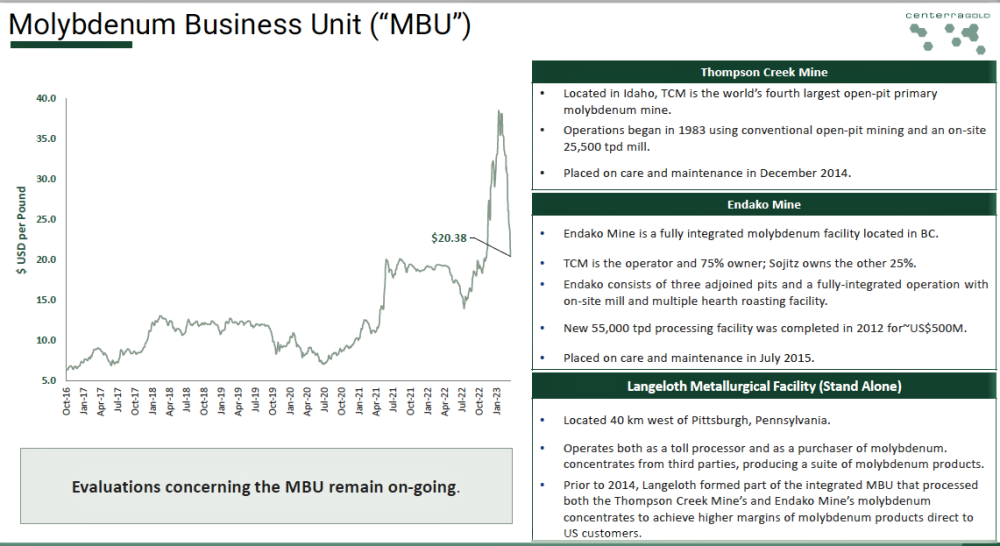
Given the shutdown for most of the quarter, Centerra will be able to liberate cash from inventory over time and generate more cash from Oksut going forward, as noted by the CEO above with a large stockpile of ore to process. Centerra offers investors exposure to gold and copper while generating solid cash flow. Centerra also has a strong balance sheet and huge future potential with three molybdenum assets, which offer leverage on molybdenum prices and may be sold for significant value.
On the chart, there is support around US$8.00, and the stock had a gap below this and a gap above it on the surprise news flow. Or what was taken as a surprise. The first resistance is just above US$9, and once that is broken, I expect the up trend can continue to around US$13, the 2022 highs before the Oksut mine issue.
Silver Bull Resources Inc. (SVB:TSX; SVBL:NYSE.MKT) is a junior we sold in 2022, and it dropped lower, but I am still following the company. They were negatively impacted by an illegal blockade at the Sierra Mojada project in Mexico, but we also got a spin-out company called Arras Minerals Corp. (ARRKF:OTCMKTS), and it trades for around US$0.30.
Today SVB announced significant steps in its pursuit of compensation regarding the Sierra Mojada Project. On March 2, 2023, the company served a Notice of Intent with Mexico to initiate a legacy NAFTA claim, seeking damages resulting from the unlawful blockade of its project. In conformity with NAFTA’s dispute resolution provisions, Mexico extended an invitation for company representatives to a meeting held in Mexico City on May 30, 2023.
The purpose of the meeting was to explore the possibility of reaching an amicable settlement and avoid arbitration. Under NAFTA, the parties had 90 days to mutually resolve the matter, which expired on June 2, 2023. The next phase of the process entails the Company filing a Request for Arbitration in mid-June, formally commencing the arbitration proceedings.
The claim filed by Silver Bull will be for not less than US$178 million dollars. This has now become a legal play, and these court issues take time, but if the stock drops this fall, I might suggest buying again. These NAFTA suits don’t seem to take as long as other lawsuits. I believe this would fall under Chapter 11 of investment disputes.
To the start of 2003, 23 cases had been initiated under Chapter 11. Nine were filed against Canada, nine against Mexico, and five against the United States. Of the eight cases settled, the initiating “claimant” investor has won four and the government defendant or “respondent” four as well. At 20 cents, Silver Bull has a market cap of just CA$7 million. If they end up settling for just one-third of US$178 million, that is about CA$80 million or ten times the current market value. Given these things take time, I am watching for a drop in the stock to buy and just sit on it.
Two other juniors with significant news this week:
Zonte Metals TSXV:ZON OTC:EREPF
Recent Price – US$0.08
Entry Price – US$0.12
Opinion – Buy
I believe Zonte Metals Inc.’s (ZON:TSX.V) Cross Hills project is one of the most misunderstood exploration plays out there. If this was better understood, I think the stock could be between US$0.50 and US$1.00. I am planning another video interview with Terry to explain IOCGs and these targets. IOCGs are different, and Cross Hills is likely a whole new copper belt, not just one deposit. Remember that NFLD was the world’s number three copper producer back in the war era and previously. Tilt Cove was at times one of the world’s largest producers of copper. The recent mining rush in NFLD has been gold, so copper is not at the forefront with investors.
Tuesday, Zonte announced it had discovered two large gravity anomalies at the K10 target on its Cross Hills copper project in Newfoundland, each anomaly spatially coincident with copper mineralization. My bolding in Terry’s comments. When I spoke to him about this news, he indicated that he thinks K10 is the best target found on the property so far.
Terry Christopher, president and chief executive officer, commented: “The K10 area comprises the previously discovered K10S and K10N targets. These targets are defined by copper in bedrock and coincident Cu-in-soil anomalies sitting in significant alteration zones. The recent gravity survey was completed over the large K10 area and has resulted in the discovery of two large residual gravity anomalies, one at each of the K10S and K10N targets. These gravity anomalies measure 1,300 by 400 meters and 1,800 by 500 meters for K10N and K10S, respectively. The K10N anomaly is potentially open along strike at both ends, while the K10S residual gravity signature is the strongest discovered on the project to date. These targets will be further advanced to drill stage with the completion of detailed geochemical surveys and a magnetic survey. With these targets, Zonte now has six targets that are near or at the drill stage.”
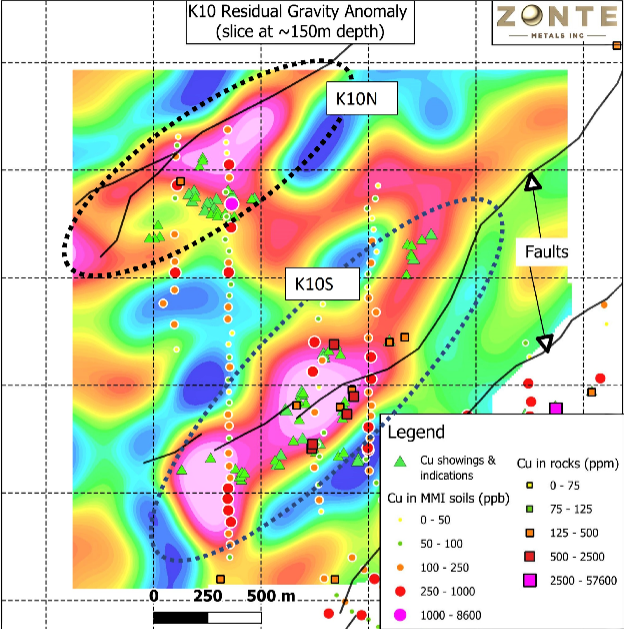
Zonte has six targets drill ready or close to it. The K10 anomalies are located within a larger four-kilometer-bysix-kilometer area that hosts numerous targets, including the K6, K6S, K7, K8, and K9 targets.
Results dependent, both K6 and K6S will be drilled in the same coming drill program. The K6 drill permit is in hand. Sampling over the new K6S target is completed, and the company is awaiting results.
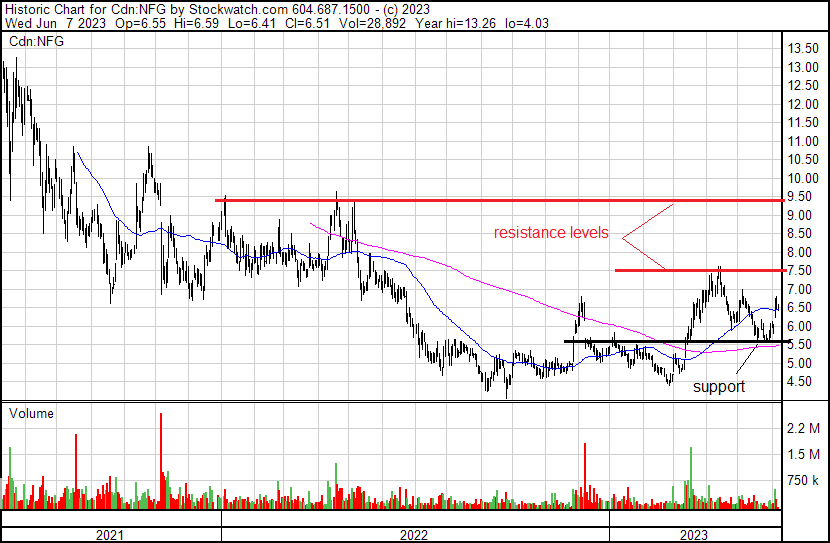
New Found Gold TSXV:NFG
Recent Price – US$6.50
Entry Price – US$8.40
Opinion – Buy, Strong Buy below US$6.50
It is amazing and reflects how bad this market is with New Found Gold Corp. (NFG:TSX.V; NFGC:NYSE.American) at these prices and reporting drill holes that can only be described as spectacular. It reminds me of Kirkland’s Fosterville discovery, which is the lowest-cost gold mine in the world because the grade is very high at 23.19 g/t.
Monday, NFG released the results from one diamond drill hole at 105 g/t over 27.1 meters. It was completed as part of a follow-up drill program at the new Iceberg discovery, a high-grade zone located 300 meters northeast of Keats Main along the highly prospective Appleton fault zone (AFZ). NFGC-23-1210 intersected 105 grams per tonne gold over 27.05 meters at Iceberg, just 35 m from surface. High-grade mineralization is well distributed throughout the composite, with nine individual sample intervals registering over 100 g/t Au.
- The hole is located 32 m along strike of previously reported 49.7 g/t Au over 29.85 m in NFGC-23- 1120 (March 13, 2023) and 30 m down dip of previously reported 15.3 g/t Au over 10.75 m in NFGC22-1084 (March 1, 2023).
- Iceberg is currently drill-defined over a strike length of 550 m and represents the fault-displaced eastern extent of the Keats-Baseline fault zone (KBFZ), the same fault that hosts Keats Main.
Melissa Render, vice president of exploration of New Found, stated: “Discovering high-grade gold mineralization of this magnitude over such a thick interval is rare in nature, and yet, Queensway has produced several of these high-caliber hits across a multitude of zones. NFGC-23-1210 runs 27 m in length with several distinct areas of strong quartz veining laden with visible gold. Logging of the hole identified 1,153 counts of visible gold, which ranks as one of the highest seen at Queensway to date. “The Keats-Baseline fault has proven its potential time and time again and is now defined over a strike length of 1.8 km. With the majority of drilling at Queensway focused in the top 250 m and with the seismic program well underway, we look forward to exploration drilling later in 2023 when we can use the drill bit to target the deeper plumbing along the Appleton fault zone, with an eye towards finding feeder zones and repetitions in mineralization.”
I don’t know how long we can buy NFG at these cheap prices. The stock did pop about US$0.70 on the news, so there might be a pull back, and why I have a Strong Buy below US$6.50.
Important Disclosures:
- Ron Struthers: I, or members of my immediate household or family, own securities of: Centerra Gold, Zonte Metals, New Found Gold. I determined which companies would be included in this article based on my research and understanding of the sector.
- Statements and opinions expressed are the opinions of the author and not of Streetwise Reports or its officers. The author is wholly responsible for the validity of the statements. The author was not paid by Streetwise Reports for this article. Streetwise Reports was not paid by the author to publish or syndicate this article. Streetwise Reports requires contributing authors to disclose any shareholdings in, or economic relationships with, companies that they write about. Streetwise Reports relies upon the authors to accurately provide this information and Streetwise Reports has no means of verifying its accuracy.
- This article does not constitute investment advice. Each reader is encouraged to consult with his or her individual financial professional. By opening this page, each reader accepts and agrees to Streetwise Reports’ terms of use and full legal disclaimer. This article is not a solicitation for investment. Streetwise Reports does not render general or specific investment advice and the information on Streetwise Reports should not be considered a recommendation to buy or sell any security. Streetwise Reports does not endorse or recommend the business, products, services or securities of any company.
For additional disclosures, please click here.
Struthers Resource Stock Report Disclosures
All forecasts and recommendations are based on opinion. Markets change direction with consensus beliefs, which may change at any time and without notice. The author/publisher of this publication has taken every precaution to provide the most accurate information possible. The information & data were obtained from sources believed to be reliable, but because the information & data source are beyond the author’s control, no representation or guarantee is made that it is complete or accurate. The reader accepts information on the condition that errors or omissions shall not be made the basis for any claim, demand or cause for action. Because of the ever-changing nature of information & statistics the author/publisher strongly encourages the reader to communicate directly with the company and/or with their personal investment adviser to obtain up to date information. Past results are not necessarily indicative of future results. Any statements non-factual in nature constitute only current opinions, which are subject to change. The author/publisher may or may not have a position in the securities and/or options relating thereto, & may make purchases and/or sales of these securities relating thereto from time to time in the open market or otherwise. Neither the information, nor opinions expressed, shall be construed as a solicitation to buy or sell any stock, futures or options contract mentioned herein. The author/publisher of this letter is not a qualified financial adviser & is not acting as such in this publication