At the close of the stock market yesterday, the Dow Jones Index (US30) increased by 1.26%, and the S&P 500 Index (US500) jumped by 1.22%. The NASDAQ Technology Index (US100) closed positive by 1.15% on Thursday.
The US Treasury bond yields fell after data showed that US jobless claims jumped to their highest level in nearly two years. Despite signs of a downturn in the labor market, the latest retail sales data, which were unexpectedly positive, suggests that the average consumer remains in good shape.
Equity markets in Europe traded without a single trend yesterday. Germany’s DAX (DE30) decreased by 0.13%, France’s CAC 40 (FR40) lost 0.51%, Spain’s IBEX 35 (ES35) jumped by 0.10%, Britain’s FTSE 100 (UK100) closed up by 0.34% yesterday.
The European Central Bank (ECB) raised interest rates to a 22-year high, as expected. The ECB interest rate rose from 3.75% to 4.00%. The central bank expects inflation to remain above the 2% target through 2025 and once again hinted at further rate hikes in the coming months. In the latest macroeconomic forecasts, ECB staff now expects overall inflation to be 5.4% this year, 3% in 2024, and 2.2% in 2025. Core inflation is expected to be 5.1%, 3%, and 2.3%, respectively. During the press conference, President Christine Lagarde departed slightly from the ECB’s recent strategy, focusing on forward projections and applying a meeting-by-meeting approach.
Oil was up by 3% yesterday due to strong data from China as well as dollar weakness. Chinese refinery productivity was up by 15.4% in May from a year ago, reaching the second-highest level on record. Oil demand in China is expected to continue growing at a guaranteed rate in the second half of the year. Analysts expect the voluntary oil production cuts implemented in May by OPEC countries as well as Saudi Arabia to support oil prices at a time of strong demand.
A Turkish energy delegation will meet with representatives of Iraqi oil companies in Baghdad on June 19 to discuss resuming Iraq’s northern oil exports. Turkey suspended 450,000 barrels of Iraq’s northern exports through the Iraq-Turkey pipeline on March 25 following an International Chamber of Commerce (ICC) arbitration ruling.
Asian markets traded higher yesterday. Japan’s Nikkei 225 (JP225) decreased by 0.05% for the day, China’s FTSE China A50 (CHA50) was up by 1.82%, Hong Kong’s Hang Seng (HK50) ended the day up by 2.17%, and Australia’s S&P/ASX 200 (AU200) closed positive by 0.19%.
The Bank of Japan maintained an ultra-soft monetary policy on Friday, despite stronger-than-expected inflation, as it focused on supporting a fragile economic recovery amid a sharp slowdown in global growth. As price growth shows signs of expanding, markets are focused on whether Bank of Japan Governor Kazuo Ueda will issue a stronger warning about the risk of overshooting inflation at his press conference.
S&P 500 (F) (US500) 4,425.84 +53.25 (+1.22%)
Dow Jones (US30)34,408.06 +428.73 (+1.26%)
DAX (DE40) 16,290.12 −20.67 (−0.13%)
FTSE 100 (UK100) 7,628.26 +25.52 (+0.34%)
USD Index 102.16 −0.79 (−0.77%)
Important events for today:
– Japan BoJ Interest Rate Decision at 06:00 (GMT+3);
– Japan BoJ Monetary Policy Statement at 06:00 (GMT+3);
– UK Retail Sales (m/m) at 09:00 (GMT+3);
– Japan BoJ Press Conference at 09:30 (GMT+3);
– Eurozone Consumer Price Index (m/m) at 12:00 (GMT+3);
– US FOMC Waller Speaks at 14:45 (GMT+3);
– US Michigan Consumer Sentiment (m/m) at 17:00 (GMT+3).
This article reflects a personal opinion and should not be interpreted as an investment advice, and/or offer, and/or a persistent request for carrying out financial transactions, and/or a guarantee, and/or a forecast of future events.
Global financial markets could see increased volatility over the coming week due to Federal Reserve Chair Jerome Powell’s semi-annual testimony to Congress.
Attention will also fall on key central bank decisions including the Bank of England coupled with Fed speeches and top-tier economic data from major economies:
Monday, June 19
AUD: RBA meeting minutes
Tuesday, June 20
CNH: China loan prime rates
JPY: Japan industrial production
USD: Fed speeches
Wednesday, June 21
EUR: Eurozone new car registrations
CAD: Canada retail sales
GBP: UK May CPI
USD: Federal Reserve Chair Jerome Powell testimony
Thursday, June 22
CHF: Swiss National Bank rate decision
EUR: Eurozone consumer confidence
GBP: BoE rate decision
USD: Federal Reserve Chair Jerome Powell testimony, Fed speech
Friday, June 23
EUR: Eurozone S&P Global Manufacturing & Services PMI
JPY: Japan CPI
GBP: UK S&P Global/CIPS Manufacturing PMI
USD: S&P Global Manufacturing PMI, St. Louis Federal Reserve Bank President James Bullard speech
Just one week after the FOMC meeting brought a hawkish tilt on the rates outlook, Federal Reserve Chair Jerome Powell will be under the spotlight again.
Powell will provide his semi-annual monetary-policy report to the House Financial Service Committee on Wednesday 21st June and Senate Banking Committee on Thursday 22nd June. Powell is widely expected to reiterate comments from his post-Fed meeting press conference, which were cautious but still opened doors for more rate hikes. Indeed, the latest dot plot indicates two more 25 basis point rate hikes in the coming months but markets think otherwise with traders only pricing in one more for 2023.
Given how markets remain highly sensitive to rate hike expectations, his testimony has the potential to spark volatility – especially if fresh clues are offered on the Fed’s next move.
With all of the above discussed, here’s how these 3 assets could react to Powell’s testimony:
USD Index
Despite receiving a boost earlier in the week from a hawkish Federal Reserve, the dollar has found itself under renewed selling pressure thanks to disappointing US economic data. This has raised questions over just how much further the Fed can raise interest rates despite the dot plot signalling two more 25 basis point hikes in the coming months.
The dollar could weaken further if Powell strikes a cautious tone during Testimony, which could drag prices toward 101.50 and 100.72, respectively.
Should Powell sound more hawkish and offer fresh clues on rate hike timings, this may offer support to the dollar, pushing prices back above 103.00.
SPX500_m
The SPX500_m is en route to ending the week at levels not seen in 14 months as disappointing economic data fuelled expectations around the Fed’s hiking campaign coming to an end. SPX500 bulls are certainly in a position with power with the index gaining over 15% year-to-date.
The SPX500_m could extend gains towards 4500 in the coming week if Powell sounds cautious and expresses concerns over the US economic outlook.
If the Fed head suggests that US rates are likely to stay higher for longer, this may cap the SPX500_m upside gains – encouraging a decline back towards 4351 higher low.
Gold
Gold still remains trapped within a range with support at $1932 and resistance at $1985. A potent fundamental spark may be required for prices to experience a decisive breakout.
Gold prices could push above the $1985 resistance level on growing market expectations around the Fed’s hiking cycle coming to an end. This may be fuelled by cautious remarks from Powell or Fed officials.
Prices could sink back towards the $1932 and $1900 if Powell’s testimony boosts the dollar and renews rate hike bets.
In 2022, an AI-generated work of art won the Colorado State Fair’s art competition. The artist, Jason Allen, had used Midjourney – a generative AI system trained on art scraped from the internet – to create the piece. The process was far from fully automated: Allen went through some 900 iterations over 80 hours to create and refine his submission.
Yet his use of AI to win the art competition triggered a heated backlash online, with one Twitter user claiming, “We’re watching the death of artistry unfold right before our eyes.”
As generative AI art tools like Midjourney and Stable Diffusion have been thrust into the limelight, so too have questions about ownership and authorship.
These tools’ generative ability is the result of training them with scores of prior artworks, from which the AI learns how to create artistic outputs.
Should the artists whose art was scraped to train the models be compensated? Who owns the images that AI systems produce? Is the process of fine-tuning prompts for generative AI a form of authentic creative expression?
On one hand, technophiles rave over work like Allen’s. But on the other, many working artists consider the use of their art to train AI to be exploitative.
We’re part of a team of 14 experts across disciplines that just published a paper on generative AI in Science magazine. In it, we explore how advances in AI will affect creative work, aesthetics and the media. One of the key questions that emerged has to do with U.S. copyright laws, and whether they can adequately deal with the unique challenges of generative AI.
Copyright laws were created to promote the arts and creative thinking. But the rise of generative AI has complicated existing notions of authorship.
Still from ‘All watched over by machines of loving grace’ by Memo Akten, 2021. Created using custom AI software. Memo Akten, CC BY-SA
Photography serves as a helpful lens
Generative AI might seem unprecedented, but history can act as a guide.
Take the emergence of photography in the 1800s. Before its invention, artists could only try to portray the world through drawing, painting or sculpture. Suddenly, reality could be captured in a flash using a camera and chemicals. As with generative AI, many argued that photography lacked artistic merit. In 1884, the U.S. Supreme Court weighed in on the issue and found that cameras served as tools that an artist could use to give an idea visible form; the “masterminds” behind the cameras, the court ruled, should own the photographs they create.
Unlike inanimate cameras, AI possesses capabilities – like the ability to convert basic instructions into impressive artistic works – that make it prone to anthropomorphization. Even the term “artificial intelligence” encourages people to think that these systems have humanlike intent or even self-awareness.
This led some people to wonder whether AI systems can be “owners.” But the U.S. Copyright Office has stated unequivocally that only humans can hold copyrights.
So who can claim ownership of images produced by AI? Is it the artists whose images were used to train the systems? The users who type in prompts to create images? Or the people who build the AI systems?
Infringement or fair use?
While artists draw obliquely from past works that have educated and inspired them in order to create, generative AI relies on training data to produce outputs.
This training data consists of prior artworks, many of which are protected by copyright law and which have been collected without artists’ knowledge or consent. Using art in this way might violate copyright law even before the AI generates a new work.
Still from ‘All watched over by machines of loving grace’ by Memo Akten, 2021. Created using custom AI software. Memo Akten, CC BY-SA
For Jason Allen to create his award-winning art, Midjourney was trained on 100 million prior works.
Was that a form of infringement? Or was it a new form of “fair use,” a legal doctrine that permits the unlicensed use of protected works if they’re sufficiently transformed into something new?
While AI systems do not contain literal copies of the training data, they do sometimes manage to recreate works from the training data, complicating this legal analysis.
Will contemporary copyright law favor end users and companies over the artists whose content is in the training data?
To mitigate this concern, some scholars propose new regulations to protect and compensate artists whose work is used for training. These proposals include a right for artists to opt out of their data’s being used for generative AI or a way to automatically compensate artists when their work is used to train an AI.
Muddled ownership
Training data, however, is only part of the process. Frequently, artists who use generative AI tools go through many rounds of revision to refine their prompts, which suggests a degree of originality.
Answering the question of who should own the outputs requires looking into the contributions of all those involved in the generative AI supply chain.
The legal analysis is easier when an output is different from works in the training data. In this case, whoever prompted the AI to produce the output appears to be the default owner.
However, copyright law requires meaningful creative input – a standard satisfied by clicking the shutter button on a camera. It remains unclear how courts will decide what this means for the use of generative AI. Is composing and refining a prompt enough?
Matters are more complicated when outputs resemble works in the training data. If the resemblance is based only on general style or content, it is unlikely to violate copyright, because style is not copyrightable.
The illustrator Hollie Mengert encountered this issue firsthand when her unique style was mimicked by generative AI engines in a way that did not capture what, in her eyes, made her work unique. Meanwhile, the singer Grimes embraced the tech, “open-sourcing” her voice and encouraging fans to create songs in her style using generative AI.
If an output contains major elements from a work in the training data, it might infringe on that work’s copyright. Recently, the Supreme Court ruled that Andy Warhol’s drawing of a photograph was not permitted by fair use. That means that using AI to just change the style of a work – say, from a photo to an illustration – is not enough to claim ownership over the modified output.
While copyright law tends to favor an all-or-nothing approach, scholars at Harvard Law School have proposed new models of joint ownership that allow artists to gain some rights in outputs that resemble their works.
In many ways, generative AI is yet another creative tool that allows a new group of people access to image-making, just like cameras, paintbrushes or Adobe Photoshop. But a key difference is this new set of tools relies explicitly on training data, and therefore creative contributions cannot easily be traced back to a single artist.
The ways in which existing laws are interpreted or reformed – and whether generative AI is appropriately treated as the tool it is – will have real consequences for the future of creative expression.
The Federal Reserve’s decision to hold rates steady signals that central bankers believe it is time to hit pause, at least temporarily, on their aggressive campaign to tame runaway inflation.
The latest data, not to mention several other factors, however, suggests it’s time for a full stop.
On June 14, 2023, the Fed chose not to lift ratesfor the first time in 11 meetings, leaving its target interest rate – a benchmark for borrowing costs across the global economy – at a range of 5% to 5.25%. Over 10 consecutive hikes beginning in March 2022, the Fed had raised rates a whopping 5 percentage points.
“Holding the target range steady at this meeting allows the committee to assess additional information and its implications for monetary policy,” the central bank said in a statement. The Fed indicated it still expects to raise rates two more times by the end of the year.
As an economist who follows the central bank’s actions closely, I believe there’s good reason to think the Fed’s brief hiatus is likely to turn into a permanent vacation.
Inflation is lower than it appears
The fastest rate of inflation since the 1980s is what prompted the Fed to hike interest rates so much. So it makes sense that inflation would be a key indicator of when its job is complete.
The latest consumer price index data, released on June 13, showed core inflation – the Fed’s preferred measure, which excludes volatile food and energy prices – falling to an annual rate of 5.3% in May 2023, the slowest pace since November 2021. That’s down from a peak of 6.6% in September 2022.
While the data shows inflation remains well above the Fed’s target of around 2%, there’s good reason to believe that it will continue to fall regardless of what the Fed does.
Shelter, a measure of the cost of owning or renting a home, is the largest component of the consumer price index, accounting for more than one-third of the total. In its latest report, the Bureau of Labor Statistics reported shelter costs rose 8% from a year ago. After stripping that out, inflation was up just 2.1%.
The thing is, the data reported by the bureau doesn’t reflect the reality of what’s happening in the current housing market.
The Bureau of Labor Statistics relies on a survey that gauges rental prices from 50,000 leases, many of which were signed during the rental bubble in 2021 and 2022. A better measure of current market rents is the Zillow Observed Rent Index. That index suggests rates are declining – rents rose 4.8% year over year in May, aligning with pre-pandemic rates.
Comparing the two measures suggests the official consumer price index data lags behind the market by four to six months. Using current rents would put inflation much closer to where the Fed wants it to be. Jason Furman, former chair of the government’s Council of Economic Advisors, created a modified version of core inflation – which uses a market-based measure of shelter prices – at 2.6%.
The risk of more rate hikes
Moreover, it is likely that further rate hikes will do more harm than good – particularly to the banking sector – and without helping lower inflation below its current trajectory.
While there were several factors behind the banks’ demise, an important one was the Fed’s aggressive rate hikes, which caused the value of many of their assets to fall. The banks catered to depositors with accounts that exceeded the US$250,000 threshold protected by the Federal Deposit Insurance Corporation. These depositors ran for the hills when they learned about the extent of the bank losses.
The combination of already high interest rates and low office occupancy rates will likely force banks to absorb hundreds of billions of dollars in loan losses, inevitably putting more banks on the brink of failure.
And if the Fed keeps raising rates, the situation is likely to get a lot worse.
Don’t make the same mistakes
The Fed was behind the curve in 2021 and 2022 in realizing inflation was getting out of control, and it has been historically slow in recognizing the impact of rental rates on inflation.
The June pause in raising rates should give the Fed time to take a break, look at the data and, I hope, realize inflation is closer to its target than it appears.
But if it continues to raise rates, I believe the central bank will be repeating the same mistakes it made in the past.
Financial brokerage company RoboForex is launching a new promotional campaign, which offers large cash prizes. This year, the company’s partners can take part in it. The promotion period is from 1 June 2023 to 31 March 2024, with a total prize fund of 1,000,000 USD.
During the 10 months of the promotion, there will be 60 cash prizes, each worth 100,000 USD. The prizes will be distributed among the holders of the winning coupons, which can be obtained for referring clients to the Company through the RoboForex Partner Programme.
The number of coupons a partner can receive per month depends on their monthly affiliate commission, ranging from 1 to 31 coupons.
Drawing procedure and prize allocation
Each Coupon has a unique 6-digit number. To win, a participant’s coupon number must be mathematically closer to one of the winning combinations compared to other participants’ Coupon numbers. The winning combinations are based on the closing prices of the most popular assets on the last trading day of the first week of each calendar month.
The price data is recorded using the independent resource finance.yahoo.com.
Prize
Prize amount (USD)
1
15 000
2
10 000
3
8 000
4
7 000
5
5 000
6–60
1 000
View more information on the conditions for obtaining coupons and conducting the draw on the RoboForex website.
The distribution of coupons has already begun! Join us and take part in the draw every month of the promotion. We wish you good luck!
The European Union filed an antitrust case against Google on June 14, 2023, charging that the company abused its power in the online advertising market to disadvantage its competition. The U.S. Department of Justice filed a similar civil antitrust suit against Google on Jan. 24, 2023.
The online ad ecosystem is largely built around “programmatic advertising,” a system for placing advertisements from millions of advertisers on millions of websites. The system uses computers to automate bidding by advertisers on available ad spaces, often with transactions occurring faster than would be possible manually. Google runs the dominant advertising platform and has 28% market share of global advertising revenue.
Most websites outsource the task of selling ads to a complex network of advertising tech companies that do the work of figuring out which ads are shown to each particular person. Programmatic advertising is also a powerful tool that allows advertisers to target and reach people on a huge range of websites.
As a postdoctoral researcher in computer science, I study these technologies and companies, including how sketchy ads, like those for miracle weight-loss pills and suspicious-looking software, sometimes appear on legitimate, well-regarded websites.
Programmatic advertising, explained
The modern online advertising marketplace is meant to solve one problem: match the high volume of advertisements with the large number of ad spaces. The websites want to keep their ad spaces full and at the best prices, and the advertisers want to target their ads to relevant sites and users.
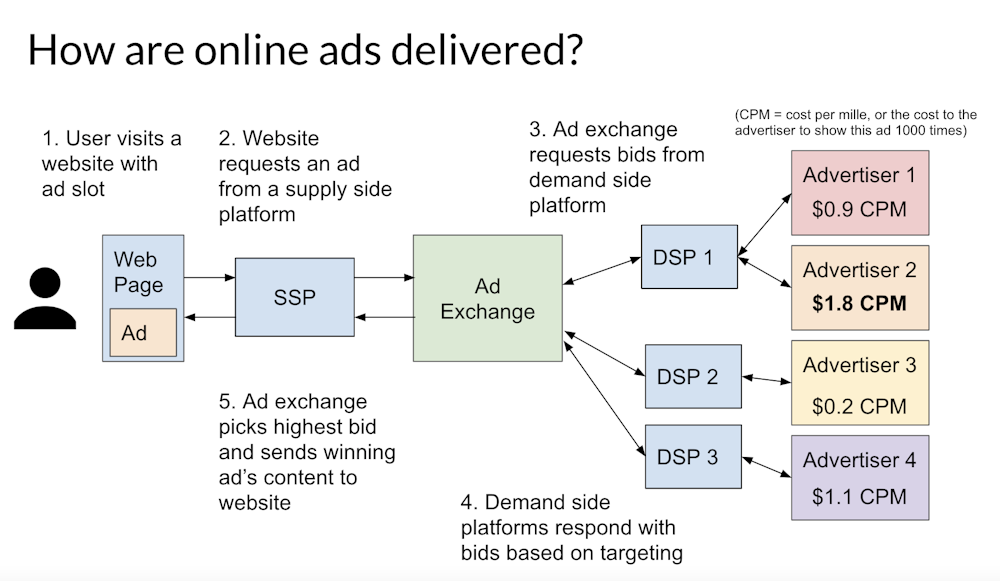
Rather than each website and advertiser pairing up to run ads together, advertisers work with demand-side platforms – tech companies that let advertisers buy ads. Websites work with supply-side platforms – tech companies that pay sites to put ads on their page. These companies handle the details of figuring out which websites and users should be matched with specific ads.
Most of the time, ad tech companies decide which ads to show through a real-time bidding auction. Whenever a person loads a website, and the website has a space for an ad, the website’s supply-side platform will request bids for ads from demand-side platforms through an auction system called an ad exchange. The demand-side platform will decide which ad in their inventory best targets the particular user, based on any information they’ve collected about the user’s interests and web history from tracking users’ browsing, and then submit a bid. The winner of this auction gets to place their ad in front of the user. This all happens in an instant.
When you see an ad on a web page, behind the scenes an ad network has just automatically conducted an auction to decide which advertiser won the right to present their ad to you. Eric Zeng, CC BY-ND
Google runs a supply-side platform, demand-side platform and an exchange. These three components make up an ad network. Google’s control of these three components sets the stage for the company to manipulate the market, as the EU and Justice Department allege the company has done. A variety of smaller companies such as Criteo, Pubmatic, Rubicon and AppNexus also operate in the online advertising market.
This system allows an advertiser to run ads to potentially millions of users, across millions of websites, without needing to know the details of how that happens. And it allows websites to solicit ads from countless potential advertisers without needing to contact or reach an agreement with any of them.
Screening out bad ads
Malicious advertisers, like any other advertiser, can take advantage of the scale and reach of programmatic advertising to send scams and links to malware to potentially millions of users on any website. I study how malicious online advertisers take advantage of this system. This means that online advertising companies have a big responsibility to prevent harmful ads from reaching users, but they sometimes fall short.
There are some checks against bad ads at multiple levels. Ad networks, supply-side platforms and demand-side platforms typically have content policies restricting harmful ads. For example, Google Ads has an extensive content policy that forbids illegal and dangerous products, inappropriate and offensive content, and a long list of deceptive techniques, such as phishing, clickbait, false advertising and doctored imagery.
However, other ad networks have less stringent policies. For example, MGID, a native advertising network my colleagues and I examined for a study and found to run many lower-quality ads, has a much shorter content policy that prohibits illegal, offensive and malicious ads, and a single line about “misleading, inaccurate or deceitful information.” Native advertising is designed to imitate the look and feel of the website that it appears on, and is typically responsible for the sketchy looking ads at the bottom of news articles. Another native ad network, content.ad, has no content policy on their website at all.
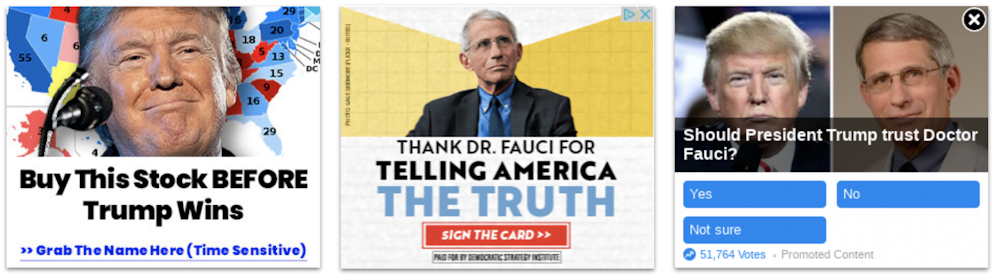
These political ads from the 2020 election are examples of potentially misleading techniques to get you to click on them. The ad on the left uses Donald Trump’s name and a clickbait headline promising money. The ad in the center claims to be a thank-you card for Dr. Anthony Fauci but in reality is intended to collect email addresses for political mailing lists. The ad on the right presents itself as an opinion poll but links to a page selling a product. Screenshots by Eric Zeng
Websites can block specific advertisers and categories of ads. For example, a site could block a particular advertiser that has been running scammy ads on their page, or specific ad networks that have been serving low-quality ads.
However, these policies are only as good as the enforcement. Ad networks typically use a combination of manual content moderators and automated tools to check that each ad campaign complies with their policies. How effective these are is unclear, but a report by Confiant, a firm that tracks malware in advertising, suggests that between 0.14% and 1.29% of ads served by various supply-side platforms in the third quarter of 2020 were low quality.
Malicious advertisers adapt to countermeasures and figure out ways to evade automated or manual auditing of their ads, or exploit gray areas in content policies. For example, in a study my colleagues and I conducted on deceptive political ads during the 2020 U.S. elections, we found many examples of fake political polls, which purported to be public opinion polls but asked for an email address to vote. Voting in the poll signed the user up for political email lists. Despite this deception, ads like these may not have violated Google’s content policies for political content, data collection or misrepresentation, or were simply missed in the review process.
Bad ads by design
Lastly, some examples of “bad” ads are intentionally designed to be misleading and deceptive, by both the website and ad network. Native ads are a prime example. They apparently are effective because native advertising companies claim higher clickthrough rates and revenue for sites. Studieshaveshown that this is likely because users have difficulty telling the difference between native ads and the website’s content.
These are examples of native ads found on news websites. They imitate the look and feel of links to news articles and often contain clickbait, scams and questionable products. Screenshot by Eric Zeng
You may have seen native ads on many news and media websites, including on major sites like CNN, USA Today and Vox. If you scroll to the bottom of a news article, there may be a section called “sponsored content” or “around the web,” containing what look like news articles. However, all of these are paid content. My colleagues and I conducted a study on native advertising on news and misinformation websites and found that these native ads disproportionately contained potentially deceptive and misleading content, such as ads for unregulated health supplements, deceptively written advertorials, investment pitches and material from content farms.
This highlights an unfortunate situation. Even reputable news and media websites are struggling to earn revenue, and turn to running deceptive and misleading ads on their sites to earn more income, despite the risks it poses to their users and the cost to their reputations.
This is an updated version of an article originally published on April 13, 2022.
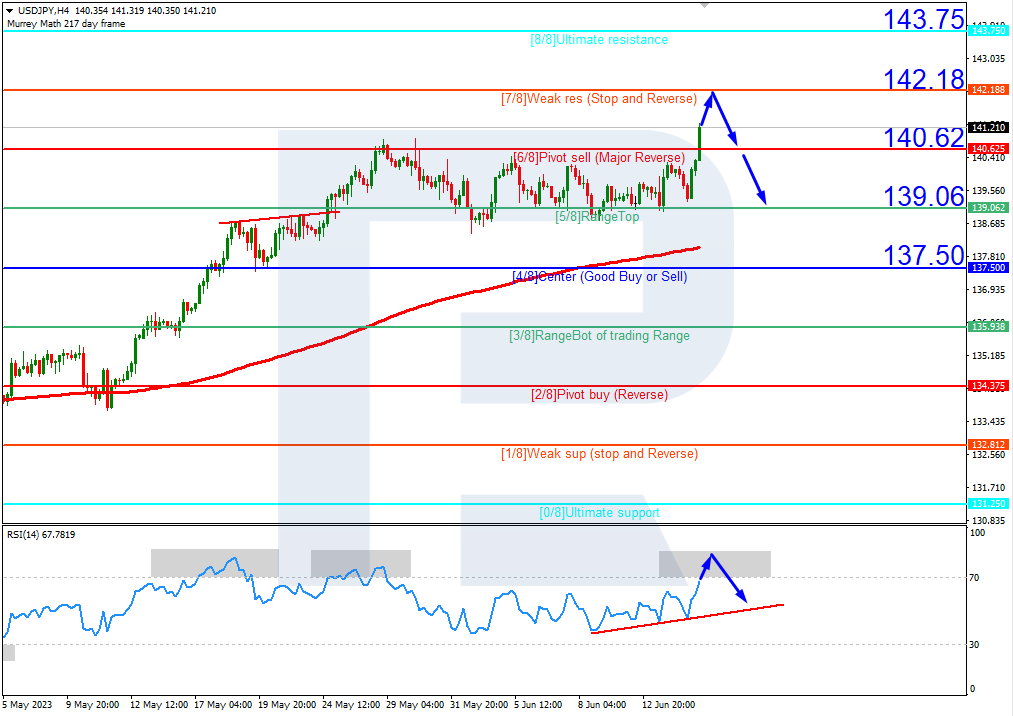
By RoboForex.com USDJPY, “US Dollar vs Japanese Yen”
On H4, the quotes are above the 200-day Moving Average, indicating the prevalence of an uptrend. However, the RSI is nearing the overbought area. As a result, in these circumstances a test of 7/8 (142.18) is expected, followed by a rebound from this level and a decline to the support at 5/8 (139.06). The scenario can be cancelled by rising above the resistance at 7/8 (142.18). In this case, the pair might continue growing, and the quotes might reach 8/8 (143.75).
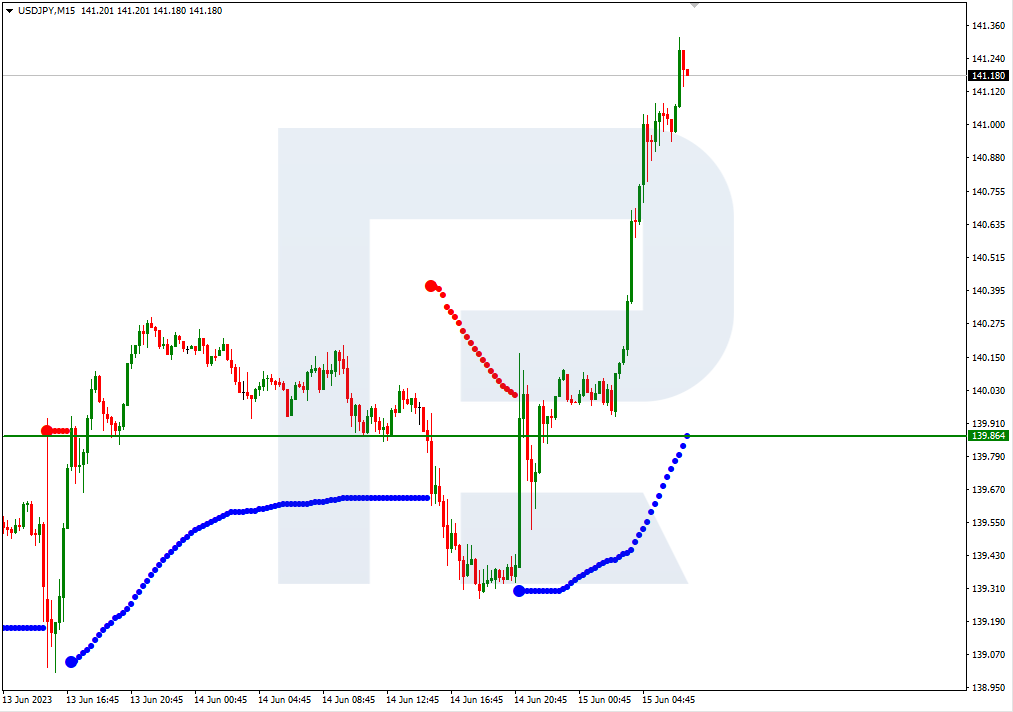
On M15, an additional signal confirming the decline after a rebound from 7/8 (142.18), might be a breakout of the lower border of the VoltyChannel.
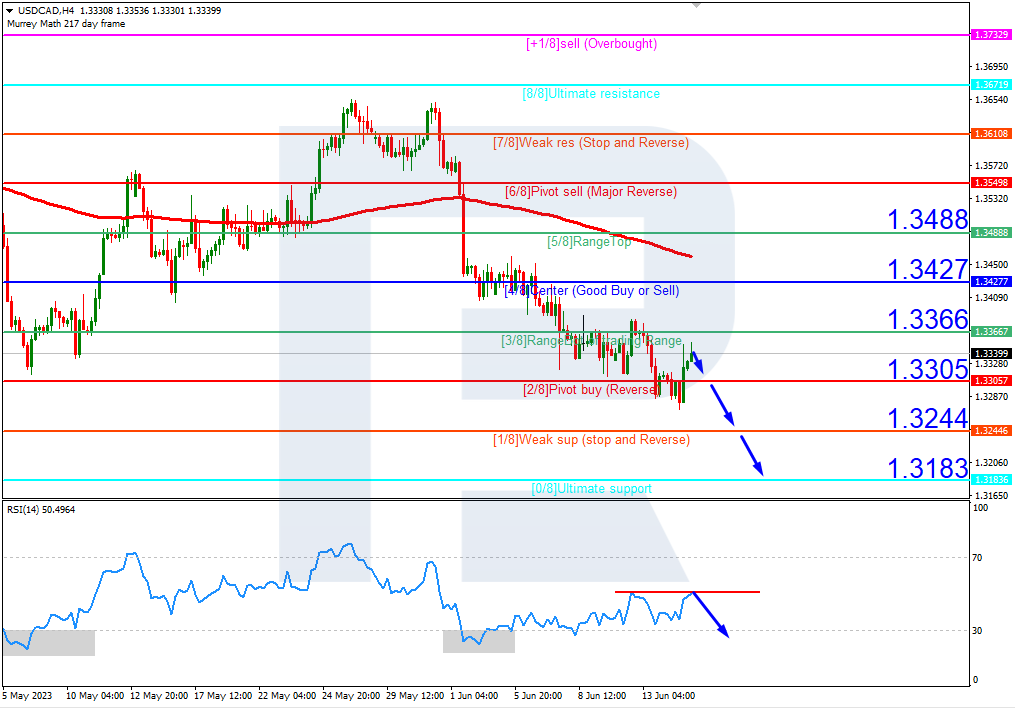
USDCAD, “US Dollar vs Canadian Dollar”
On H4, the quotes are under the 200-day Moving Average, indicating the prevalence of a downtrend. The RSI is testing the resistance line. In this situation, a downward breakout of 2/8 (1.3305) is expected, followed by a decline to the support at 0/8 (1.3183). The scenario can be cancelled by rising above the resistance at 3/8 (1.3366). In this case, the pair could correct to 4/8 (1.3427).
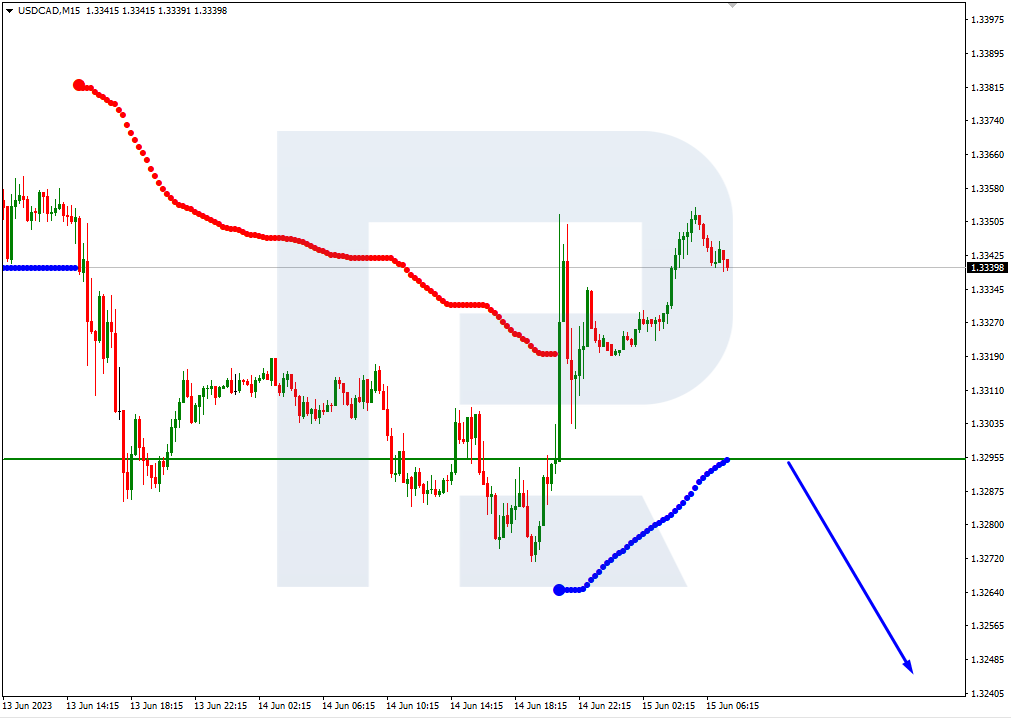
On M15, a breakout of the lower line of the VoltyChannel might increase the probability of a decline.
Attention! Forecasts presented in this section only reflect the author’s private opinion and should not be considered as guidance for trading. RoboForex LP bears no responsibility for trading results based on trading recommendations described in these analytical reviews.
The EURUSD has turned bullish on the daily timeframe. Prices were initially in a down trend until 31 May when a last lower bottom was recorded at 1.06353. After breaking above significant resistance levels, bulls were back in the driving seat with prices advancing to the upside from there.
After rebounding from the lower bottom, prices pressed though the 15 Simple Moving Average (SMA) and the Momentum Oscillator provided confirmation by heading for the 100 baseline and breaking into bullish terrain a bit later.
A higher top was created when the price bounced off a weekly resistance level on 8 June at 1.07871. Bears tried to pull the price lower but they could not make any headway before bulls took over again.
On 12 June the bulls broke through the higher top and weekly resistance level and a long trade was triggered. Three possible targets were possible from there. Attaching the Fibonacci tool to the higher top 1.07871 and dragging it to a higher bottom that was established on 7 June at 1.06671, the following targets were established:
The first potential target was at 1.08613 (161.8%) and the market reached that price on 14 June.
The second price target is likely at 1.09813 (261.8%)
The third and final target may reach 1.11754 (423.6%) if the price are able to break through a weekly resistance level around the 1.10843 level.
If the support level at 1.06671 is broken, this scenario is no longer appropriate, and any open risk must be managed accordingly.
As long as the bulls keep building momentum with demand overcoming supply, the market sentiment for EURUSD on the D1 time frame will remain bullish.
The Dow Jones Index (US30) decreased by 0.68% at the stock market’s close yesterday, while the S&P 500 Index (US500) added 0.08%. The NASDAQ Technology Index (US100) closed Wednesday positive by 0.39%.
The US Federal Reserve expectedly left rates unchanged yesterday at 5.25% but predicted further increases at the next meetings. The Fed now sees its peak rate at 5.6% in mid-2023, up from its previous forecast of 5.1% in March, which suggests two more hikes.
The main points from Jerome Powell’s speech at yesterday’s press conference:
The FOMC is committed to getting inflation back to 2.0% to achieve price stability.
The rate was raised to 5% from March 2022 through May 2023, which is a statistically unconventionally fast “move,” but given the data coming in, the FOMC has decided to move at a more moderate pace and consider raising the rate at future meetings.
Given the lag in the effect of monetary policy, a rate hike in July 2023 depends on many variables, so the FOMC is closely watching labor market conditions, inflation data and financial sector conditions over a 3-month period.
The FOMC does not see the effects of stress in the banking sector.
The expected median rate at the end of 2023 is 5.6%,2024 is 4.6%, and 2025 is 3.4%.
Asset reduction in Treasury securities will continue (QT-quantitative tightening).
BofA Global Research said it now expects two more quarter percentage point interest rate hikes from the US Federal Reserve this year, raising its final rate forecast to 5.5%-5.75%.
Amazon (AMZN) is considering using AMD’s artificial intelligence (AMD) chips in its cloud business.
Stock markets in Europe were mainly up Wednesday. Germany’s DAX (DE30) gained 0.49%, France’s CAC 40 (FR40) gained 0.52%, Spain’s IBEX 35 index (ES35) jumped by 1.20%, and Britain’s FTSE 100 (UK100) closed positive by 0.10% yesterday.
The European Central Bank (ECB) will almost certainly raise borrowing costs today and leave room for further increases as it continues to fight high inflation, even as the Eurozone economy weakens. More Eurozone countries are signaling a technical recession (2 consecutive declines in GDP per quarter). Eurozone’s inflation is still high for the ECB at 6.1%, more than three times its target of 2%, and core prices, which excludes food and energy, are only beginning to slow. Economists expect another 0.25% increase in July before the ECB pauses in fall 2023.
Asian markets traded higher yesterday. Japan’s Nikkei 225 (JP225) gained 1.47% on the day, China’s FTSE China A50 (CHA50) was up by 0.14%, Hong Kong’s Hang Seng (HK50) ended the day down by 0.58%, and Australia’s S&P/ASX 200 (AU200) closed positive by 0.32%.
The Japanese yen fell to an 8-month low against the dollar amid hawkish statements from the US Federal Reserve. The Japanese government is once again talking about currency intervention. Japan’s Chief Cabinet Secretary pointed out that excessive fluctuations in the currency are undesirable, with a senior currency official saying that the government would take action if necessary. Last year the weakening of the yen to 146 yen per dollar triggered the first intervention.
New Zealand’s gross domestic product (GDP) fell by 0.1% in the first quarter of 2023. This is the second consecutive quarterly decline in GDP, indicating that New Zealand has entered a technical recession. The contraction was caused by a decline in manufacturing, which fell by 3.5%, and transportation, port, and warehouse services, which fell by 2.2%. The Reserve Bank of New Zealand (RBNZ) raised its benchmark rate to a 14-year high at its May meeting, and it was probably the last increase this year.
S&P 500 (F) (US500) 4,372.59 +3.58 (+0.082%)
Dow Jones (US30)33,979.33 −232.79 (−0.68%)
DAX (DE40) 16,310.79 +80.11 (+0.49%)
FTSE 100 (UK100) 7,602.74 +7.96 (+0.10%)
USD Index 103.02 -0.32 (-0.31%)
Important events for today:
– New Zealand GDP (q/q) at 01:45 (GMT+3);
– Australia Unemployment Rate (m/m) at 04:30 (GMT+3);
– China Industrial Production (m/m) at 05:00 (GMT+3);
– China Unemployment Rate (m/m) at 05:00 (GMT+3);
– China Retail Sales (m/m) at 05:00 (GMT+3);
– Switzerland Producer Price Index (m/m) at 09:30 (GMT+3);
– Eurozone Trade Balance (m/m) at 12:00 (GMT+3);
– Eurozone ECB Interest Rate Decision at 15:15 (GMT+3);
– Eurozone ECB Interest Monetary Policy Statement at 15:15 (GMT+3);
– US Retail Sales (m/m) at 15:30 (GMT+3);
– US Initial Jobless Claims (w/w) at 15:30 (GMT+3);
– US Empire State Manufacturing Index (m/m) at 15:30 (GMT+3);
– Eurozone ECB Press Conference at 15:45 (GMT+3);
– US Industrial Production (m/m) at 16:15 (GMT+3);
This article reflects a personal opinion and should not be interpreted as an investment advice, and/or offer, and/or a persistent request for carrying out financial transactions, and/or a guarantee, and/or a forecast of future events.
The US Federal Reserve must now stop interest rate hikes due to the “notorious time lag” of monetary policy, warns the CEO of one of the world’s largest independent financial advisory, asset managers and fintech organizations.
The warning from deVere Group’s Nigel Green comes as the US central bank’s Chair Jerome Powell on Wednesday announced after a meeting of the FOMC (Federal Open Market Committee) – the branch of the Fed responsible for implementing monetary policy – that it would skip raising rates this month, as was widely anticipated, but will resume after this pause.
He says: “After a painful 15 months and 10 consecutive rate increases into its battle to cool red-hot inflation, the Fed has confirmed what markets had expected: that it is not raising rates this month in the world’s largest economy right now.
“This clearly indicates that the fight to combat soaring prices is, finally, being won.
“This is good news for households, businesses and those financial assets hit by the most aggressive monetary policy since the 1980s.”
However, the Fed isn’t done with raising rates at this point.
“This pause is just a ‘skip’, as we expected.
“Both core and headline inflation are coming down, but core is still pretty high. The target of 2% is still way off. And the Fed is obsessing over the tightness of the labor market as, despite the 15-month-long inflation battle, unemployment is still near record lows.
“As such, I wouldn’t be surprised at all if rates were hiked to 6% by the end of 2023.”
As the Federal Reserve will resume rate hikes this year, Nigel Green is issuing a warning to the US central bank.
“The battle against inflation is being won. This is now the time for the Fed to stop – not pause – interest rate hikes.
He says: “The time lag for monetary policies is notoriously long.
“It typically takes about 18 months to two years for the full effect of rate hikes to filter fully into the economy.
“We’re now beginning to see the drag effects on the world’s largest economy with households and businesses becoming considerably more cautious.”
He continues: “Investors are increasingly concerned that with more hikes the Federal Reserve could steer the US economy into a major recession.
“Of course, the central bank will argue it needs to continue with rate rises to bring inflation back to target.
“But it must also ensure that the tight labor market doesn’t overshadow the broader picture and continue to overdo the hikes, which would make a US recession deeper and longer.
“As the world’s largest economy, this would clearly have a serious, negative impact on the global economy.”
He concludes: “The case for stopping rate hikes is compelling.”
About:
deVere Group is one of the world’s largest independent advisors of specialist global financial solutions to international, local mass affluent, and high-net-worth clients. It has a network of more than 70 offices across the world, over 80,000 clients and $12bn under advisement.


 Still from ‘All watched over by machines of loving grace’ by Memo Akten, 2021. Created using custom AI software.