By InvestMacro
Here are the latest charts and statistics for the Commitment of Traders (COT) data published by the Commodities Futures Trading Commission (CFTC).
The latest COT data is updated through Tuesday March 24th and shows a quick view of how large market participants (for-profit speculators and commercial traders) were positioned in the futures markets. All currency positions are in direct relation to the US dollar where, for example, a bet for the euro is a bet that the euro will rise versus the dollar while a bet against the euro will be a bet that the euro will decline versus the dollar.
Weekly Speculator Changes led by British Pound & Mexican Peso
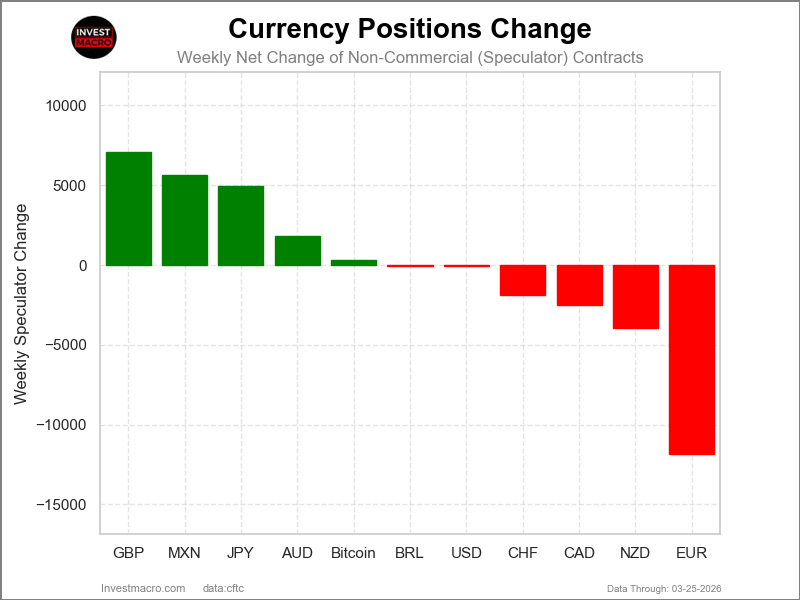
The COT currency market speculator bets were slightly lower this week as five out of the eleven currency markets we cover had higher positioning while the other six markets had lower speculator contracts.
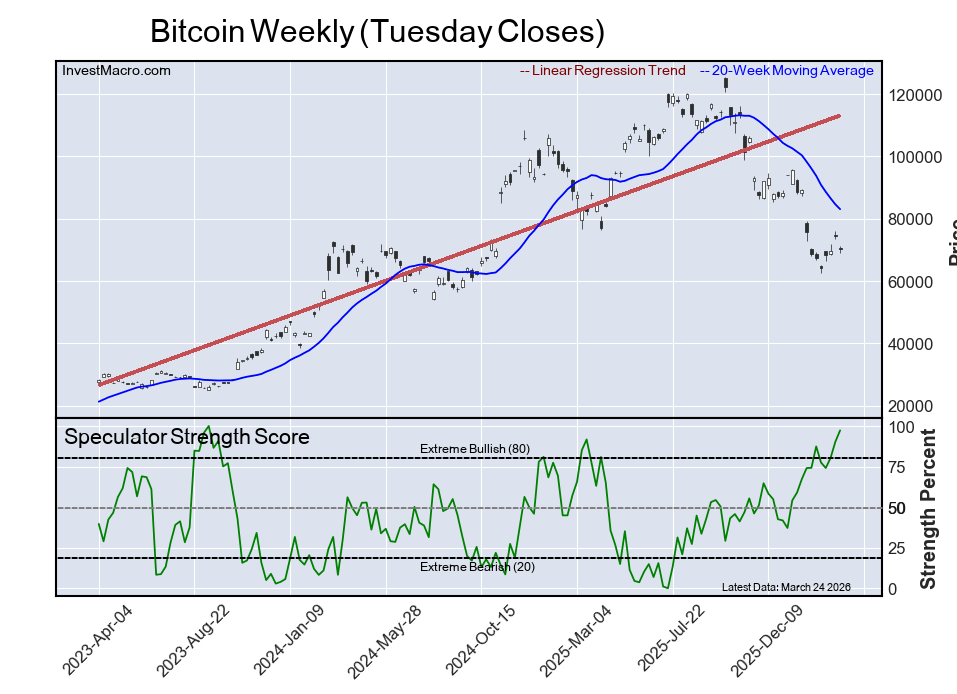
Leading the gains for the currency markets was the British Pound (7,093 contracts) with the Mexican Peso (5,616 contracts), the Japanese Yen (4,974 contracts), the Australian Dollar (1,811 contracts) and Bitcoin (333 contracts) also showing positive weeks.
The currencies seeing declines in speculator bets on the week were the EuroFX (-11,853 contracts), the Canadian Dollar (-2,488 contracts), the New Zealand Dollar (-3,949 contracts), the Swiss Franc (-1,884 contracts), the US Dollar Index (-76 contracts) and with the Brazilian Real (-69 contracts) also registering lower bets on the week.
Euro Speculator Bets dropped to 55-Week Low
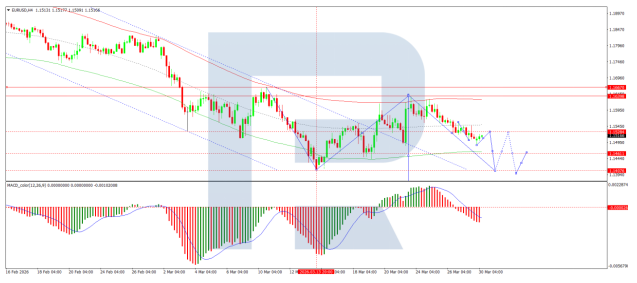
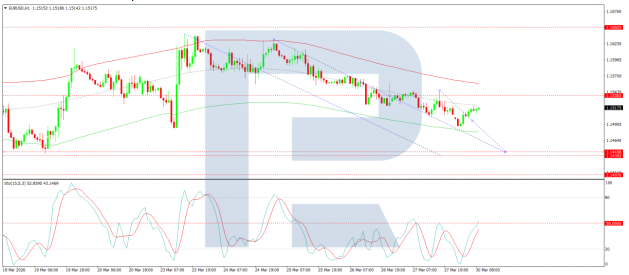
Highlighting the Currencies speculator positions this week was the continued drop in the Euro speculator bullish position. It has been quite a turnaround for the Euro speculator positions in recent weeks as speculators pushed the Euro net positions to an all-time top ten high bullish position on February 10th at a total of 180,305 net contracts. Since that recent high, Euro positions have fallen for six consecutive weeks and by -171,026 net contracts over that time period. This has brought the overall speculator position down from 180,305 bullish positions to this week’s net contract level of just 9,279 contracts. Overall, the Euro position has continuously been in a bullish standing since March 11th of 2025. The Euro price has now fallen below the 1.1600 exchange rate in the Currency markets and has now declined in six out of the last nine weeks and currently trades at the 1.1556 area. The Euro traded as high as 1.2110 late in January before the Iran war broke out and has now come back towards the 1.1500 major support level.
The Canadian Dollar speculative position this week fell by approximately -2,500 contracts and has now fallen three out of the past four weeks. This negative sentiment has brought the Canadian Dollar speculator position back into a small bearish position of -1,602 net positions this week. The Canadian Dollar contracts had been in a strong bearish position for the past few years before seeing a turnaround and rising into bullish bets in early February. That had pushed the bullish position up to as high as +36,159 contracts on March 10th. However, since then, the speculative position has fallen off and culminated in a bearish level this week. The Canadian Dollar in the Currency markets has been on the decline as well and has fallen for three consecutive weeks against the US Dollar. The Canadian Dollar recently bounced to lower levels off the 200-week moving average (CAD traded as high as 0.7431 in late January) and has now trended lower to this week’s close at 0.7225.
The Mexican Peso position rebounded this week with a gain of over 5,500 net contracts. This breaks an eight-week losing streak that had seen the overall net position fall from 103,114 net contracts on January 27th to a total of 68,460 net contracts on March 17th. This week’s gain brings the overall net position back above +70,000 contracts to +74,076 net contracts. Overall, the Mexican Peso has pretty much seen strong bullish speculator positions dating back to March of 2023 through the current period (save for a small bullish positioning streak in late 2024). The Mexican Peso in the Currency markets this week, although, has continued on a decline for five consecutive weeks against the US Dollar. However, overall, the Mexican Peso has been higher against the US Dollar since the beginning of 2025 by approximately 15%.
The US Dollar Index contracts were virtually unchanged this week with a small decline of just 76 contracts. Overall, the US Dollar net positioning has now been in a consecutive bullish position for two weeks straight after seeing a large +9,575 net contract change on March 17th. The US Dollar Index in the Currency markets has now been higher in four out of the past six weeks and trades right around the major 100.00 level, which may determine the currency’s direction in the near and medium term. The US Dollar Index has now rallied by approximately 5% since hitting a low near 95.36 in January.
Brazilian Real and US Dollar Index lead weekly Currency Market Price Performance
The Currency Market Price Performance this week was heavily skewed towards the downside as only two currencies had positive returns over the past five days, while nine currencies had lower prices on the week. The Brazilian Real led the way with a 0.95% increase on the week and was followed by the US Dollar Index, which improved by 0.58%.
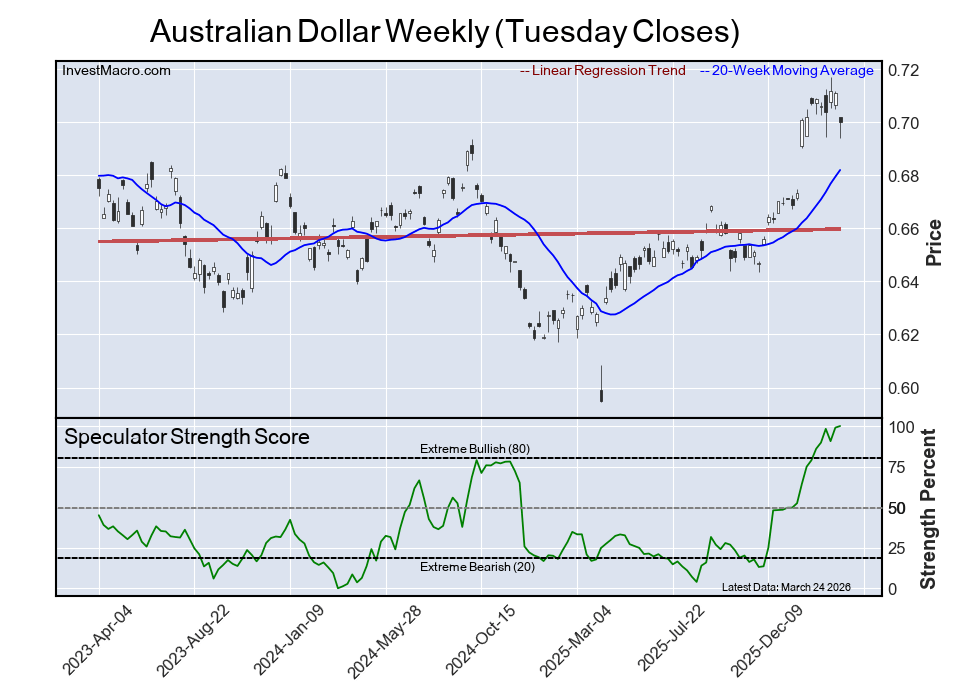
On the downside, the biggest loser on the week was Bitcoin, which fell by -5.78%, with the next largest decliner on the week being the Australian Dollar, which fell by -2.14%. The Peso, the Mexican Peso, declined by -1.57%, followed by the New Zealand Dollar, which fell by -1.45%. The Swiss Franc was lower by -1.3%. The Canadian Dollar dipped by -1.22%, while the Japanese Yen decreased by -0.66%. The British Pound Sterling was lower by -0.59%, and the Euro rounds out the decliners on the week with a -0.53% dip.
Over the past 30 days, all of the Currency markets were lower except for the US Dollar Index, which is up by 3.80% over that time period.
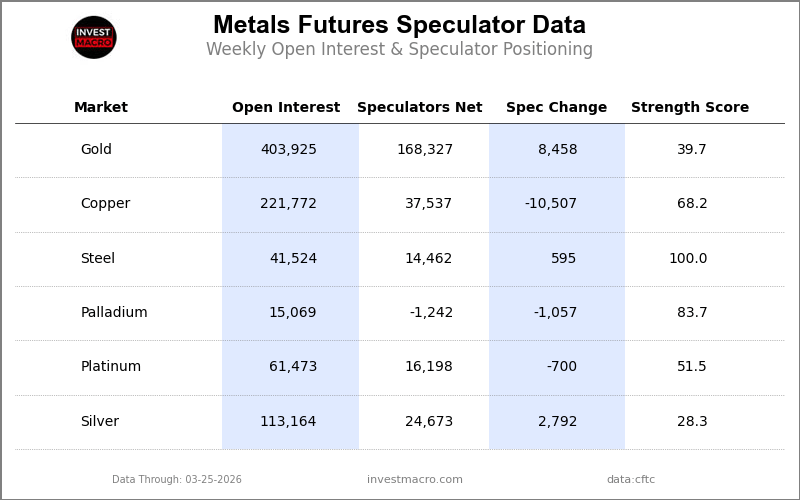
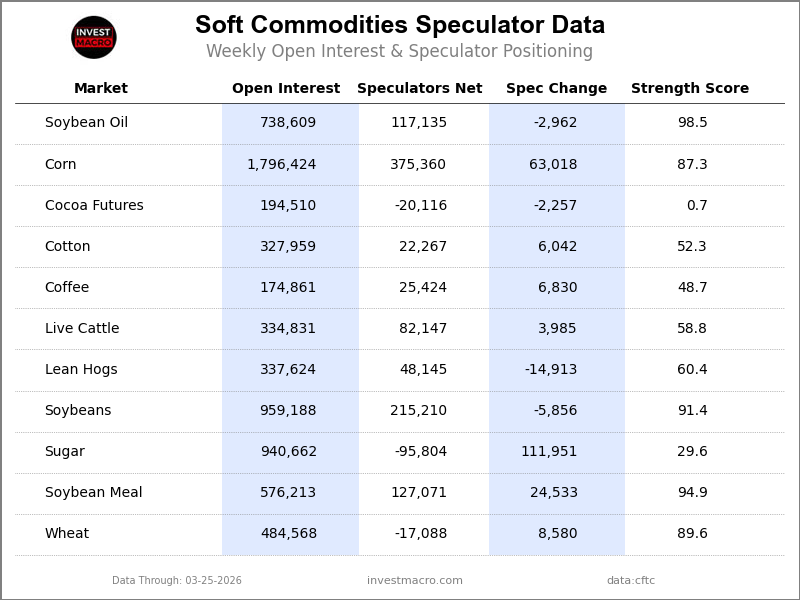
Currencies Data:
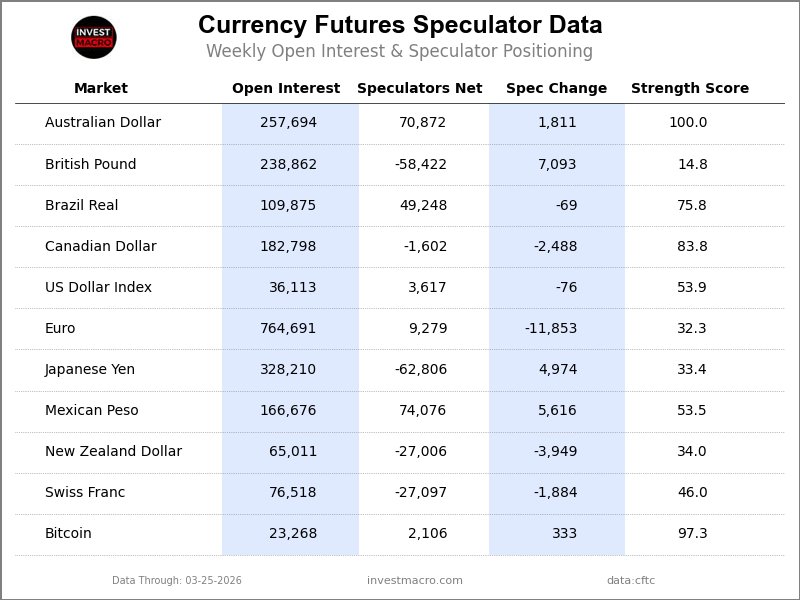
Legend: Open Interest | Speculators Current Net Position | Weekly Specs Change | Specs Strength Score compared to last 3-Years (0-100 range)
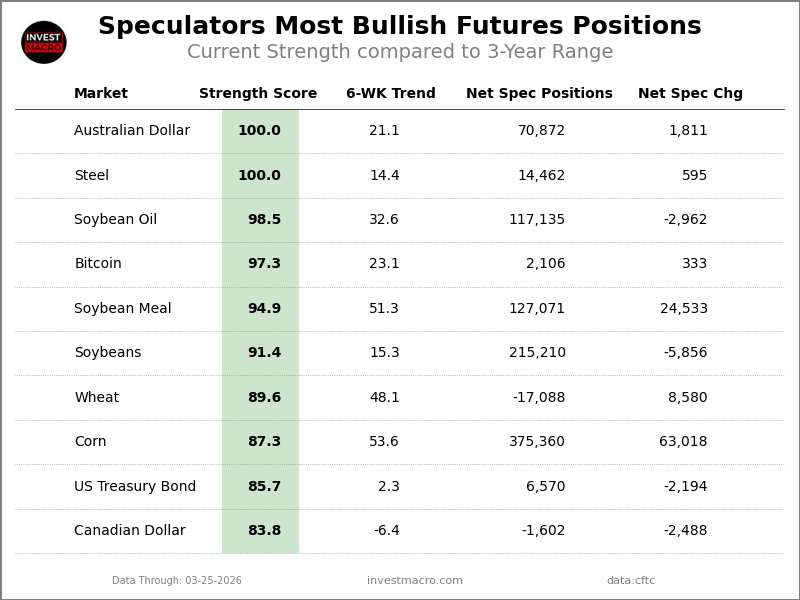
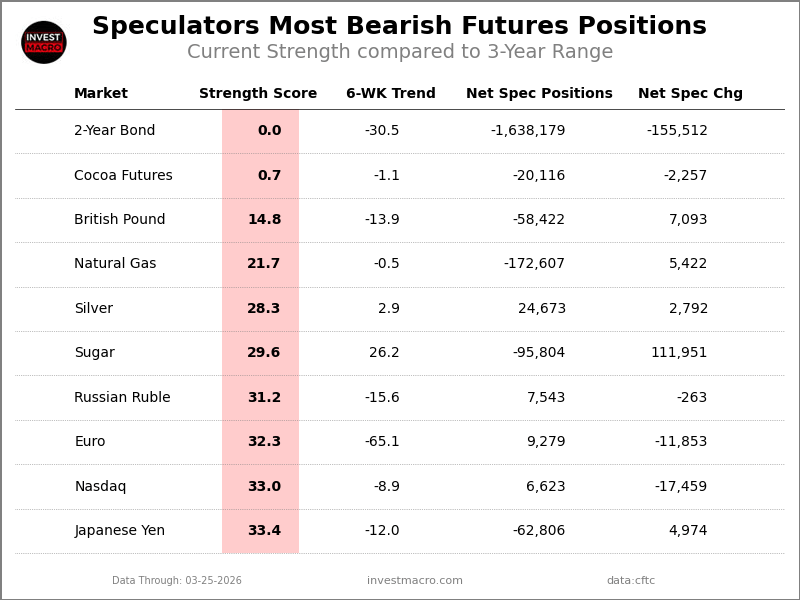
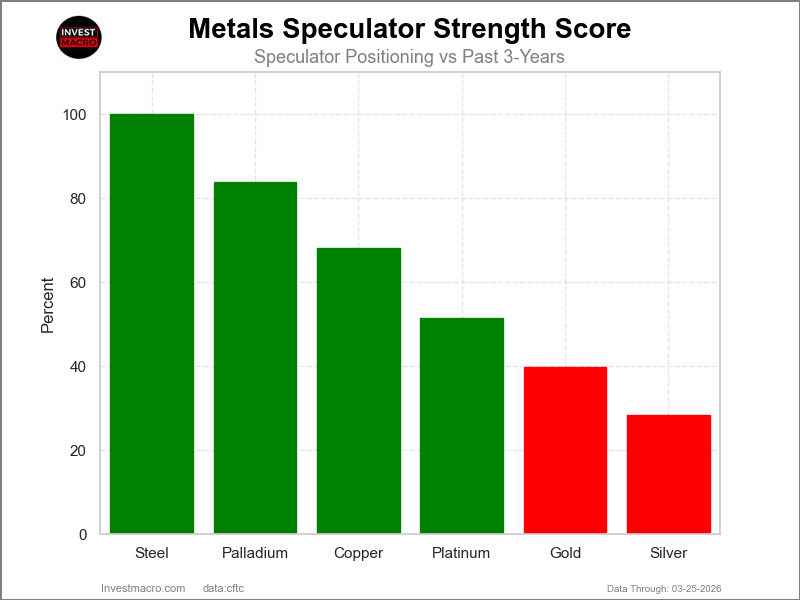
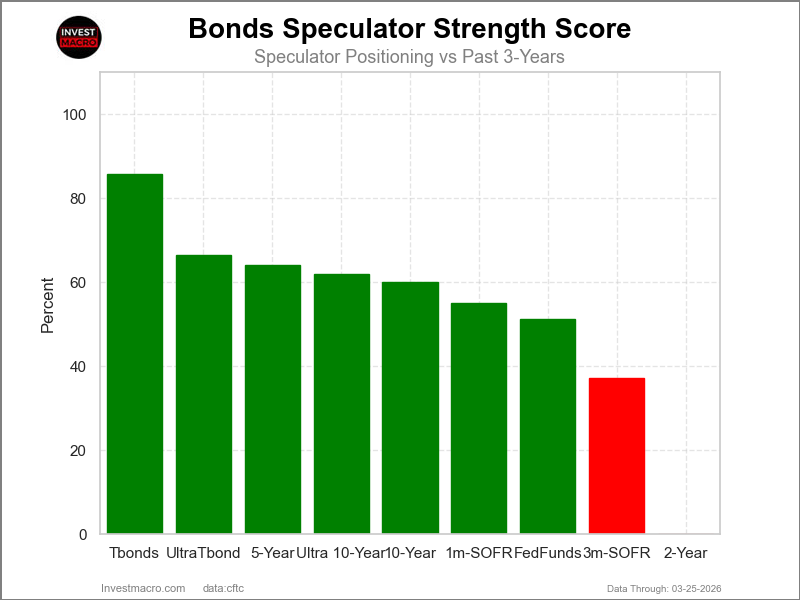
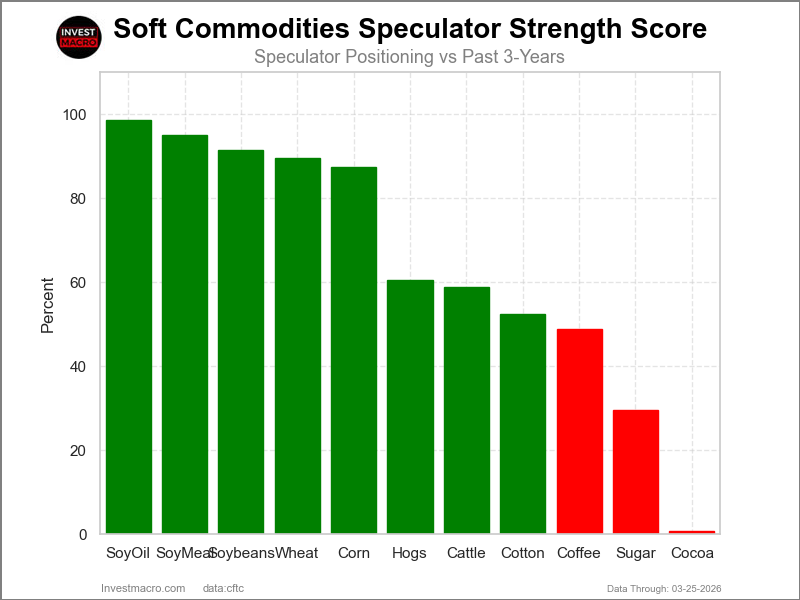
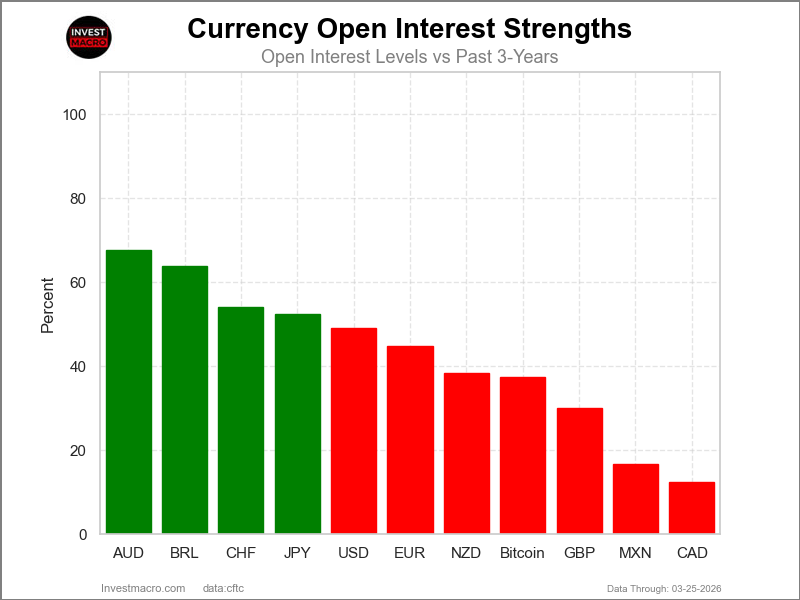
Strength Scores led by Australian Dollar & Bitcoin
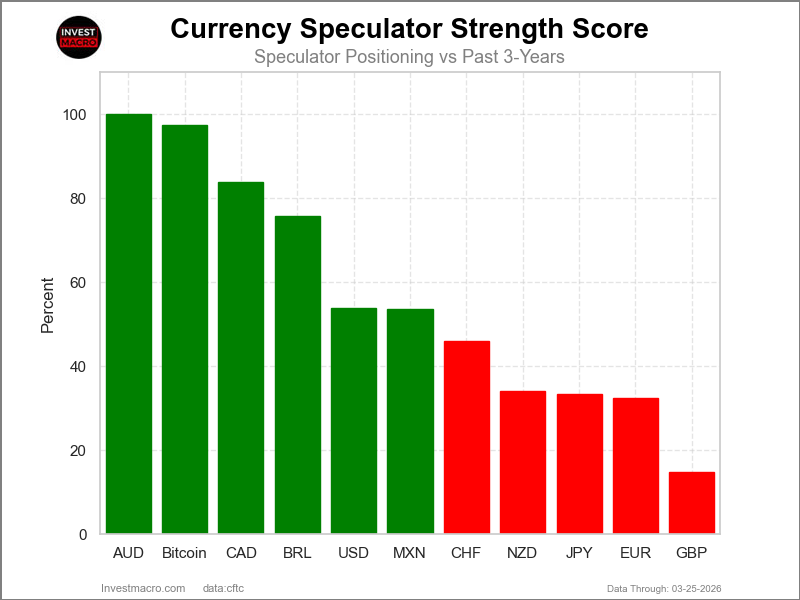
COT Strength Scores (a normalized measure of Speculator positions over a 3-Year range, from 0 to 100 where above 80 is Extreme-Bullish and below 20 is Extreme-Bearish) showed that the Australian Dollar (100 percent) and the Bitcoin (97 percent) lead the currency markets this week. The Canadian Dollar (84 percent), Brazilian Real (76 percent) and the US Dollar Index (54 percent) come in as the next highest in the weekly strength scores.
On the downside, the British Pound (15 percent) comes in at the lowest strength levels currently and are in Extreme-Bearish territory (below 20 percent). The next lowest strength scores are the EuroFX (32 percent), the Japanese Yen (33 percent) and the New Zealand Dollar (34 percent).
3-Year Strength Statistics:
US Dollar Index (53.9 percent) vs US Dollar Index previous week (54.1 percent)
EuroFX (32.3 percent) vs EuroFX previous week (36.8 percent)
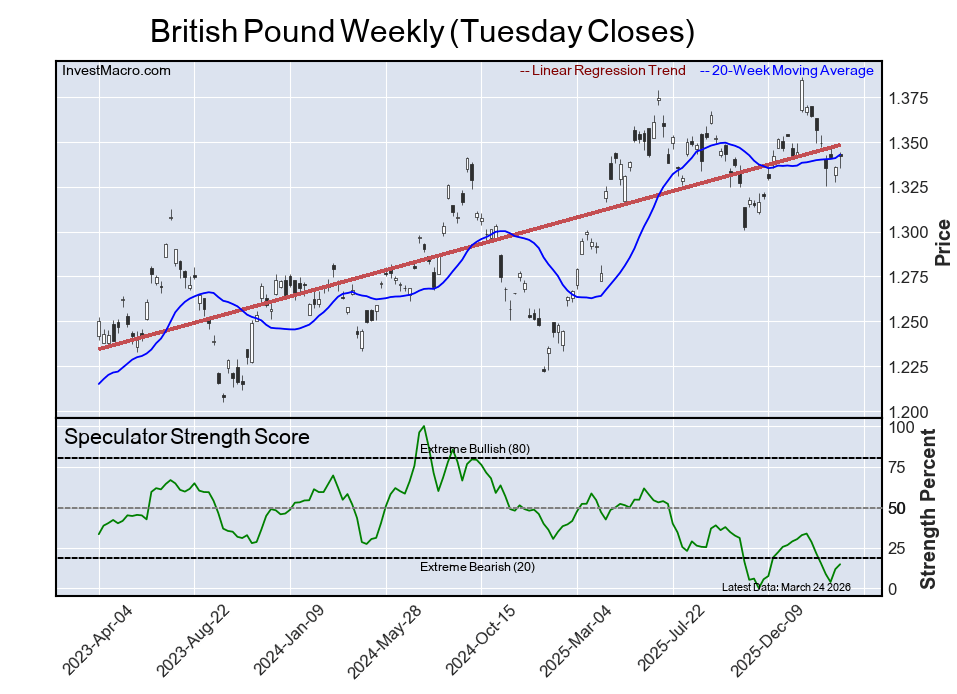
British Pound Sterling (14.8 percent) vs British Pound Sterling previous week (11.8 percent)
Japanese Yen (33.4 percent) vs Japanese Yen previous week (32.0 percent)
Swiss Franc (46.0 percent) vs Swiss Franc previous week (49.8 percent)
Canadian Dollar (83.8 percent) vs Canadian Dollar previous week (84.8 percent)
Australian Dollar (100.0 percent) vs Australian Dollar previous week (99.0 percent)
New Zealand Dollar (34.0 percent) vs New Zealand Dollar previous week (38.5 percent)
Mexican Peso (53.5 percent) vs Mexican Peso previous week (49.6 percent)
Brazilian Real (75.8 percent) vs Brazilian Real previous week (75.8 percent)
Bitcoin (97.3 percent) vs Bitcoin previous week (90.3 percent)
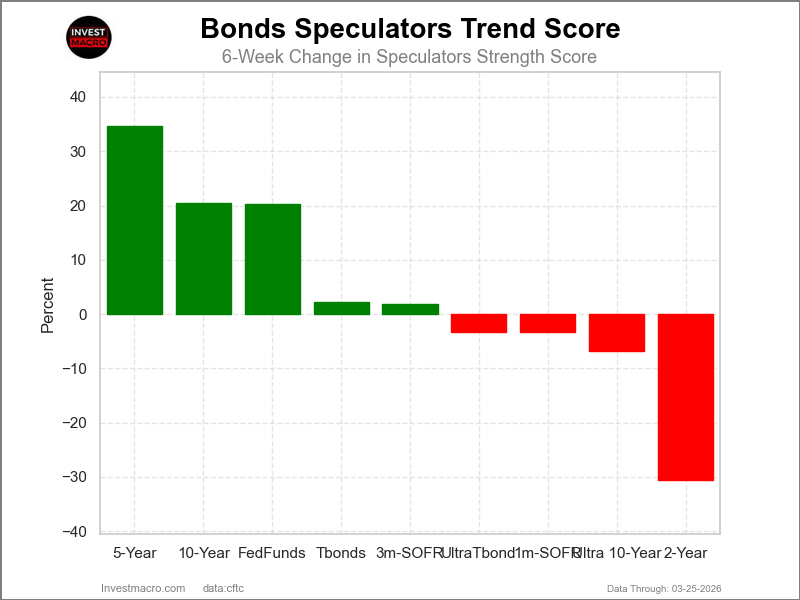
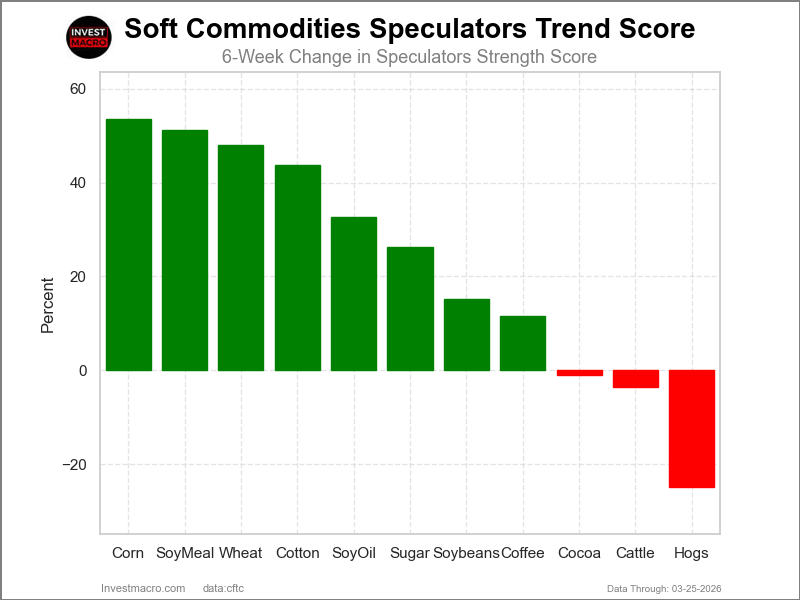
Swiss Franc & Bitcoin top the 6-Week Strength Trends
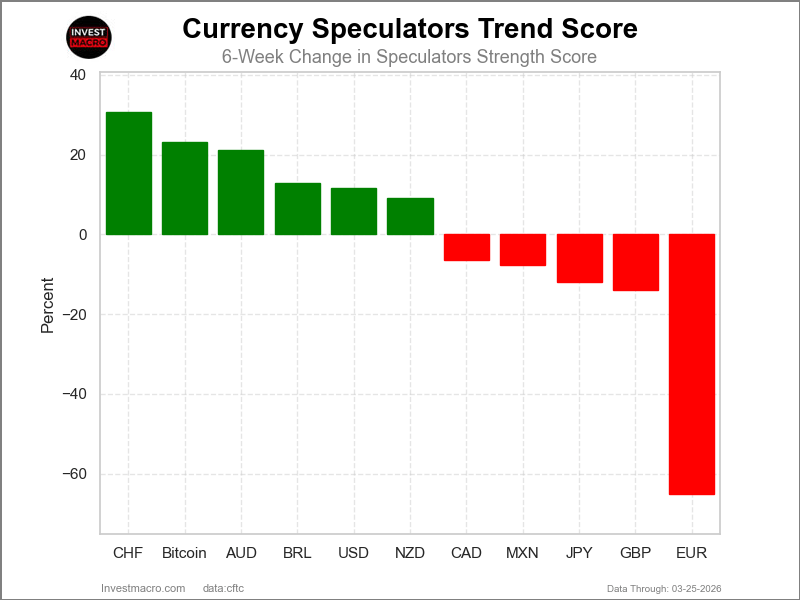
COT Strength Score Trends (or move index, calculates the 6-week changes in strength scores) showed that the Swiss Franc (31 percent) and Bitcoin (23 percent) lead the past six weeks trends for the currencies. The Australian Dollar (21 percent), the Brazilian Real (13 percent) and the US Dollar Index (12 percent) are the next highest positive movers in the 3-Year trends data.
The EuroFX (-65 percent) leads the downside trend scores currently with the British Pound (-14 percent), Japanese Yen (-12 percent) and the Mexican Peso (-8 percent) following next with lower trend scores.
3-Year Strength Trends:
US Dollar Index (11.7 percent) vs US Dollar Index previous week (12.3 percent)
EuroFX (-65.1 percent) vs EuroFX previous week (-54.1 percent)
British Pound Sterling (-13.9 percent) vs British Pound Sterling previous week (-21.9 percent)
Japanese Yen (-12.0 percent) vs Japanese Yen previous week (-13.4 percent)
Swiss Franc (30.7 percent) vs Swiss Franc previous week (31.4 percent)
Canadian Dollar (-6.4 percent) vs Canadian Dollar previous week (-0.5 percent)
Australian Dollar (21.1 percent) vs Australian Dollar previous week (24.1 percent)
New Zealand Dollar (9.0 percent) vs New Zealand Dollar previous week (12.8 percent)
Mexican Peso (-7.7 percent) vs Mexican Peso previous week (-15.7 percent)
Brazilian Real (12.8 percent) vs Brazilian Real previous week (13.4 percent)
Bitcoin (23.1 percent) vs Bitcoin previous week (16.2 percent)
Individual COT Forex Markets:
US Dollar Index Futures:
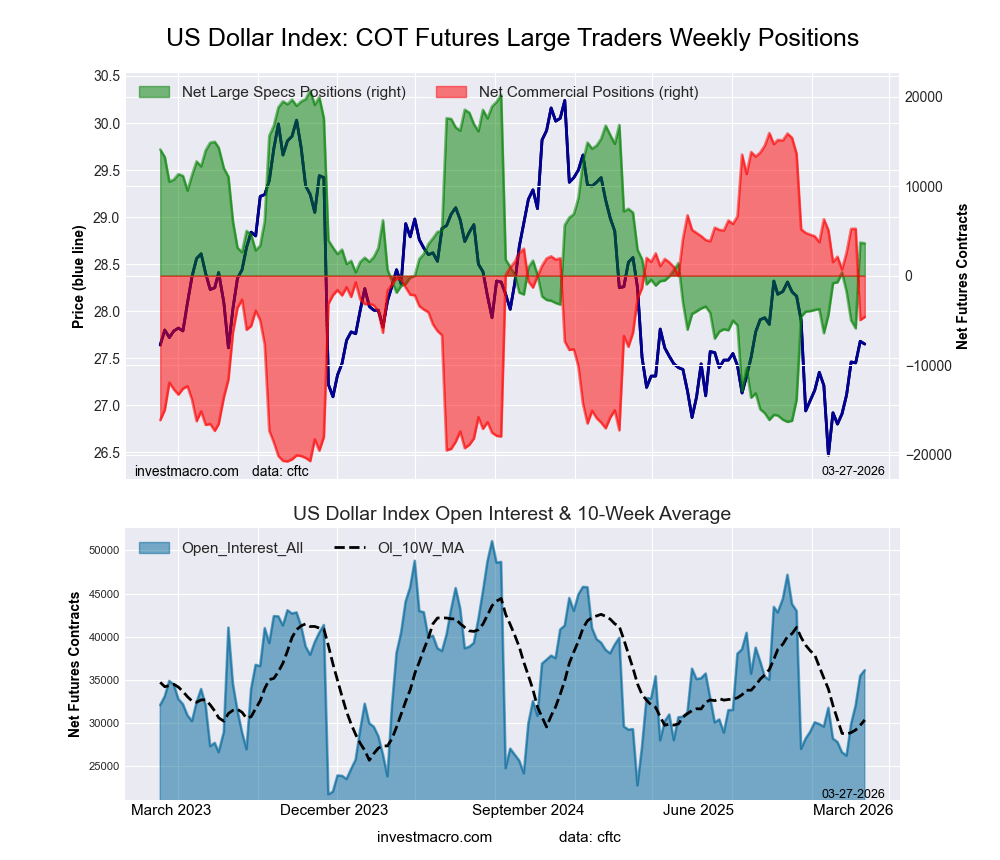 The US Dollar Index large speculator standing this week came in at a net position of 3,617 contracts in the data reported through Tuesday. This was a weekly reduction of -76 contracts from the previous week which had a total of 3,693 net contracts.
This week’s current strength score (the trader positioning range over the past three years, measured from 0 to 100) shows the speculators are currently Bullish with a score of 53.9 percent. The commercials are Bearish with a score of 44.0 percent and the small traders (not shown in chart) are Bullish with a score of 56.4 percent.
Price Trend-Following Model: Weak Downtrend
Our weekly trend-following model classifies the current market price position as: Weak Downtrend.
| US DOLLAR INDEX Statistics | SPECULATORS | COMMERCIALS | SMALL TRADERS |
| – Percent of Open Interest Longs: | 56.6 | 29.5 | 8.0 |
| – Percent of Open Interest Shorts: | 46.6 | 42.3 | 5.3 |
| – Net Position: | 3,617 | -4,615 | 998 |
| – Gross Longs: | 20,457 | 10,652 | 2,903 |
| – Gross Shorts: | 16,840 | 15,267 | 1,905 |
| – Long to Short Ratio: | 1.2 to 1 | 0.7 to 1 | 1.5 to 1 |
| NET POSITION TREND: | | | |
| – Strength Index Score (3 Year Range Pct): | 53.9 | 44.0 | 56.4 |
| – Strength Index Reading (3 Year Range): | Bullish | Bearish | Bullish |
| NET POSITION MOVEMENT INDEX: | | | |
| – 6-Week Change in Strength Index: | 11.7 | -18.3 | 41.7 |
Euro Currency Futures:
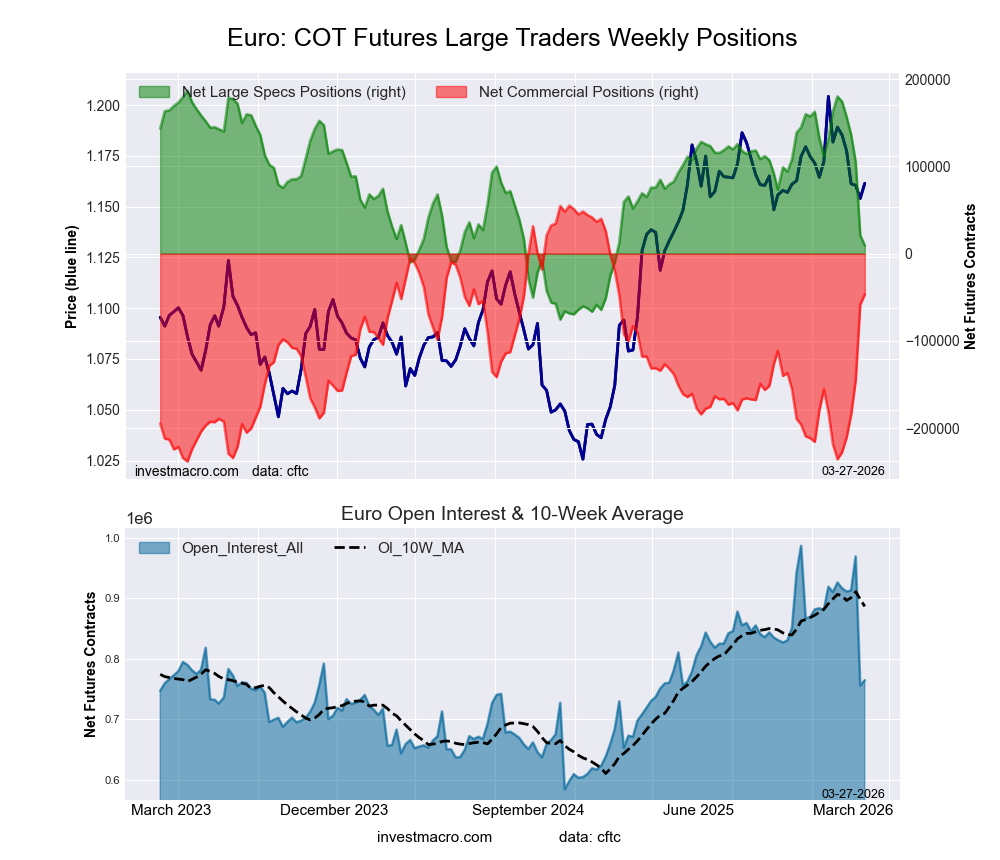 The Euro Currency large speculator standing this week came in at a net position of 9,279 contracts in the data reported through Tuesday. This was a weekly lowering of -11,853 contracts from the previous week which had a total of 21,132 net contracts.
This week’s current strength score (the trader positioning range over the past three years, measured from 0 to 100) shows the speculators are currently Bearish with a score of 32.3 percent. The commercials are Bullish with a score of 65.3 percent and the small traders (not shown in chart) are Bullish with a score of 53.6 percent.
Price Trend-Following Model: Weak Uptrend
Our weekly trend-following model classifies the current market price position as: Weak Uptrend.
| EURO Currency Statistics | SPECULATORS | COMMERCIALS | SMALL TRADERS |
| – Percent of Open Interest Longs: | 26.2 | 58.1 | 11.1 |
| – Percent of Open Interest Shorts: | 24.9 | 64.2 | 6.2 |
| – Net Position: | 9,279 | -46,758 | 37,479 |
| – Gross Longs: | 200,025 | 444,118 | 84,972 |
| – Gross Shorts: | 190,746 | 490,876 | 47,493 |
| – Long to Short Ratio: | 1.0 to 1 | 0.9 to 1 | 1.8 to 1 |
| NET POSITION TREND: | | | |
| – Strength Index Score (3 Year Range Pct): | 32.3 | 65.3 | 53.6 |
| – Strength Index Reading (3 Year Range): | Bearish | Bullish | Bullish |
| NET POSITION MOVEMENT INDEX: | | | |
| – 6-Week Change in Strength Index: | -65.1 | 64.4 | -38.0 |
British Pound Sterling Futures:
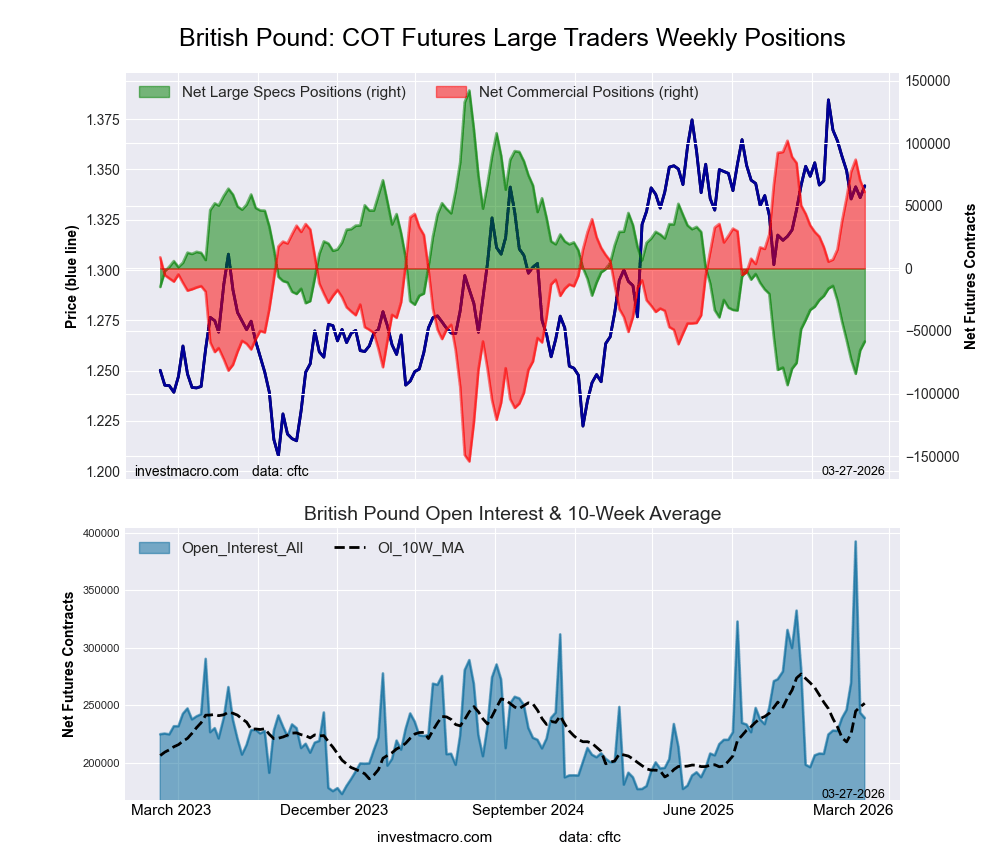 The British Pound Sterling large speculator standing this week came in at a net position of -58,422 contracts in the data reported through Tuesday. This was a weekly boost of 7,093 contracts from the previous week which had a total of -65,515 net contracts.
This week’s current strength score (the trader positioning range over the past three years, measured from 0 to 100) shows the speculators are currently Bearish-Extreme with a score of 14.8 percent. The commercials are Bullish-Extreme with a score of 84.1 percent and the small traders (not shown in chart) are Bearish with a score of 46.1 percent.
Price Trend-Following Model: Weak Uptrend
Our weekly trend-following model classifies the current market price position as: Weak Uptrend.
| BRITISH POUND Statistics | SPECULATORS | COMMERCIALS | SMALL TRADERS |
| – Percent of Open Interest Longs: | 19.5 | 67.9 | 10.8 |
| – Percent of Open Interest Shorts: | 43.9 | 42.3 | 11.9 |
| – Net Position: | -58,422 | 61,187 | -2,765 |
| – Gross Longs: | 46,459 | 162,128 | 25,772 |
| – Gross Shorts: | 104,881 | 100,941 | 28,537 |
| – Long to Short Ratio: | 0.4 to 1 | 1.6 to 1 | 0.9 to 1 |
| NET POSITION TREND: | | | |
| – Strength Index Score (3 Year Range Pct): | 14.8 | 84.1 | 46.1 |
| – Strength Index Reading (3 Year Range): | Bearish-Extreme | Bullish-Extreme | Bearish |
| NET POSITION MOVEMENT INDEX: | | | |
| – 6-Week Change in Strength Index: | -13.9 | 18.0 | -35.0 |
Japanese Yen Futures:
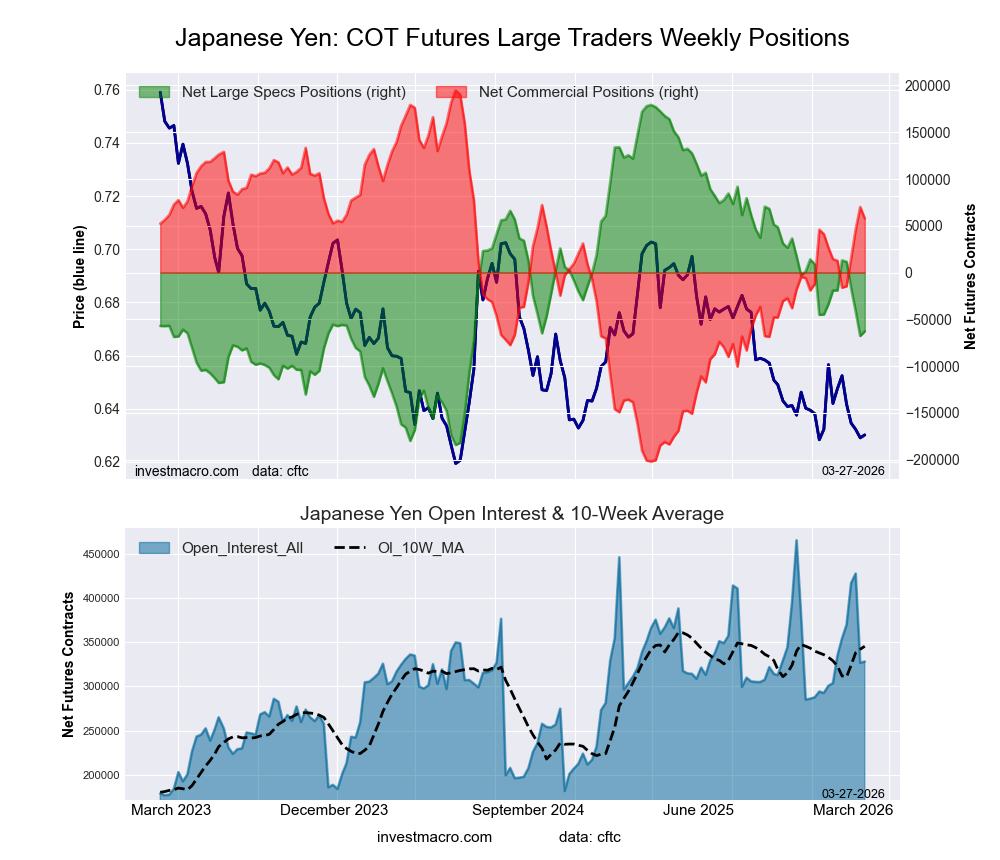 The Japanese Yen large speculator standing this week came in at a net position of -62,806 contracts in the data reported through Tuesday. This was a weekly lift of 4,974 contracts from the previous week which had a total of -67,780 net contracts.
This week’s current strength score (the trader positioning range over the past three years, measured from 0 to 100) shows the speculators are currently Bearish with a score of 33.4 percent. The commercials are Bullish with a score of 65.5 percent and the small traders (not shown in chart) are Bearish with a score of 49.4 percent.
Price Trend-Following Model: Strong Downtrend
Our weekly trend-following model classifies the current market price position as: Strong Downtrend.
| JAPANESE YEN Statistics | SPECULATORS | COMMERCIALS | SMALL TRADERS |
| – Percent of Open Interest Longs: | 29.9 | 51.0 | 12.6 |
| – Percent of Open Interest Shorts: | 49.1 | 33.4 | 11.1 |
| – Net Position: | -62,806 | 57,901 | 4,905 |
| – Gross Longs: | 98,271 | 167,443 | 41,460 |
| – Gross Shorts: | 161,077 | 109,542 | 36,555 |
| – Long to Short Ratio: | 0.6 to 1 | 1.5 to 1 | 1.1 to 1 |
| NET POSITION TREND: | | | |
| – Strength Index Score (3 Year Range Pct): | 33.4 | 65.5 | 49.4 |
| – Strength Index Reading (3 Year Range): | Bearish | Bullish | Bearish |
| NET POSITION MOVEMENT INDEX: | | | |
| – 6-Week Change in Strength Index: | -12.0 | 11.4 | -3.9 |
Swiss Franc Futures:
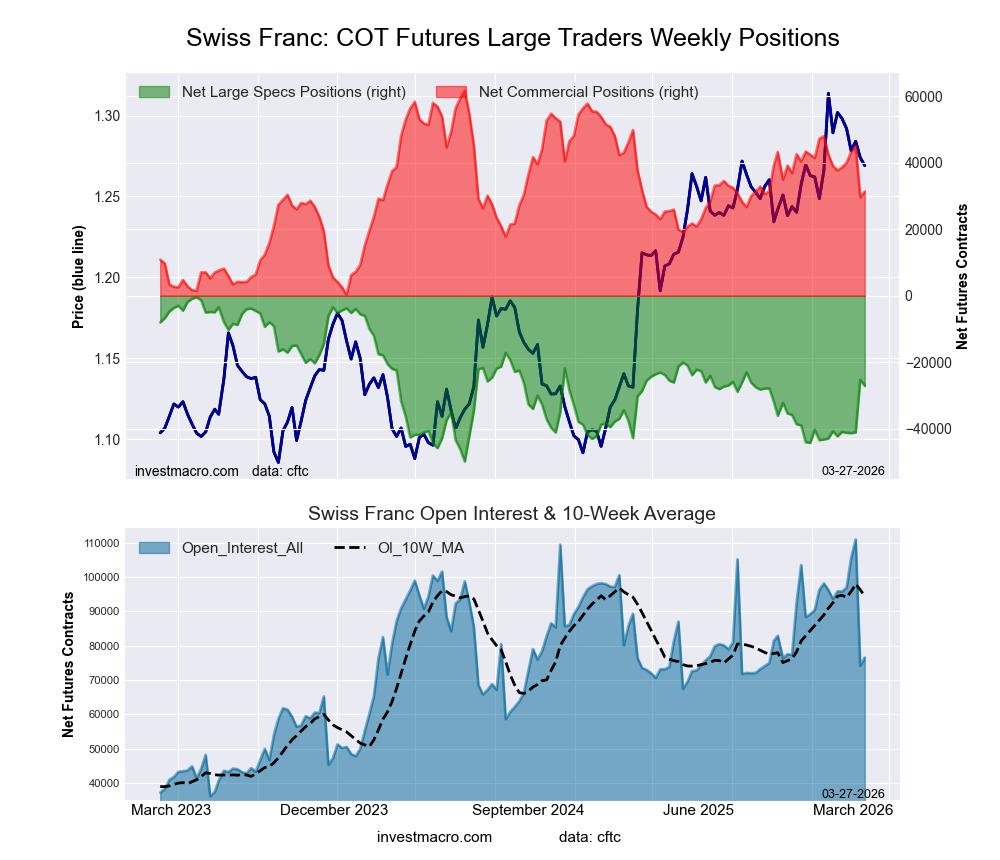 The Swiss Franc large speculator standing this week came in at a net position of -27,097 contracts in the data reported through Tuesday. This was a weekly decline of -1,884 contracts from the previous week which had a total of -25,213 net contracts.
This week’s current strength score (the trader positioning range over the past three years, measured from 0 to 100) shows the speculators are currently Bearish with a score of 46.0 percent. The commercials are Bullish with a score of 50.6 percent and the small traders (not shown in chart) are Bullish with a score of 60.7 percent.
Price Trend-Following Model: Weak Uptrend
Our weekly trend-following model classifies the current market price position as: Weak Uptrend.
| SWISS FRANC Statistics | SPECULATORS | COMMERCIALS | SMALL TRADERS |
| – Percent of Open Interest Longs: | 10.2 | 72.6 | 16.5 |
| – Percent of Open Interest Shorts: | 45.6 | 31.6 | 22.1 |
| – Net Position: | -27,097 | 31,364 | -4,267 |
| – Gross Longs: | 7,831 | 55,554 | 12,634 |
| – Gross Shorts: | 34,928 | 24,190 | 16,901 |
| – Long to Short Ratio: | 0.2 to 1 | 2.3 to 1 | 0.7 to 1 |
| NET POSITION TREND: | | | |
| – Strength Index Score (3 Year Range Pct): | 46.0 | 50.6 | 60.7 |
| – Strength Index Reading (3 Year Range): | Bearish | Bullish | Bullish |
| NET POSITION MOVEMENT INDEX: | | | |
| – 6-Week Change in Strength Index: | 30.7 | -10.3 | -37.5 |
Canadian Dollar Futures:
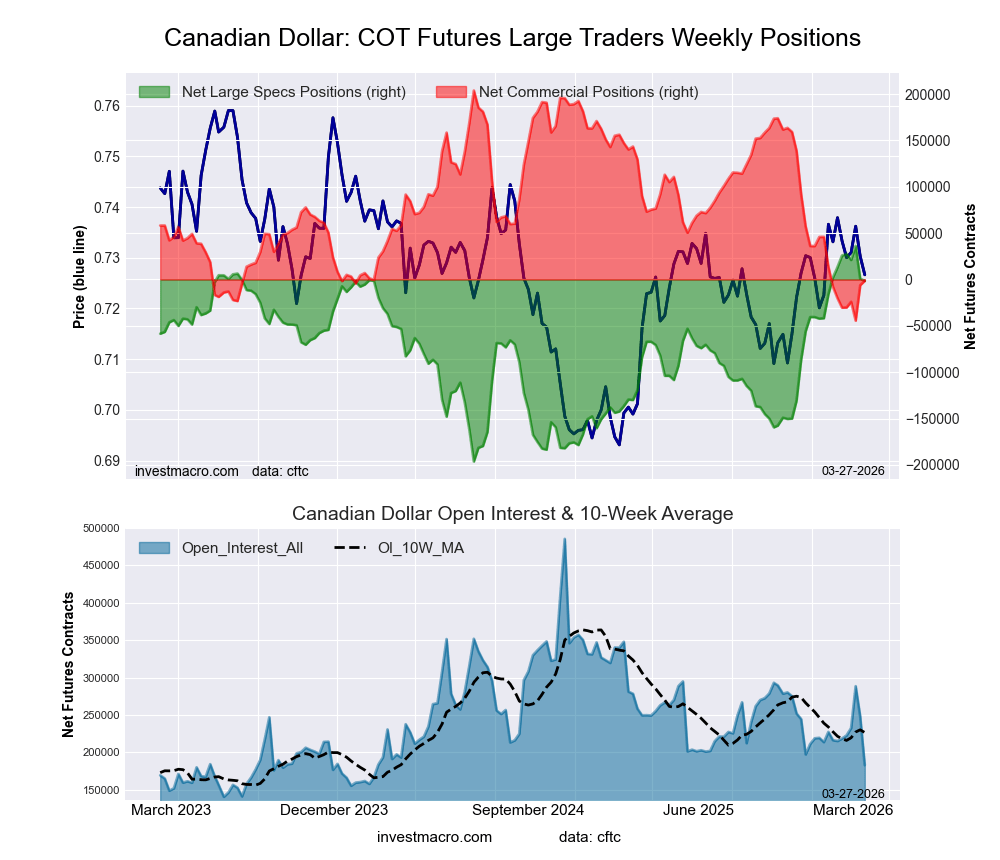 The Canadian Dollar large speculator standing this week came in at a net position of -1,602 contracts in the data reported through Tuesday. This was a weekly decrease of -2,488 contracts from the previous week which had a total of 886 net contracts.
This week’s current strength score (the trader positioning range over the past three years, measured from 0 to 100) shows the speculators are currently Bullish-Extreme with a score of 83.8 percent. The commercials are Bearish-Extreme with a score of 17.3 percent and the small traders (not shown in chart) are Bullish with a score of 53.6 percent.
Price Trend-Following Model: Weak Uptrend
Our weekly trend-following model classifies the current market price position as: Weak Uptrend.
| CANADIAN DOLLAR Statistics | SPECULATORS | COMMERCIALS | SMALL TRADERS |
| – Percent of Open Interest Longs: | 34.1 | 44.2 | 17.3 |
| – Percent of Open Interest Shorts: | 35.0 | 44.9 | 15.7 |
| – Net Position: | -1,602 | -1,371 | 2,973 |
| – Gross Longs: | 62,382 | 80,788 | 31,593 |
| – Gross Shorts: | 63,984 | 82,159 | 28,620 |
| – Long to Short Ratio: | 1.0 to 1 | 1.0 to 1 | 1.1 to 1 |
| NET POSITION TREND: | | | |
| – Strength Index Score (3 Year Range Pct): | 83.8 | 17.3 | 53.6 |
| – Strength Index Reading (3 Year Range): | Bullish-Extreme | Bearish-Extreme | Bullish |
| NET POSITION MOVEMENT INDEX: | | | |
| – 6-Week Change in Strength Index: | -6.4 | 7.6 | -11.0 |
Australian Dollar Futures:
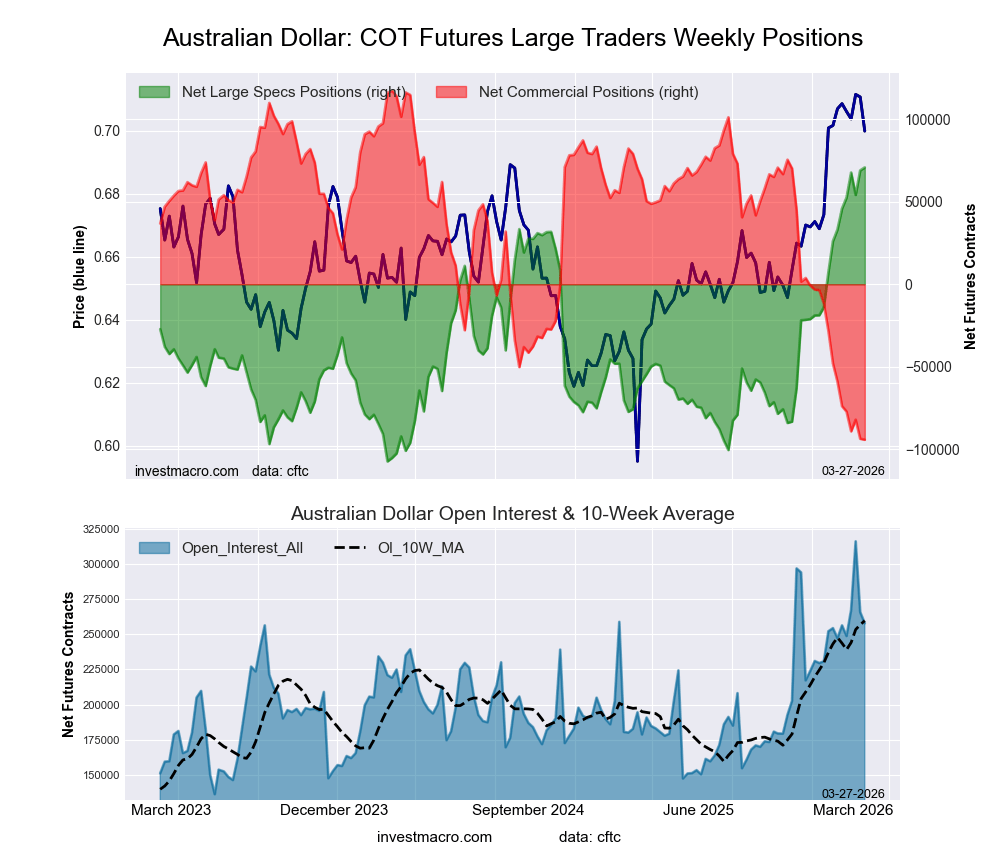 The Australian Dollar large speculator standing this week came in at a net position of 70,872 contracts in the data reported through Tuesday. This was a weekly gain of 1,811 contracts from the previous week which had a total of 69,061 net contracts.
This week’s current strength score (the trader positioning range over the past three years, measured from 0 to 100) shows the speculators are currently Bullish-Extreme with a score of 100.0 percent. The commercials are Bearish-Extreme with a score of 0.0 percent and the small traders (not shown in chart) are Bullish-Extreme with a score of 90.2 percent.
Price Trend-Following Model: Uptrend
Our weekly trend-following model classifies the current market price position as: Uptrend.
| AUSTRALIAN DOLLAR Statistics | SPECULATORS | COMMERCIALS | SMALL TRADERS |
| – Percent of Open Interest Longs: | 51.5 | 31.1 | 15.5 |
| – Percent of Open Interest Shorts: | 24.0 | 67.7 | 6.4 |
| – Net Position: | 70,872 | -94,367 | 23,495 |
| – Gross Longs: | 132,629 | 80,063 | 39,940 |
| – Gross Shorts: | 61,757 | 174,430 | 16,445 |
| – Long to Short Ratio: | 2.1 to 1 | 0.5 to 1 | 2.4 to 1 |
| NET POSITION TREND: | | | |
| – Strength Index Score (3 Year Range Pct): | 100.0 | 0.0 | 90.2 |
| – Strength Index Reading (3 Year Range): | Bullish-Extreme | Bearish-Extreme | Bullish-Extreme |
| NET POSITION MOVEMENT INDEX: | | | |
| – 6-Week Change in Strength Index: | 21.1 | -16.6 | -5.2 |
New Zealand Dollar Futures:
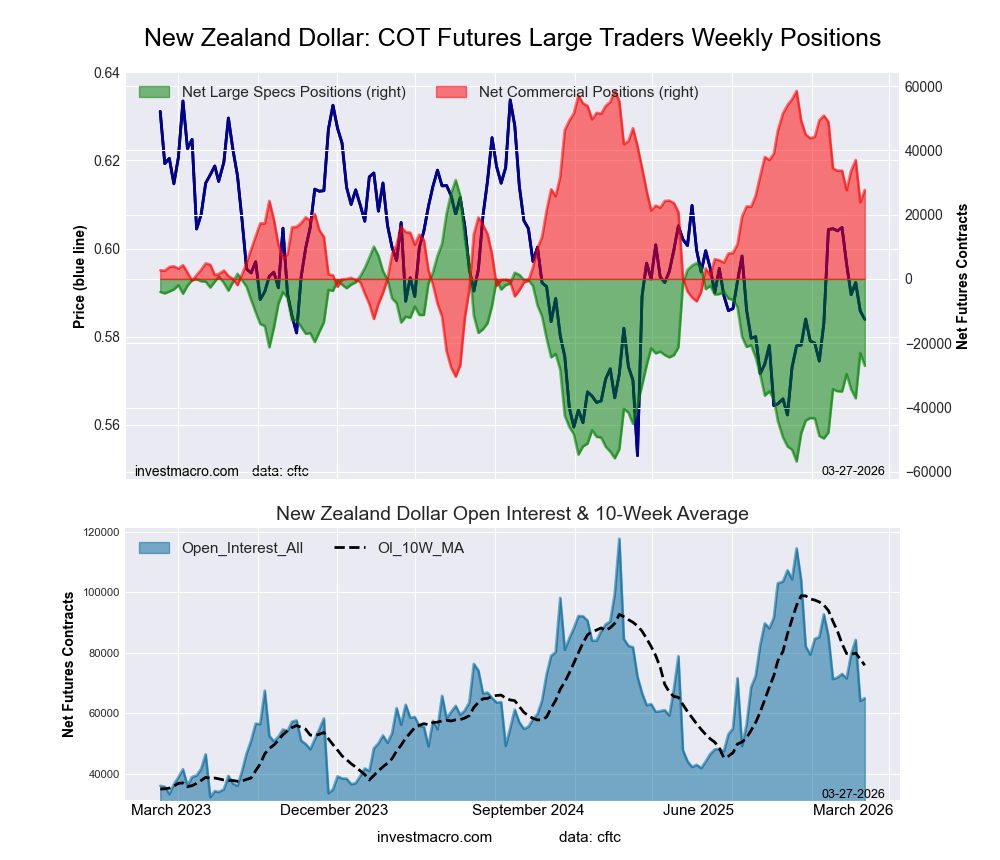 The New Zealand Dollar large speculator standing this week came in at a net position of -27,006 contracts in the data reported through Tuesday. This was a weekly reduction of -3,949 contracts from the previous week which had a total of -23,057 net contracts.
This week’s current strength score (the trader positioning range over the past three years, measured from 0 to 100) shows the speculators are currently Bearish with a score of 34.0 percent. The commercials are Bullish with a score of 65.3 percent and the small traders (not shown in chart) are Bearish with a score of 43.4 percent.
Price Trend-Following Model: Weak Uptrend
Our weekly trend-following model classifies the current market price position as: Weak Uptrend.
| NEW ZEALAND DOLLAR Statistics | SPECULATORS | COMMERCIALS | SMALL TRADERS |
| – Percent of Open Interest Longs: | 16.7 | 77.5 | 5.2 |
| – Percent of Open Interest Shorts: | 58.2 | 34.9 | 6.3 |
| – Net Position: | -27,006 | 27,694 | -688 |
| – Gross Longs: | 10,847 | 50,393 | 3,403 |
| – Gross Shorts: | 37,853 | 22,699 | 4,091 |
| – Long to Short Ratio: | 0.3 to 1 | 2.2 to 1 | 0.8 to 1 |
| NET POSITION TREND: | | | |
| – Strength Index Score (3 Year Range Pct): | 34.0 | 65.3 | 43.4 |
| – Strength Index Reading (3 Year Range): | Bearish | Bullish | Bearish |
| NET POSITION MOVEMENT INDEX: | | | |
| – 6-Week Change in Strength Index: | 9.0 | -6.7 | -25.0 |
Mexican Peso Futures:
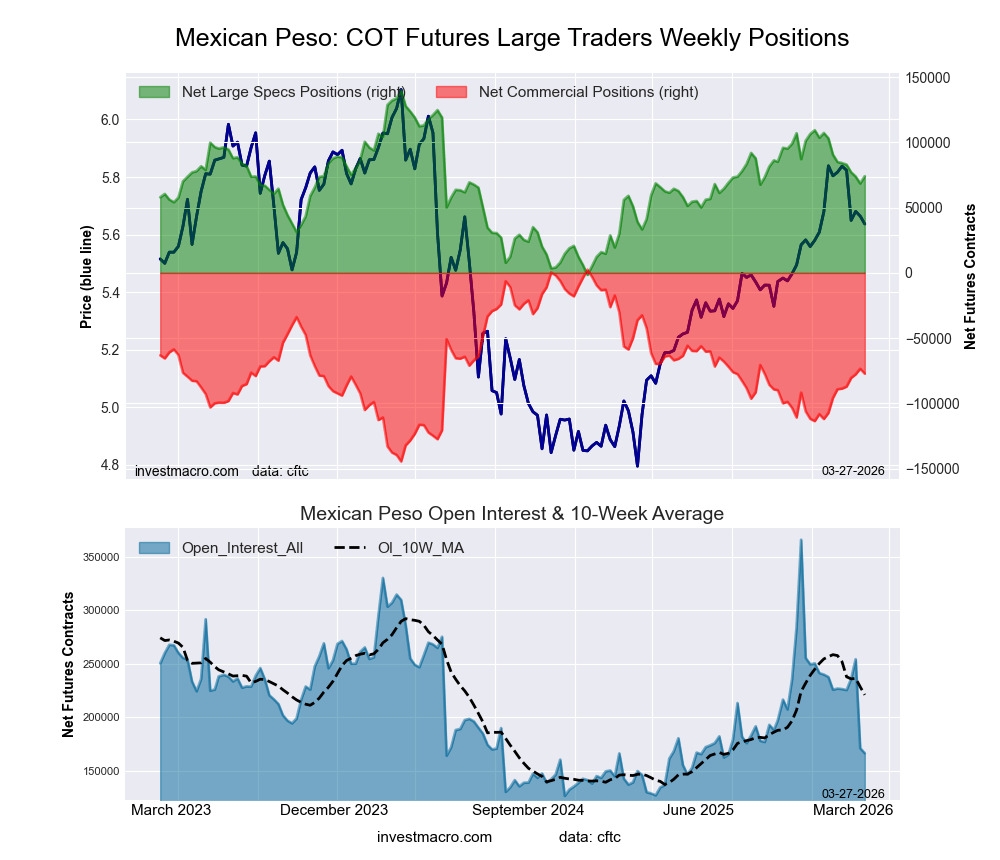 The Mexican Peso large speculator standing this week came in at a net position of 74,076 contracts in the data reported through Tuesday. This was a weekly lift of 5,616 contracts from the previous week which had a total of 68,460 net contracts.
This week’s current strength score (the trader positioning range over the past three years, measured from 0 to 100) shows the speculators are currently Bullish with a score of 53.5 percent. The commercials are Bearish with a score of 45.8 percent and the small traders (not shown in chart) are Bearish with a score of 40.3 percent.
Price Trend-Following Model: Weak Uptrend
Our weekly trend-following model classifies the current market price position as: Weak Uptrend.
| MEXICAN PESO Statistics | SPECULATORS | COMMERCIALS | SMALL TRADERS |
| – Percent of Open Interest Longs: | 55.3 | 40.7 | 3.5 |
| – Percent of Open Interest Shorts: | 10.9 | 87.0 | 1.6 |
| – Net Position: | 74,076 | -77,232 | 3,156 |
| – Gross Longs: | 92,246 | 67,758 | 5,899 |
| – Gross Shorts: | 18,170 | 144,990 | 2,743 |
| – Long to Short Ratio: | 5.1 to 1 | 0.5 to 1 | 2.2 to 1 |
| NET POSITION TREND: | | | |
| – Strength Index Score (3 Year Range Pct): | 53.5 | 45.8 | 40.3 |
| – Strength Index Reading (3 Year Range): | Bullish | Bearish | Bearish |
| NET POSITION MOVEMENT INDEX: | | | |
| – 6-Week Change in Strength Index: | -7.7 | 8.1 | -5.7 |
Brazilian Real Futures:
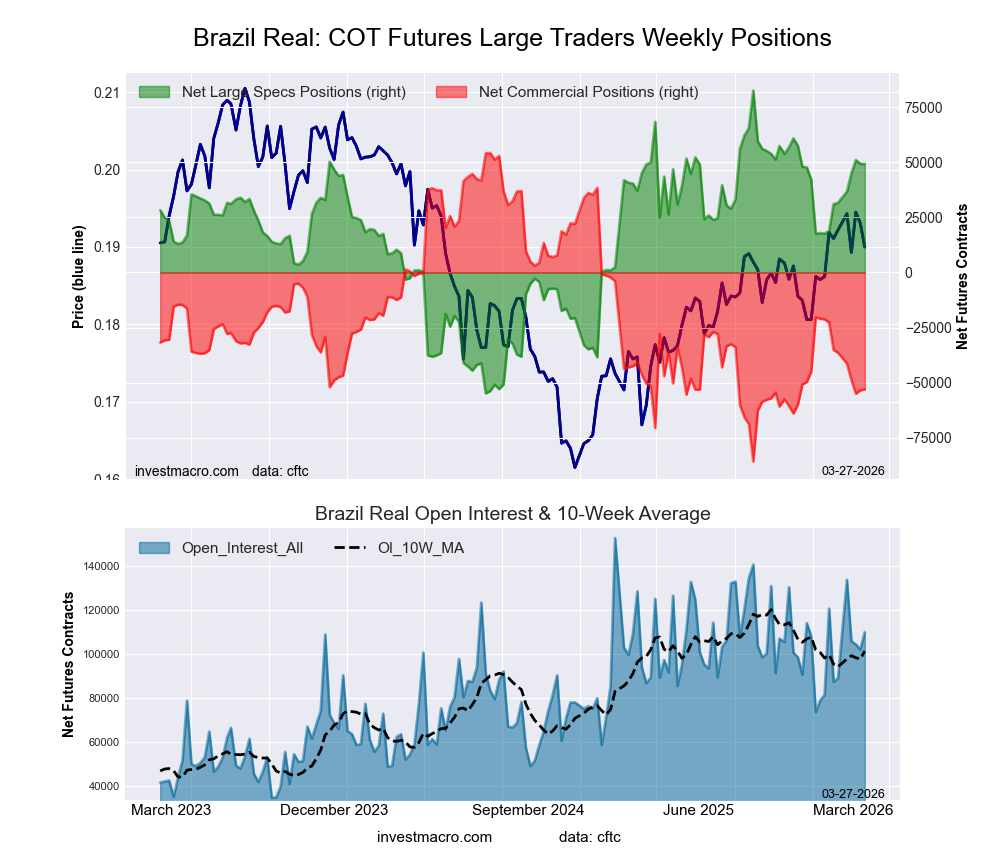 The Brazilian Real large speculator standing this week came in at a net position of 49,248 contracts in the data reported through Tuesday. This was a weekly reduction of -69 contracts from the previous week which had a total of 49,317 net contracts.
This week’s current strength score (the trader positioning range over the past three years, measured from 0 to 100) shows the speculators are currently Bullish with a score of 75.8 percent. The commercials are Bearish with a score of 23.4 percent and the small traders (not shown in chart) are Bearish with a score of 42.4 percent.
Price Trend-Following Model: Uptrend
Our weekly trend-following model classifies the current market price position as: Uptrend.
| BRAZIL REAL Statistics | SPECULATORS | COMMERCIALS | SMALL TRADERS |
| – Percent of Open Interest Longs: | 68.6 | 21.5 | 4.3 |
| – Percent of Open Interest Shorts: | 23.8 | 69.8 | 0.9 |
| – Net Position: | 49,248 | -53,067 | 3,819 |
| – Gross Longs: | 75,354 | 23,593 | 4,777 |
| – Gross Shorts: | 26,106 | 76,660 | 958 |
| – Long to Short Ratio: | 2.9 to 1 | 0.3 to 1 | 5.0 to 1 |
| NET POSITION TREND: | | | |
| – Strength Index Score (3 Year Range Pct): | 75.8 | 23.4 | 42.4 |
| – Strength Index Reading (3 Year Range): | Bullish | Bearish | Bearish |
| NET POSITION MOVEMENT INDEX: | | | |
| – 6-Week Change in Strength Index: | 12.8 | -11.9 | -5.7 |
Bitcoin Futures:
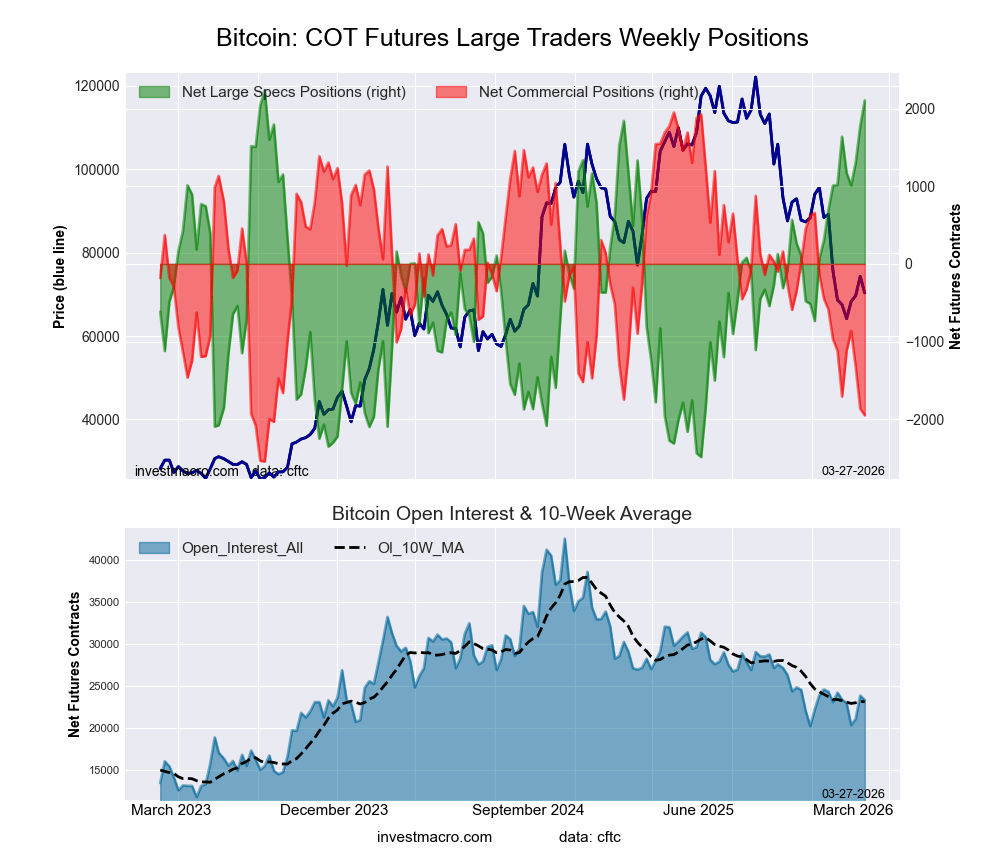 The Bitcoin large speculator standing this week came in at a net position of 2,106 contracts in the data reported through Tuesday. This was a weekly gain of 333 contracts from the previous week which had a total of 1,773 net contracts.
This week’s current strength score (the trader positioning range over the past three years, measured from 0 to 100) shows the speculators are currently Bullish-Extreme with a score of 97.3 percent. The commercials are Bearish-Extreme with a score of 13.2 percent and the small traders (not shown in chart) are Bearish with a score of 29.2 percent.
Price Trend-Following Model: Downtrend
Our weekly trend-following model classifies the current market price position as: Downtrend.
| BITCOIN Statistics | SPECULATORS | COMMERCIALS | SMALL TRADERS |
| – Percent of Open Interest Longs: | 68.2 | 1.0 | 4.7 |
| – Percent of Open Interest Shorts: | 59.1 | 9.3 | 5.4 |
| – Net Position: | 2,106 | -1,949 | -157 |
| – Gross Longs: | 15,861 | 224 | 1,097 |
| – Gross Shorts: | 13,755 | 2,173 | 1,254 |
| – Long to Short Ratio: | 1.2 to 1 | 0.1 to 1 | 0.9 to 1 |
| NET POSITION TREND: | | | |
| – Strength Index Score (3 Year Range Pct): | 97.3 | 13.2 | 29.2 |
| – Strength Index Reading (3 Year Range): | Bullish-Extreme | Bearish-Extreme | Bearish |
| NET POSITION MOVEMENT INDEX: | | | |
| – 6-Week Change in Strength Index: | 23.1 | -18.5 | -13.3 |
Article By InvestMacro – Receive our weekly COT Newsletter
*COT Report: The COT data, released weekly to the public each Friday, is updated through the most recent Tuesday (data is 3 days old) and shows a quick view of how large speculators or non-commercials (for-profit traders) were positioned in the futures markets.
The CFTC categorizes trader positions according to commercial hedgers (traders who use futures contracts for hedging as part of the business), non-commercials (large traders who speculate to realize trading profits) and nonreportable traders (usually small traders/speculators) as well as their open interest (contracts open in the market at time of reporting). See CFTC criteria here.