At the close of the stock market yesterday, the Dow Jones Index (US30) was up by 0.04%, while the S&P 500 Index (US500) was down by 0.07% on Thursday. The NASDAQ Technology Index (US100) closed around its opening price.
The US Consumer Price Index for December rose to 3.4% y/y from 3.1% y/y in November, beating expectations of 3.2% y/y. The core CPI for December declined to 3.9% y/y from 4.0% y/y in November, the lowest reading in 2 years, but above expectations of 3.8% y/y. US weekly initial jobless claims unexpectedly fell by 1,000 to a 2.5-month low of 202,000, indicating a stronger labor market than expectations of a rise to 210,000. Markets are discounting the odds of a 25 bps rate cut to 3% at the next FOMC meeting on January 30-31 and 70% for the same 25 bps rate cut at the March 19-20 meeting.
Today is the start of the Q4 2023 reporting season in the US. The banking sector will start reporting traditionally.
Equity markets in Europe were mostly declining yesterday. Germany’s DAX (DE40) fell by 0.86%, France’s CAC 40 (FR40) lost 0.52% on Thursday, Spain’s IBEX 35 (ES35) was down by 0.62%, and the UK’s FTSE 100 (UK100) closed negative by 0.98%.
ECB Governing Council representative Vujcic said yesterday that December Eurozone inflation was within expectations, and he favors a quarter-point cut in interest rates.
The UK economy grew slightly stronger than expected in November. UK Gross Domestic Product rose by 0.3% in November after falling 0.3% a month earlier. However, weakness in previous months leaves a high risk of sliding into recession, which could be a blow for Prime Minister Rishi Sunak ahead of elections expected in 2024.
Heightened geopolitical risks in the Middle East sent crude oil (WTI) prices up more than 3% after Iran seized an oil tanker off the coast of Oman. The increase in hostile incidents in the Red Sea against commercial shipping is a favorable factor for oil prices. Today, the United States and Britain launched air and sea strikes against Houthi military installations in Yemen in response to the movement’s attacks on ships in the Red Sea.
Natural gas (XNG) prices rose moderately on Thursday after weekly natural gas inventories fell more than expected, according to the EIA. EIA said natural gas inventories fell by 140 billion cubic feet last week, more than the 121 billion cubic feet expected
Asian markets were mostly up yesterday. Japan’s Nikkei 225 (JP225) gained 1.77% for the day, China’s FTSE China A50 (CHA50) rose by 0.27%, Hong Kong’s Hang Seng (HK50) ended the day up by 1.27%, and Australia’s ASX 200 (AU200) ended the trading day positive by 0.80%. Japan’s Nikkei index extended its impressive gains this year, jumping 1.5% to another 34-year high on Friday.
China’s inflation data showed that the country’s economic recovery remained weak in December, with the consumer price index falling by 0.3% y/y. However, separate trade data showed exports grew faster than expected last month, and imports returned to growth.
S&P 500 (US500) 4,780.24 −3.21 (−0.07%)
Dow Jones (US30) 37,711.02 +15.29 (+0.04%)
DAX (DE40) 16,547.03 −142.78 (−0.86%)
FTSE 100 (UK100) 7,576.59 −75.17 (−0.98%)
USD Index 102.25 −0.04 (−0.04%)
News feed for 2024.01.12:
– China Consumer Price Index (m/m) at 03:30 (GMT+2);
– China Producer Price Index (m/m) at 03:30 (GMT+2);
– China Trade Balance (m/m) at 05:00 (GMT+2);
– UK GDP (m/m) at 09:00 (GMT+2);
– UK Industrial Production (m/m) at 09:00 (GMT+2);
– UK Manufacturing Production (m/m) at 09:00 (GMT+2);
This article reflects a personal opinion and should not be interpreted as an investment advice, and/or offer, and/or a persistent request for carrying out financial transactions, and/or a guarantee, and/or a forecast of future events.
Speeches from central bank officials also in focus
Major breakout could be on horizon
First points of interest at 1.10 and 1.09
The EURUSD could be pumped with fresh life next week due to key economic data, speeches from central bank officials and threat of a partial US government shutdown.
Monday, 15th January
CNH: China medium-term lending facility rate
CAD: Canada existing home sales
EUR: Eurozone industrial production, Germany 2023 GDP report
World Economic Forum in Davos
US markets closed – Martin Luther King Jr. holiday
Tuesday, 16th January
EUR: Germany CPI, ZEW survey expectations
GBP: UK jobless claims, unemployment
CAD: Canada CPI, housing starts
USD: US Empire Manufacturing, Fed Governor Christopher Waller speech
WSt30_m: Goldman Sachs earnings
Wednesday, 17th January
CNH: China GDP, retail sales and industrial production
EUR: Eurozone CPI, ECB President Christine Lagarde speech – Davos
GBP: UK CPI
USD: US retail sales, industrial production, Fed Beige book, New York Fed President John Williams speech
Thursday, 18th January
AUD: Australia unemployment
NZD: New Zealand food prices
EUR: ECB minutes, ECB President Christine Lagarde speech – Davos
JPY: Japan core machine orders, industrial production
USD: US housing starts, initial jobless claims, Atlanta Fed President Raphael Bostic speech
Friday, 19th January
CAD: Canada retail sales
JPY: Japan CPI, tertiary index
EUR: ECB President Christine Lagarde speech – Davos
USD: University of Michigan consumer sentiment, San Francisco Fed President Mary Daly speech
Deadline for avoiding partial US government shutdown
It has felt like the same old story for the EURUSD since the start of the new year with prices swinging within a range on the daily charts.
Given the exceptional list of major risk events over the coming week, a significant move could be around the corner…
Here are 4 factors to keep an eye on:
EU data dump + ECB President speech
It’s a week packed with crucial European economic reports that may influence expectations around when the European Central Bank (ECB) will cut interest rates this year.
Data from Germany, Europe’s largest economy will be under the spotlight with much focus on the 2023 growth figures, CPI and ZEW survey expectations. This will be complemented by the ECB meeting minutes for December’s meeting which will be scrutinized for fresh clues on the ECB’s next move. But the main course will be Christine Lagarde’s remarks during the World Economic Forum.
Traders are currently pricing in a 40% probability of a 25-basis point ECB rate cut by March 2024, with a move fully priced in for April.
The euro may weaken if overall economic data disappoints and Lagarde strikes a dovish tone in Davos – sending the EURUSD lower as a result.
Should overall economic data beat forecasts and Lagarde pushes back against rate cut bets, the euro could rise – elevating the EURUSD.
Key US data + Fed speeches
A barrage of top-tier US economic data has the potential to rock the dollar, impacting the EURUSD as a result.
Investors will be paying close attention to the latest retail sales figures, manufacturing data and consumer sentiment to gauge the health of the US economy. Speeches from a host of Fed officials will be added to the mix, coupled with the beige book which could impact speculation around when US rates will be cut this year.
The latest hotter than expected US inflation report has slightly dented expectations around when the Fed will cut rates, but traders still see a 76% probability of a cut in March.
Stronger-than-expected data and hawkish remarks by Fed officials may boost the dollar as rate cut bets decline. This may pull the EURUSD lower.
Should overall US economic data disappoint, and Fed officials sound dovish, the dollar may weaken – pushing the EURUSD higher.
Possible partial government shutdown
The United States is facing a partial government shutdown deadline set to expire on January 19th.
Sentiment towards the US economy could take a hit, especially if a full shutdown happens beyond the February 2nd deadline. Given how this development is likely to influence the USD, its impact will most likely be seen on the EURUSD.
Technical forces
The EURUSD is respecting a bullish channel on the daily timeframe with a “golden cross” technical pattern in play. However, prices remain trapped within a 100-pip range with minor support at 1.1000 and resistance at 1.0900.
A strong breakout and daily close above 1.1000 could trigger a move towards the monthly resistance around 1.1100 and 1.1230 – a level not seen since mid-July 2023.
Should prices slip back below 1.0900, this could open a path back toward the 200-day SMA at 1.0840 and 1.0756.
At yesterday’s stock market close, the Dow Jones Index (US30) was up by 0.45%, while the S&P 500 (US500) added 0.57% on Wednesday. The NASDAQ Technology Index (US100) closed positive by 0.75%.
Today, the US will release its monthly consumer price index (CPI) report. The overall CPI is expected to rise from 3.1% to 3.2% year-over-year. At the same time, core CPI, which excludes volatile food and energy prices, will decline from 4% y/y to 3.8% y/y. Lower inflation will increase the likelihood that the Fed will cut interest rates as early as March. In such a scenario, the US dollar will be under pressure, which will give confidence to risky assets (EUR, GBP) as well as indices.
On the contrary, rising inflation will reduce the probability of a rate cut this spring and reduce the number of basis points of rate cuts throughout the year. In such a scenario, the US dollar would gain support, while risk assets, gold, and stock indices would come under pressure. If the data turns out to be mixed (overall inflation rises and core inflation falls), it will only lead to a spike in volatility and will not bring more specificity to the US Fed’s plans. But given that the probability of a rate cut in March fell from 99% to 70% in one week and the fact that the latest US jobs report showed a resilient labor market, a mixed inflation report would be more likely to benefit the US dollar.
The Canadian dollar has been falling steadily against the US dollar over the past few weeks on the back of hawkish statements from Fed Chairman Jerome Powell, as well as a significant drop in global crude oil prices. With oil now finding some support and OPEC+ potentially announcing an extension of voluntary production cuts into next year, the Canadian dollar could strengthen against the US dollar in the short term. However, upcoming US CPI data will be crucial for Fed guidance and could prompt Fed officials to be more hawkish if inflation exceeds expectations.
Equity markets in Europe traded flat yesterday. Germany’s DAX (DE40) added 0.01%, France’s CAC 40 (FR40) fell by 0.01% on Wednesday, Spain’s IBEX 35 (ES35) rose by 0.07%, and the UK’s FTSE 100 (UK100) closed negative by 0.42%.
ECB Executive Board spokesman Schnabel said yesterday that it is too early to discuss rate cuts, and the ECB will keep key rates at restrictive levels until it is confident that inflation will steadily return to the 2% target. For this, additional data confirming the disinflationary process is needed. For his part, ECB Vice President Gindos said that the eurozone may have been in a recession late last year, and incoming data suggest that the future remains uncertain and the outlook is tilted to the downside. Swaps estimate the odds of a 25 bps ECB rate cut at 3% at the next meeting on January 25 and 37% at the March 7 meeting.
Crude oil prices initially jumped on Wednesday after Houthi rebels carried out one of the largest missile and drone attacks on commercial shipping lanes in the Red Sea, potentially disrupting global crude supplies. But crude prices fell in the afternoon after the EIA’s weekly crude stockpile data unexpectedly rose, and gasoline and distillate inventories rose more than expected, pointing to weak energy demand.
Asian markets traded mostly lower yesterday. Japan’s Nikkei 225 (JP225) gained 2.01% for the day, China’s FTSE China A50 (CHA50) fell by 0.30%, Hong Kong’s Hang Seng (HK50) ended the day down by 0.57%, and Australia’s ASX 200 (AU200) ended the trading day negative by 0.69%.
Japan’s Nikkei 225 (JP225) continues to rally after hitting a 34-year-high yesterday. The index rallied on broad-based gains, although technology and auto stocks were the most active. The recent rally in Japanese stocks has been driven mainly by expectations that the Bank of Japan will maintain its ultra-low policy in the near term, especially amid efforts to stimulate the economy following the devastating earthquake in central Japan. Thanks to the Bank of Japan’s soft policy, the Nikkei has become one of the best-performing global equity indices in 2023, jumping 30% year-on-year.
S&P 500 (US500) 4,783.45 +26.95 (+0.57%)
Dow Jones (US30) 37,695.73 +170.57 (+0.45%)
DAX (DE40) 16,689.81 +1.45 (+0.01%)
FTSE 100 (UK100) 7,651.76 −32.20 (−0.42%)
USD Index 102.39 −0.18 (−0.18%)
News feed for 2024.01.11:
– Australia Trade Balance (m/m) at 02:30 (GMT+2);
– US Initial Jobless Claims (w/w) at 15:30 (GMT+2);
This article reflects a personal opinion and should not be interpreted as an investment advice, and/or offer, and/or a persistent request for carrying out financial transactions, and/or a guarantee, and/or a forecast of future events.
Gold prices were steady on Thursday ahead of a key US inflation report that may influence market expectations around when the Federal Reserve will cut interest rates this year.
The precious metal is busy with a correction wave in an uptrend on the weekly timeframe which could act as a possible area of trendline support. Looking at the daily charts, a downtrend is advancing but the price is getting closer to a weekly support level and a higher bottom might already be in progress.
A significant move could be around the corner with the incoming US CPI report acting as a fundamental catalyst. More evidence of cooling price pressures may boost bets around the Fed cutting interest rates, supporting gold prices as a result. However, a hot reading could dampen hopes around the Fed taking action early this year – potentially dealing a blow to zero-yielding gold.
Redirecting our attention back to the technical…
A look at the 4-hour time frame will yield more insight.
The 4-hour chart is still in negative territory with the price dipped below the 50 Exponential Moving Average. The market structure has given a warning though by making a higher bottom and traders will be watching closely to see how the market reacts to the upcoming CPI news event. If buying pressure increases and the price goes above 2042.09, a long opportunity will be on the books.
Attaching a modified Fibonacci tool to the trigger level at 2042.09 and dragging it to the higher bottom at 2020.31, four possible targets can be determined:
The first target is at 2050.80 (Target 1).
The second price target is likely to be 2055.16 (Target 2).
The third price target is possible at 2063.87 (Target 3.
The fourth and last price target is viable at 2074.76 (Target 4) if the buy pressure can continue for long enough.
If the price at 2020.31 is broken, this scenario is no longer valid.
After 13-year-old Willis Gibson became the first human to beat the original Nintendo version of Tetris, he dedicated his special win to his father, who passed away in December 2023.
The Oklahoma teen beat the game by defeating level after level until he reached the “kill screen” – that is, the moment when the Tetris artificial intelligence taps out in exhaustion, stopping play because its designers never wrote the code to advance further. Before Gibson, the only other player to overcome the game’s AI was another AI.
For any parent who has despaired over their children sinking countless hours into video games, Gibson’s victory over the cruel geometry of Tetris stands as a bracing corrective.
Despite the stereotypes, most gamers are anything but lazy. And they’re anything but mindless.
The world’s top players can sometimes serve as reminders of the best in us, with memorable achievements that range from the heroic to the inscrutably weird.
The perfect run
“Speedrunning” is a popular gaming subculture in which players meticulously optimize routes and exploit glitches to complete, in a matter of minutes, games that normally take hours, from the tightly constrained, run-and-gun action game Cuphead to the sprawling role-playing epic Baldur’s Gate 3.
In top-level competition, speedrunners strive to match the time of what’s referred to as a “TAS,” or “tool-assisted speed run.” To figure out the TAS time, players use game emulators to choreograph a theoretically perfect playthrough, advancing the game one frame at a time to determine the fastest possible time.
Success requires punishing precision, flawless execution and years of training.
The major speedrunning milestones are, like Olympic races, marked by mere fractions of a second. The urge to speedrun likely sprouts from an innate human longing for perfection – and a uniquely 21st century compulsion to best the robots.
A Twitch streamer who goes by the username Niftski is currently the human who has come closest to achieving this androidlike perfection. His 4-minute, 54.631-second world-record speedrun of Super Mario Bros. – achieved in September 2023 – is just 0.35 seconds shy of a flawless TAS.
Watching Niftski’s now-famous run is a dissonant experience. Goofy, retro, 8-bit Mario jumps imperturbably over goombas and koopa troopas with the iconic, cheerful “boink” sound of his hop.
Meanwhile, Niftski pants as his anxiety builds, his heart rate – tracked on screen during the livestream – peaking at 188 beats per minute.
When Mario bounces over the final big turtle at the finish line – “boink” – Niftski erupts into screams of shock and repeated cries of “Oh my God!”
He hyperventilates, struggles for oxygen and finally sobs from exhaustion and joy.
Twitch streamer Niftski’s record speedrun of Super Mario Bros. missed perfection by 0.35 seconds.
The largest world and its longest pig ride
This list couldn’t be complete without an achievement from Minecraft, the revolutionary video game that has become the second-best-selling title in history, with over 300 million copies sold – second only to Tetris’ 520 million units.
Minecraft populates the video game libraries of grade-schoolers and has been used as an educational tool in university classrooms. Even the British Museum has held an exhibition devoted to the game.
Minecraft is known as a sandbox game, which means that gamers can create and explore their own virtual worlds, limited only by their imagination and a few simple tools and resources – like buckets and sand, or, in the case of Minecraft, pickaxes and stone.
So what can you do in the Minecraft playground?
Well, you can ride on a pig. The Guinness Book of World Records marks the farthest distance at 414 miles. Or you can collect sunflowers. The world record for that is 89 in one minute. Or you can dig a tunnel – but you’ll need to make it 100,001 blocks long to edge out the current record.
My personal favorite is a collective, ongoing effort: a sprawling, global collaboration to recreate the world on a 1:1 scale using Minecraft blocks, with blocks counting as one cubic meter.
At their best, sandbox games like Minecraft can bring people closer to the joyful and healthily pointless play of childhood – a restorative escape from the anxious, utility-driven planning that dominates so much of adulthood.
Popular YouTuber MrBeast contributes to ‘Build the Earth’ by constructing a Minecraft replica of Raleigh, N.C.
The galaxy’s greatest collaboration
The Halo 3 gaming community participated in a bloodier version of the collective effort of Minecraft players.
The game, which pits humans against an alien alliance known as the Covenant, was released in 2007 to much fanfare.
Whether they were playing the single-player campaign mode or the online multiplayer mode, gamers around the world started seeing themselves as imaginary participants in a global cause to save humanity – in what came to be known as the “Great War.”
They organized round-the-clock campaign shifts, while sharing strategies in nearly 6,000 Halo wiki articles and 21 million online discussion posts.
Halo developer Bungie started tracking total alien deaths by all players, with the 10 billion milestone reached in April 2009.
Game designer Jane McGonigal recalls with awe the community effort that went into that Great War, citing it as a transcendent example of the fundamental human desire to work together and to become a part of something bigger than the self.
Bungie maintained a collective history of the Great War in the form of “personal service records” that memorialized each player’s contributions – medals, battle statistics, campaign maps and more.
The archive beggars comprehension: According to Bungie, its servers handled 1.4 petabytes of data requests by players in one nine-month stretch. McGonigal notes, by way of comparison, that everything ever written by humans in all of recorded history amounts to 50 petabytes of data.
Gamification versus gameful design
If you’re mystified by the behavior of these gamers, you’re not alone.
Over the past decade, researchers across a range of fields have marveled at the dedication of gamers like Gibson and Niftski, who commit themselves without complaint to what some might see as punishing, pointless and physically grueling labor.
How could this level of dedication be applied to more “productive” endeavors, they wondered, like education, taxes or exercise?
From this research, an industry centered on the “gamification” of work, life and learning emerged. It giddily promised to change people’s behaviors through the use of extrinsic motivators borrowed from the gaming community: badges, achievements, community scorekeeping.
Many game designers have reacted to this trend like Robert Oppenheimer at the close of the eponymous movie – aghast that their beautiful work was used, for instance, to pressure Disneyland Resort laborers to load laundry and press linens at anxiously hectic speeds.
Arguing that the gamification trend misses entirely the magic of gaming, game designers have instead started promoting the concept of “gameful design.” Where gamification focuses on useful outcomes, gameful design focuses on fulfilling experiences.
Gameful design prioritizes intrinsic motivation over extrinsic incentives. It embraces design elements that promote social connection, creativity, a sense of autonomy – and, ultimately, the sheer joy of mastery.
When I think of Niftski’s meltdown after his record speedrun – and Gibson’s, who also began hyperventilating in shock and almost passed out – I think of my own children.
I wish for them such moments of ecstatic, prideful accomplishment in a world that sometimes seems starved of joy.
At the close of the stock market yesterday, the Dow Jones Index (US30) decreased by 0.42%, while the S&P 500 Index (US500) was down by 0.15% on Tuesday. The NASDAQ Technology Index (US100) closed positive by 0.09%.
Lower expectations for a Fed interest rate cut in March weighed on equities as swap markets show that the probability of a 25 bps Fed rate cut at the March 19-20 FOMC meeting fell to 67% from the 100% probability last month.
The US trade deficit unexpectedly narrowed to negative $63.2 billion in November from $64.5 billion in October, which was better than expectations of an increase to negative $64.9 billion and a positive for Q4 GDP. The reduction of the deficit is a positive factor for the strengthening of the national currency.
In November 2023, Canada recorded a trade surplus of CAD 1.6 billion, down significantly from a surplus of CAD 3.2 billion in the previous month and below market expectations of CAD 2 billion. The surplus was driven by a 1.9% increase in imports to CAD 64.2 billion.
Equity markets in Europe were mostly down yesterday. Germany’s DAX (DE40) was down by 0.17%, France’s CAC 40 (FR 40) fell by 0.32% on Tuesday, Spain’s IBEX 35 (ES35) lost 1.46%, and the UK’s FTSE 100 (UK100) closed negative by 0.13%.
The Eurozone unemployment rate for November unexpectedly fell to a record low of 6.4%, indicating a stronger labor market. German industrial production for November unexpectedly declined by 0.7% m/m, weaker than expectations of 0.3% m/m. Industrial production declined for the sixth consecutive month. ECB Governing Council representative Centeno said yesterday that good news on Eurozone inflation allows the ECB to cut interest rates sooner than expected.
According to the World Bank, the global economy is experiencing its worst growth rate in 30 years. Global economic growth is projected to slow for the third consecutive year in 2024, falling to 2.4% from 2.6% in 2023, according to the latest World Economic Outlook report released on Tuesday. It also points out that escalating conflicts (Russian invasion of Ukraine, conflict in the Middle East) could have significant implications for energy prices, which could affect both inflation and economic growth.
Asian markets traded yesterday without any unified dynamics. Japan’s Nikkei 225 (JP225) was up by 1.16% for the day, China’s FTSE China A50 (CHA50) was down by 0.46%, Hong Kong’s Hang Seng (HK50) decreased by 0.21%, and Australia’s ASX 200 (AU200) was positive by 0.93%. Japan’s Nikkei 225 (JP225) jumped to a 34-year high on Wednesday amid growing expectations of a delay in the Bank of Japan’s policy tightening plans.
Japanese household spending fell by 2.9% y/y in November, weaker than expectations of 2.3% y/y and marking the ninth consecutive month of spending declines. Tokyo’s Consumer Price Index for the decade fell to 2.4% y/y from 2.7% y/y in November, better than expectations of 2.5% y/y and the slowest rate of increase in 1.5 years, dovish for BOJ policy.
In Australia, the monthly consumer price index (CPI) came in at 4.3% y/y in November, the slowest pace since January 2022. This is down from October’s 4.9% reading and below market forecasts of 4.4%. If the fourth quarter inflation report due out at the end of January paints a similar picture for consumer prices, markets may move expectations for the first-rate cut by the Reserve Bank of Australia (RBA) in June since August this year.
S&P 500 (US500) 4,756.50 −7.04 (−0.15%)
Dow Jones (US30) 37,525.16 −157.85 (−0.42%)
DAX (DE40) 16,688.36 −28.11 (−0.17%)
FTSE 100 (UK100) 7,683.96 −10.23 (−0.13%)
USD Index 102.53 +0.32 (+0.31%)
News feed for 2024.01.10:
– Australia Consumer Price Index (m/m) at 02:30 (GMT+2);
– UK BoE Gov Bailey Speaks at 16:15 (GMT+2);
– US Crude Oil Reserves (w/w) at 17:30 (GMT+2);
– US FOMC Member Williams Speaks (m/m) at 22:15 (GMT+2).
This article reflects a personal opinion and should not be interpreted as an investment advice, and/or offer, and/or a persistent request for carrying out financial transactions, and/or a guarantee, and/or a forecast of future events.
It has been a choppy affair for oil prices thanks to a combination of fundamental forces.
Earlier in the week, oil bears were in power after Riyadh lowered its official selling prices for oil exports over the weekend. Only for bulls to return amid Middle East supply concerns, a Libyan supply outage, more attacks on vessels in the Red Sea and an industry report showing a bigger-than-expected drawdown in crude inventories.
Prices are currently trapped within a range on the daily charts with support at $75.50 and resistance at $79.00.
The global commodity could be injected with fresh volatility later today due to the incoming Energy Information Agency (EIA) report. A build or drawdown in crude inventories has the potential to trigger a breakout/down opportunity in oil prices.
Looking at the technical picture, the indicators favour more downside with prices respecting a bearish channel.
Zooming out to the weekly charts, we see a similar bearish picture. However, strong support can be found at the 200-week SMA.
Taking a quick look at the monthly charts, prices are approaching a significant support at $71.50. A solid monthly close below this level could signal further downside.
Redirecting our attention back to the daily timeframe, bears need to secure a solid daily close below $75.50 to regain control.
Sustained weakness below $75.50 could encourage a decline back towards $72.50.
Should $75.50 prove to be reliable support, that may push prices back towards $79.00 and $80.70.
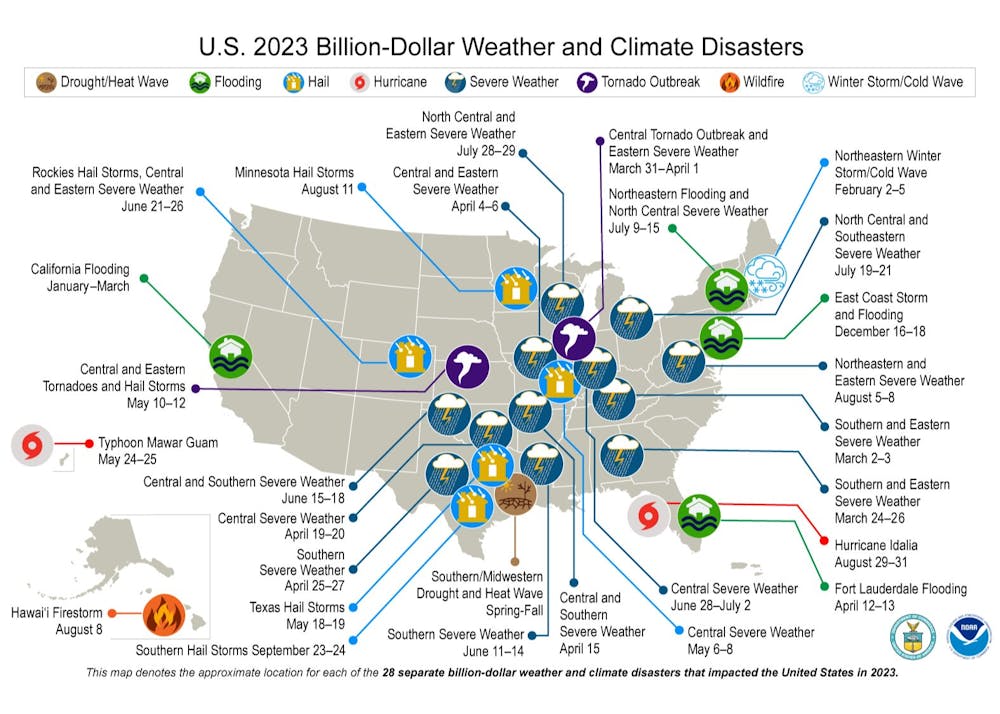
The U.S. set an unwelcome record for weather and climate disasters in 2023, with 28 disasters that exceeded more than US$1 billion in damage each.
While it wasn’t the most expensive year overall – the costliest years included multiple hurricane strikes – it had the highest number of billion-dollar storms, floods, droughts and fires of any year since counting began in 1980, with six more than any other year, accounting for inflation.
2023’s billion-dollar disasters. Click the image to expand. NOAA
The year’s most expensive disaster started with an unprecedented heat wave that sat over Texas for weeks over the summer and then spread into the South and Midwest, helping fuel a destructive drought. The extreme heat and lack of rain dried up fields, forced ranchers to sell off livestock and restricted commerce on the Mississippi River, causing about US$14.5 billion in damage, according to the National Oceanic and Atmospheric Administration’s conservative estimates.
Extreme dryness in Hawaii contributed to another multi-billion-dollar disaster as it fueled devastating wildfires that destroyed Lahaina, Hawaii, in August.
Other billion-dollar disasters included Hurricane Idalia, which hit Florida in August; floods in the Northeast and California; and nearly two dozen other severe storms across the country. States in a swath from Texas to Ohio were hit by multiple billion-dollar storms.
I am an atmospheric scientist who studies the changing climate. Here’s a quick look at what global warming has to do with wildfires, storms and other weather and climate disasters.
Dangerous heat waves and devastating wildfires
When greenhouse gases, such as carbon dioxide from vehicles and power plants, accumulate in the atmosphere, they act like a thermal blanket that warms the planet.
These gases let in high-energy solar radiation while absorbing outgoing low-energy radiation in the form of heat from the Earth. The energy imbalance at the Earth’s surface gradually increases the surface temperature of the land and oceans.
How the greenhouse effect functions.
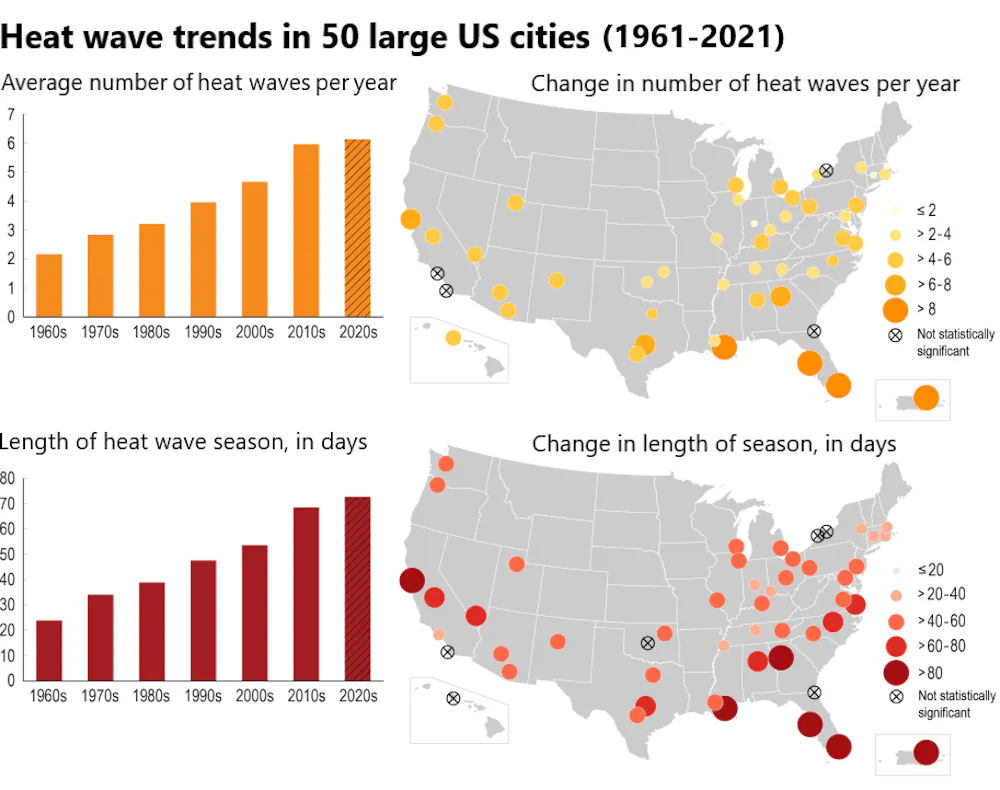
The most direct consequence of this warming is more days with abnormally high temperatures, as large parts of the country saw in 2023.
Phoenix went 30 days with daily high temperatures at 110 F (43.3 C) or higher and recorded its highest minimum nighttime temperature, with temperatures on July 19 never falling below 97 F (36.1 C).
Although heat waves result from weather fluctuations, global warming has raised the baseline, making heat waves more frequent, more intense and longer-lasting.
Increased evaporation removes more moisture from the ground, drying out soil, grasses and other organic material, which creates favorable conditions for wildfires. All it takes is a lightning strike or spark from a power line to start a blaze.
How global warming fuels extreme storms
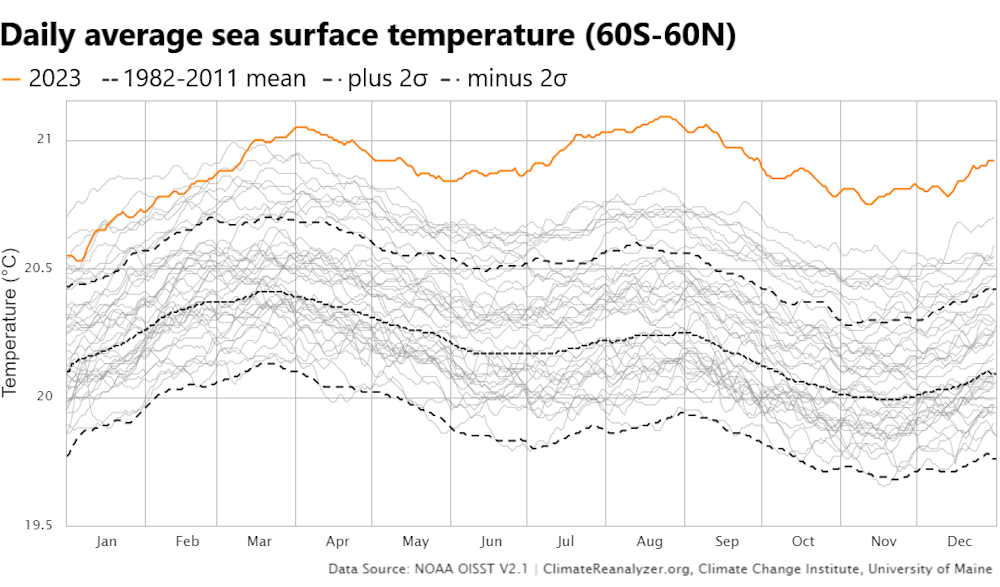
As more heat is stored as energy in the atmosphere and oceans, it doesn’t just increase the temperature – it can also increase the amount of water vapor in the atmosphere.
When that water vapor condenses to liquid and falls as rain, it releases a large amount of energy. This is called latent heat, and it is the main fuel for all storm systems. When temperatures are higher and the atmosphere has more moisture, that additional energy can fuel stronger, longer-lasting storms.
Tropical storms are similarly fueled by latent heat coming from warm ocean water. That is why they only form when the sea surface temperature reaches a critical level of around 80 F (27 C).
It might seem counterintuitive, but global warming can also contribute to cold snaps in the U.S. That’s because it alters the general circulation of Earth’s atmosphere.
The Earth’s atmosphere is constantly moving in large-scale circulation patterns in the forms of near-surface wind belts, such as the trade winds, and upper-level jet streams. These patterns are caused by the temperature difference between the polar and equatorial regions.
As the Earth warms, the polar regions are heating up more than twice as fast as the equator. This can shift weather patterns, leading to extreme events in unexpected places. Anyone who has experienced a “polar vortex event” knows how it feels when the jet stream dips southward, bringing frigid Arctic air and winter storms, despite the generally warmer winters.
In sum, a warmer world is a more violent world, with the additional heat fueling increasingly more extreme weather events.
At the stock market close yesterday, the Dow Jones Index (US30) was up by 0.58%, while the S&P 500 Index (US500) added 1.41% on Monday. The NASDAQ Technology Index (US100) closed positive by 2.20% yesterday. Nvidia stock’s (NVDA) rise to a record high led to gains in technology stocks, which also had a positive impact on the overall market. On Monday, stocks also received support from lower bond yields amid comments from Federal Reserve President of Dallas, Logan, who said that the Fed may slow the pace of its asset portfolio reductions to maintain sufficient liquidity in financial markets.
Atlanta Fed President Bostic said yesterday he is comfortable with the US Fed’s restrictive stance. Bostic wants to see the economy continue to grow and inflation reach our 2% level. He added that he expects the Fed’s first-rate cut in the third quarter of this year.
Nvidia (NVDA) closed at a record high (+6%) after it unveiled new graphics chips at CES with additional components that will allow users to better utilize artificial intelligence on their personal machines without having to rely on remote services available over the internet. Quotes of Advanced Micro Devices (AMD) are up more than 5% after Melius Research LLC upgraded the stock to “buy” from “hold” with a $188 price target. Boeing (BA) stock price fell more than 8%, topping the S&P 500 and Dow Jones Industrials losers list, after the company took its 737 Max 9 jet out of service for inspections after a section of the fuselage of a new Alaska Airlines plane burst during flight. United Airlines said Monday that during inspections, it found loose bolts and other parts on the 737 Max 9’s plug doors.
Equity markets in Europe were mostly up yesterday. Germany’s DAX (DE40) rose by 0.74%, France’s CAC 40 (FR40) gained 0.40% on Monday, Spain’s IBEX 35 (ES35) jumped by 0.44%, and the UK’s FTSE 100 (UK100) closed positive by 0.06%.
ECB Governing Council spokesman Vujcic said yesterday that he expects inflation to slow gradually and that the ECB is not talking about cutting interest rates now and probably won’t do so until the summer.
Eurozone Dec economic confidence indicator rose by 2.4 to an 8-month high of 96.4, exceeding expectations of 94.2. German trade news was better than expected: November exports rose by 3.7% m/m, stronger than expectations of 0.5% m/m and the biggest increase in 2 years. In addition, November imports rose by 1.9% m/m, stronger than expectations of 0.4% m/m and the largest increase in 9 months.
Silver prices came under pressure yesterday after German factory orders rose less than expected, indicating weak demand for industrial metals. Silver is highly correlated to gold, and gold is now under pressure as the US Federal Reserve and ECB do not seem to be planning to cut rates this spring as economists expect.
Crude oil and gasoline prices fell sharply on Monday, with gasoline prices falling to their lowest in 3 weeks. Concerns about worsening global oil demand drove crude prices lower after Saudi Arabia cut the official selling prices of its crude to all buyers. Oil prices also fell on a ShippingWatch report that some shipping companies have struck a deal with Houthi rebels to allow their ships to pass safely through the Red Sea, which could reduce supply disruptions.
Asian markets were mostly down on Monday. Japan’s Nikkei 225 (JP225) gained 0.27% for the day, China’s FTSE China A50 (CHA50) fell by 1.14%, Hong Kong’s Hang Seng (HK50) ended the day down by 1.88%, and Australia’s ASX 200 (AU200) ended the trading day negative by 0.50%.
Chinese authorities said they plan to reduce the amount of money banks must set aside in reserves to stimulate lending. The Central Bank will also strengthen counter-cyclical and inter-cyclical policy adjustments to create a favorable financial environment for the country’s economic growth. Traders are raising bets on further monetary easing this year as a weak economic recovery forces authorities to cut interest rates and provide ample liquidity.
The Bank of Japan (BoJ) said it will cut its monthly purchases of ultra-long government bonds, a reminder that it may still go for a reduction in stimulus to the economy this year. Market bets indicate traders still expect the Bank of Japan to end its negative interest rate policy later this year, although speculation that it will do so this month has largely subsided. Data released on Tuesday showed that consumer price growth in Tokyo slowed for a second month in December, which also eased pressure on the BOJ. Currently, overnight index swaps indicate that the Central Bank will end its negative rate policy in July this year, although as recently as two weeks ago, it was supposed to happen in April.
S&P 500 (US500) 4,763.54 +66.30 (+1.41%)
Dow Jones (US30) 37,683.01 +216.90 (+0.58%)
DAX (DE40) 16,716.47 +122.26 (+0.74%)
FTSE 100 (UK100) 7,694.19 +4.58 (+0.060%)
USD Index 102.24 −0.17 (−0.16%)
News feed for 2024.01.09:
– Japan Tokyo Core CPI (m/m) at 01:30 (GMT+2);
– Australia Retail Sales (m/m) at 02:30 (GMT+2);
– Switzerland Unemployment Rate (m/m) at 08:45 (GMT+2);
– German Industrial Production (m/m) at 09:00 (GMT+2);
– Eurozone Unemployment Rate (m/m) at 12:00 (GMT+2);
This article reflects a personal opinion and should not be interpreted as an investment advice, and/or offer, and/or a persistent request for carrying out financial transactions, and/or a guarantee, and/or a forecast of future events.
USDJPY bounced off the neckline of a daily double-bottom pattern after data showed inflation in Tokyo cooled for a second month in December.
Consumer prices slowed to 2.4% in December from 2.6% in the previous month. The core which excludes fresh food and energy prices cooled to 3.5% – its fourth consecutive month of decline. This data is likely to encourage the BoJ to retain its negative rates this month.
According to Thomas Bulkowski, in his book “Encyclopaedia of Chart Patterns”, this kind of double bottom pattern, (Adam and Adam) has
· A 16% breakeven failure rate.
· A 73% chance of meeting its target.
Worthy of note is the neckline crosses across a confluence of significant support levels which include.
· 143.674: The 200-day Exponential Moving Average (EMA)
· 143.170: The 61.8 golden Fibonacci ratio (with Fibonacci retracement levels drawn from December 19th’s high to December 28th’s low).
At the time of writing USDJPY is bouncing off the 200-day EMA
The next key fundamental driver that may influence the currency pair will be the US Consumer Price Inflation data (CPI) due on Thursday. Headline inflation is expected to have ticked higher in December, while the annual core inflation is seen cooling to 3.8%. More signs of cooling inflationary pressures may stimulate Fed cut bets, weakening the USD as a result. USDJPY may remain range-bound as it waits for an injection of fresh volatility.
Redirecting our attention back to the technical…
If the neckline is not broken, USDJPY may rally for about 280 pips and contend with the following key resistance levels ahead.
· 144.853: A significant level close to the 100 Fibonacci retracement
· 145.477; its 50-day EMA.
However, if the Yen’s strength continues after the latest inflation data from Japan, we may see the confluence of key support levels give way.
The following levels may provide a temporary pause as it aims for new lows below the December 28th low of 140.29.