By InvestMacro
Here are the latest charts and statistics for the Commitment of Traders (COT) reports data published by the Commodities Futures Trading Commission (CFTC).
The latest COT data is updated through Tuesday March 31st and shows a quick view of how large traders (for-profit speculators and commercial entities) were positioned in the futures markets.
Weekly Speculator Changes led by Sugar & Cotton
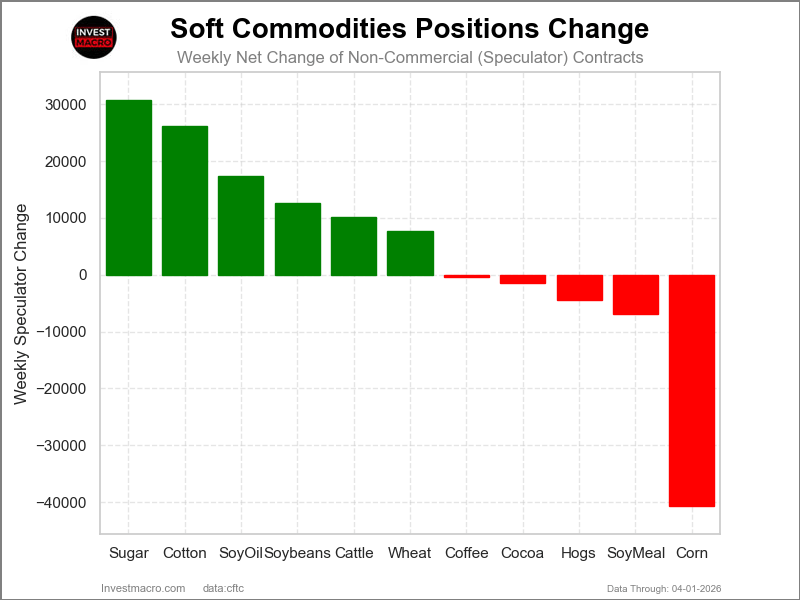
The COT soft commodities markets speculator bets were overall higher this week as six out of the eleven softs markets we cover had higher positioning while the other five markets had lower speculator contracts.
Leading the gains for the softs markets was Sugar (30,687 contracts) with Cotton (26,120 contracts), Soybean Oil (17,422 contracts), Soybeans (12,636 contracts), Live Cattle (10,113 contracts) and Wheat (7,673 contracts) also having positive weeks.
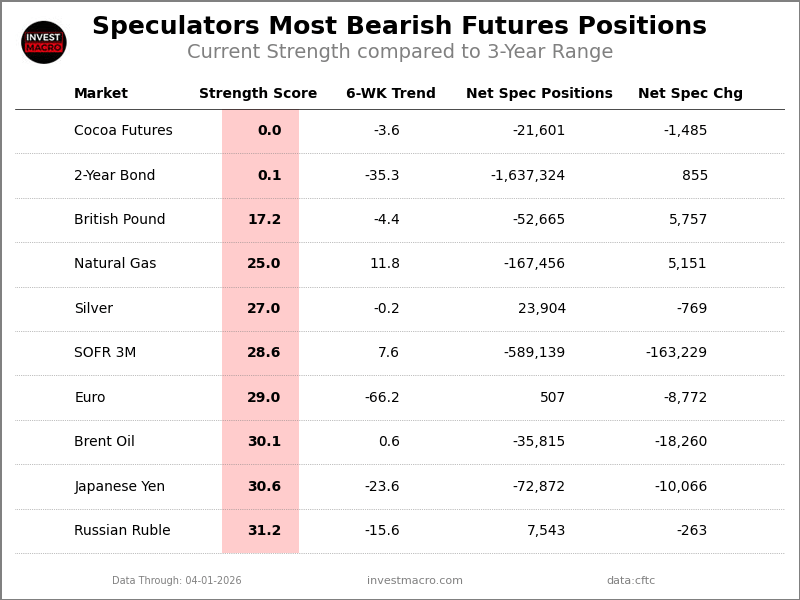
The markets with the declines in speculator bets this week were Corn (-40,603 contracts), Soybean Meal (-6,877 contracts), Lean Hogs (-4,434 contracts), Cocoa (-1,485 contracts) and with Coffee (-368 contracts) also seeing lower bets on the week.
Sugar Bets continue higher, Soybean Oil Bets at 5-Year High
Highlighting the Soft Commodities speculator positions this week was a continued rise in the Sugar net positioning. Large speculator Sugar positions rose by 30,687 contracts this week and follow up last week’s gigantic rise by over 110,000 contracts as well as coming in as the sixth consecutive week where Sugar bets have risen. Over just the last six weeks, speculators have improved the Sugar position by 188,475 net contracts, bringing the overall speculator standing from -253,592 contracts on February 17th to this week’s total of just -65,117 net positions. This is the least bearish level for Sugar dating back to July of last year.
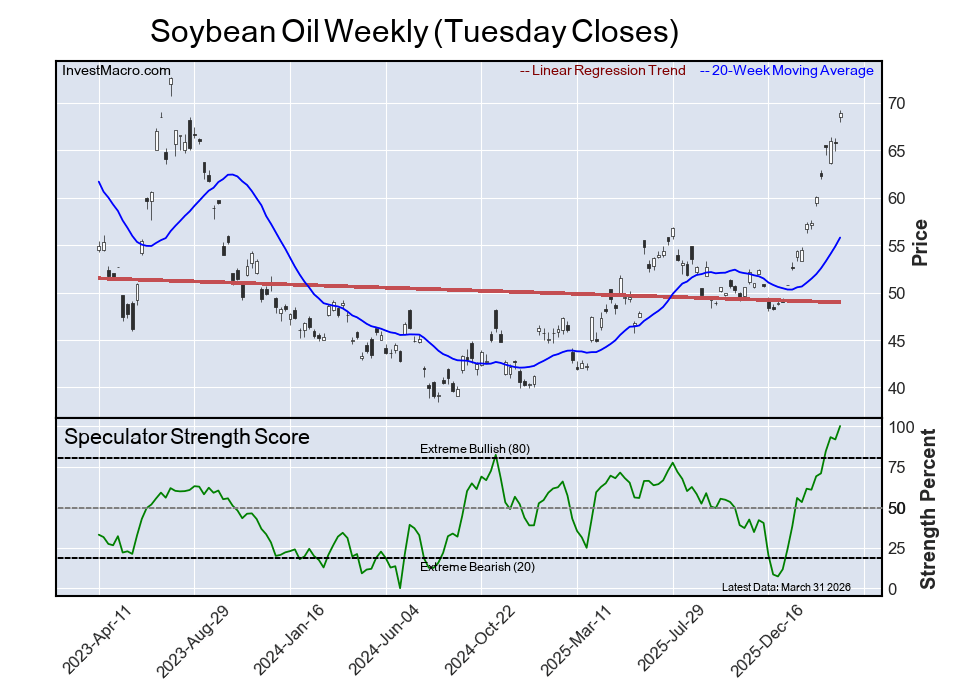
Soybean Oil has also been on the rise and saw a gain of over 17,000 contracts this week. Soybean Oil bets have been higher in 10 out of the last 13 weeks for an almost 195,000 net contract rise over that period. These gains have taken the Soybean Oil speculator position from over -60,000 contracts on December 30th to this week’s total of 134,557 net speculator positions. The Soybean Oil net position standing now sits at the highest level since January 5th of 2021, a span of 273 weeks.
On the opposite end of the speculator spectrum is Cocoa, which continues to see more bearish positions come into its overall standing. Cocoa positions have now fallen for two straight weeks and for four out of the past five weeks. This has brought the overall speculator position in Cocoa to a -21,601 net position which is the most bearish position dating back to 2019.
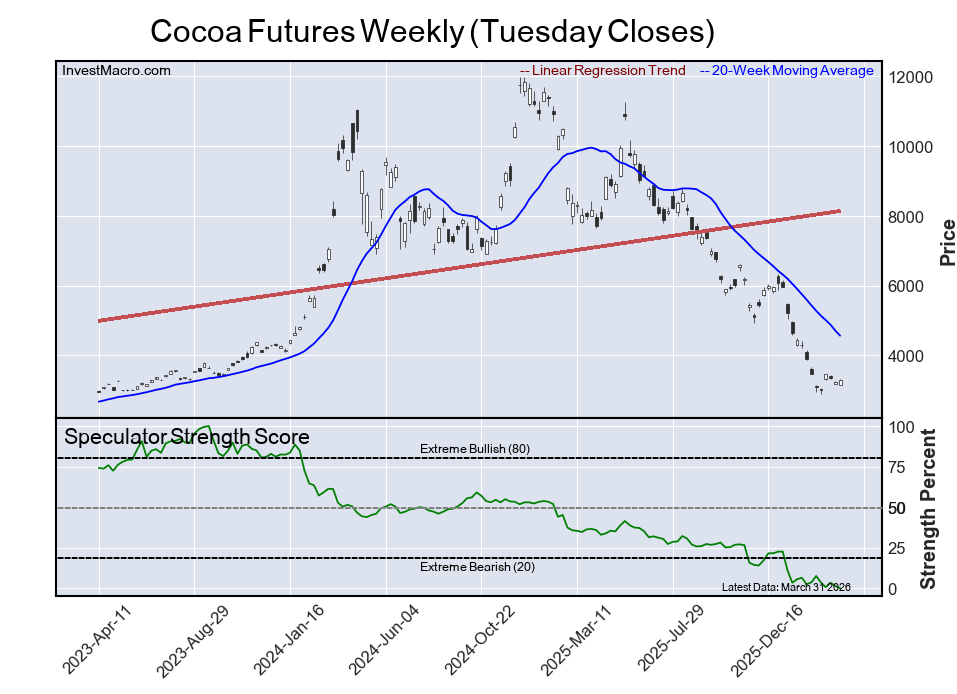
Cocoa prices have made a major U-turn in the past few years with the futures price starting a strong surge higher in early 2023 that saw a parabolic move all the way from approximately $2,500 to over $11,500 in short order. After retreating and consolidating in 2024 to a range between $7,000 to $8,500, we saw another big spike up late in 2024 and into early 2025 that saw prices rise above $12,000. Since then, prices have collapsed lower and have now settled in this week with a close of $3,245. Since the beginning of 2025, prices have fallen over 70% and went on an almost a full round trip from where prices started their climb in 2023.
Live Cattle leads Soft Commodities price performances this week
The Soft Commodities markets were led this week in price performance by Live Cattle, which rose by 4.21% over the past five days. Cocoa came in second with a 2.56% gain, while Soybean Oil was also higher by 2.27%. Cotton also managed to rise more than 2% this week with a 2.10% increase. Soybeans saw a modest rise by 0.37%, while Lean Hogs rounded out the gainers on the week with a 0.17% advance.
Soybean Meal was virtually unchanged with a -0.03% shortfall. Corn fell by over 2% with a -2.11% decline, followed by Wheat which fell by -2.69% on the week. Coffee dropped by -3.98% for the week, while Sugar was the biggest loser on the week with a -5.48% decline.
Soft Commodities Data:
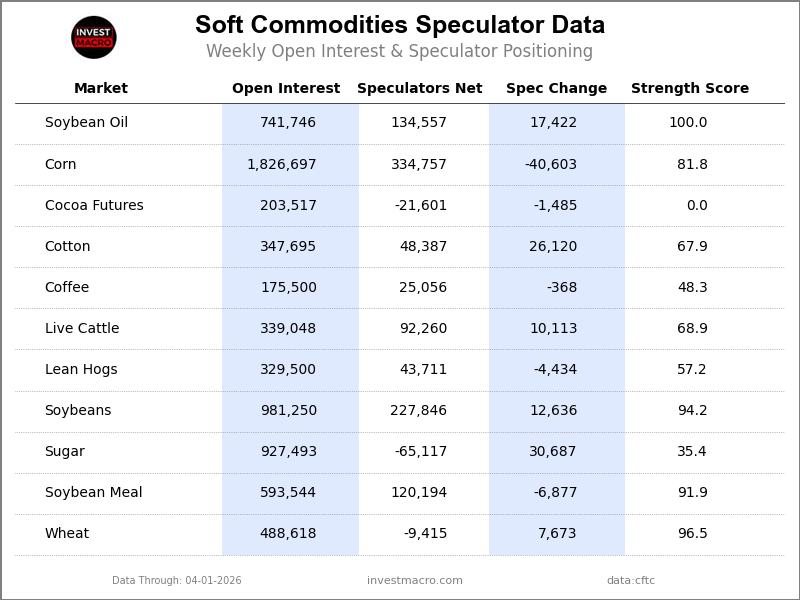
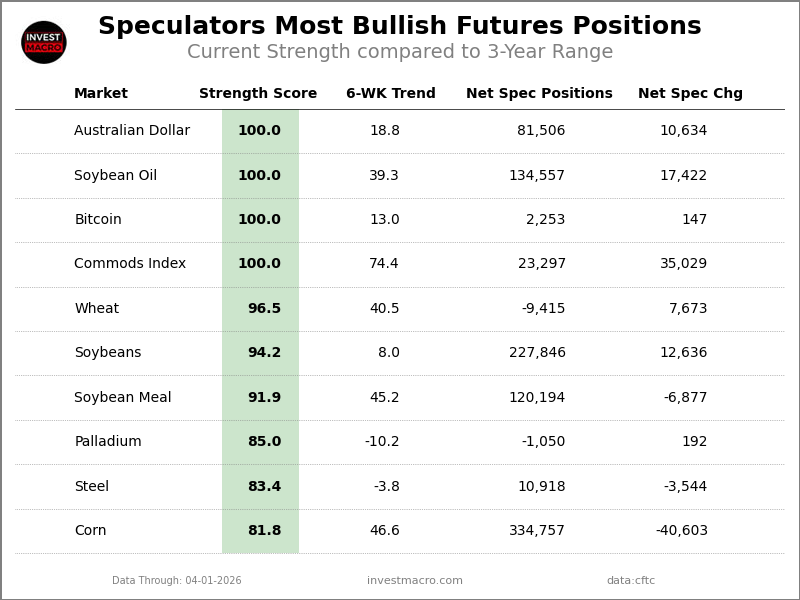
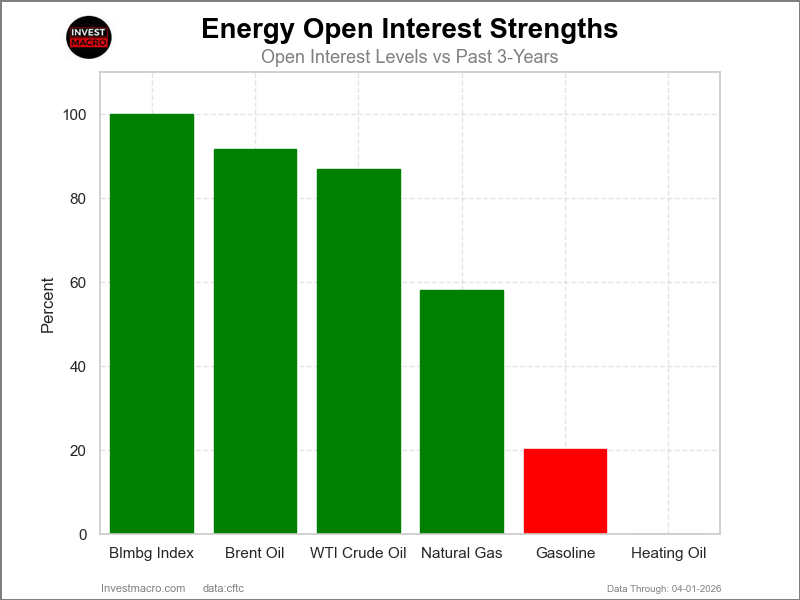
Legend: Weekly Speculators Change | Speculators Current Net Position | Speculators Strength Score compared to last 3-Years (0-100 range)
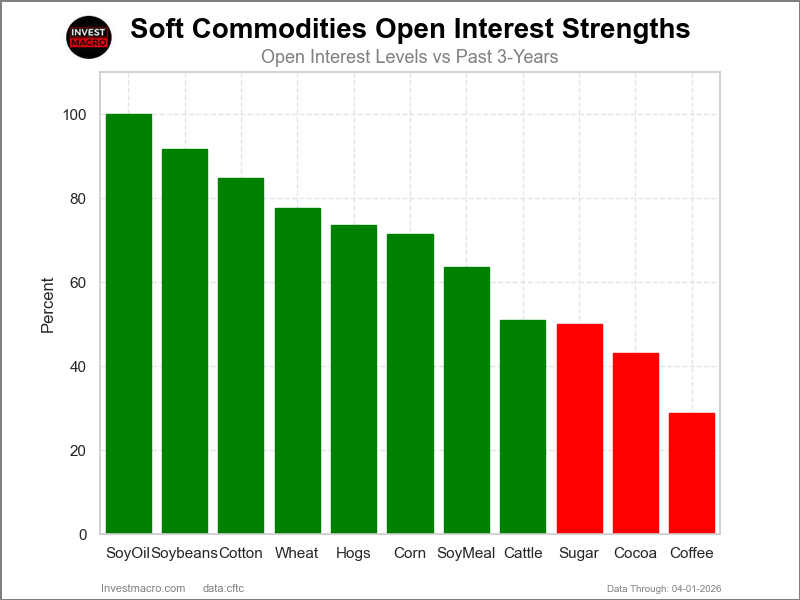
Strength Scores led by Soybean Oil & Wheat
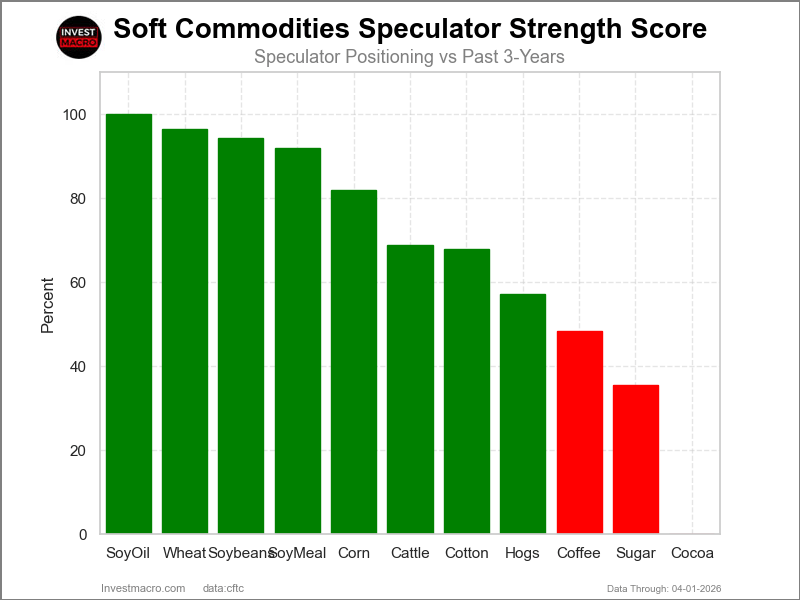
COT Strength Scores (a normalized measure of Speculator positions over a 3-Year range, from 0 to 100 where above 80 is Extreme-Bullish and below 20 is Extreme-Bearish) showed that Soybean Oil (100 percent) and Wheat (96 percent) lead the softs markets this week. Soybeans (94 percent), Soybean Meal (92 percent) and Corn (82 percent) come in as the next highest in the weekly strength scores.
On the downside, Cocoa (0 percent) comes in at the lowest strength levels currently and are in Extreme-Bearish territory (below 20 percent). The next lowest strength scores are Sugar (35 percent), Coffee (48 percent) and Lean Hogs (57 percent).
Strength Statistics:
Corn (81.8 percent) vs Corn previous week (87.3 percent)
Sugar (35.4 percent) vs Sugar previous week (29.6 percent)
Coffee (48.3 percent) vs Coffee previous week (48.7 percent)
Soybeans (94.2 percent) vs Soybeans previous week (91.4 percent)
Soybean Oil (100.0 percent) vs Soybean Oil previous week (91.7 percent)
Soybean Meal (91.9 percent) vs Soybean Meal previous week (94.9 percent)
Live Cattle (68.9 percent) vs Live Cattle previous week (58.8 percent)
Lean Hogs (57.2 percent) vs Lean Hogs previous week (60.4 percent)
Cotton (67.9 percent) vs Cotton previous week (52.3 percent)
Cocoa (0.0 percent) vs Cocoa previous week (1.4 percent)
Wheat (96.5 percent) vs Wheat previous week (89.6 percent)
Cotton & Corn top the 6-Week Strength Trends
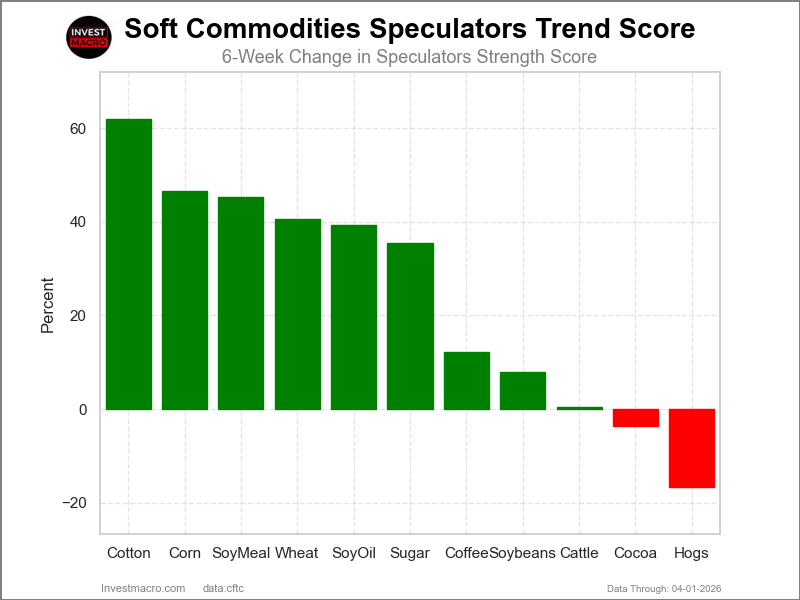
COT Strength Score Trends (or move index, calculates the 6-week changes in strength scores) showed that Cotton (62 percent) and Corn (47 percent) lead the past six weeks trends for soft commodities. Soybean Meal (45 percent), Wheat (41 percent) and Soybean Oil (39 percent) are the next highest positive movers in the latest trends data.
Lean Hogs (-17 percent) leads the downside trend scores currently with Cocoa (-4 percent) following next with lower trend scores.
Strength Trend Statistics:
Corn (46.6 percent) vs Corn previous week (53.6 percent)
Sugar (35.4 percent) vs Sugar previous week (26.2 percent)
Coffee (12.2 percent) vs Coffee previous week (11.5 percent)
Soybeans (8.0 percent) vs Soybeans previous week (15.3 percent)
Soybean Oil (39.3 percent) vs Soybean Oil previous week (30.4 percent)
Soybean Meal (45.2 percent) vs Soybean Meal previous week (51.3 percent)
Live Cattle (0.5 percent) vs Live Cattle previous week (-3.6 percent)
Lean Hogs (-16.7 percent) vs Lean Hogs previous week (-24.9 percent)
Cotton (62.0 percent) vs Cotton previous week (43.8 percent)
Cocoa (-3.6 percent) vs Cocoa previous week (-1.1 percent)
Wheat (40.5 percent) vs Wheat previous week (48.1 percent)
Individual Soft Commodities Markets:
CORN Futures:
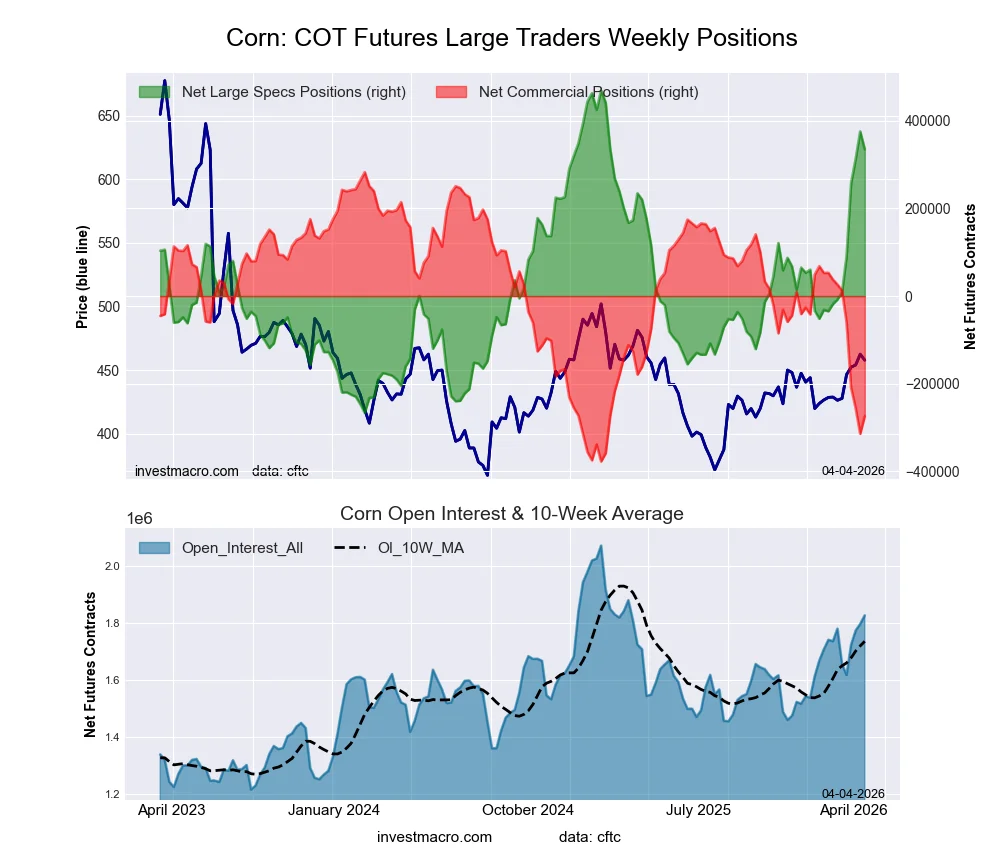 The CORN large speculator standing this week came in at a net position of 334,757 contracts in the data reported through Tuesday. This was a weekly fall of -40,603 contracts from the previous week which had a total of 375,360 net contracts.
This week’s current strength score (the trader positioning range over the past three years, measured from 0 to 100) shows the speculators are currently Bullish-Extreme with a score of 81.8 percent. The commercials are Bearish-Extreme with a score of 15.7 percent and the small traders (not shown in chart) are Bearish with a score of 35.4 percent.
Price Trend-Following Model: Uptrend
Our weekly trend-following model classifies the current market price position as: Uptrend.
| CORN Futures Statistics | SPECULATORS | COMMERCIALS | SMALL TRADERS |
| – Percent of Open Interest Longs: | 26.8 | 40.8 | 7.6 |
| – Percent of Open Interest Shorts: | 8.4 | 55.8 | 10.9 |
| – Net Position: | 334,757 | -273,643 | -61,114 |
| – Gross Longs: | 488,759 | 745,244 | 138,269 |
| – Gross Shorts: | 154,002 | 1,018,887 | 199,383 |
| – Long to Short Ratio: | 3.2 to 1 | 0.7 to 1 | 0.7 to 1 |
| NET POSITION TREND: | | | |
| – Strength Index Score (3 Year Range Pct): | 81.8 | 15.7 | 35.4 |
| – Strength Index Reading (3 Year Range): | Bullish-Extreme | Bearish-Extreme | Bearish |
| NET POSITION MOVEMENT INDEX: | | | |
| – 6-Week Change in Strength Index: | 46.6 | -45.4 | -50.1 |
SUGAR Futures:
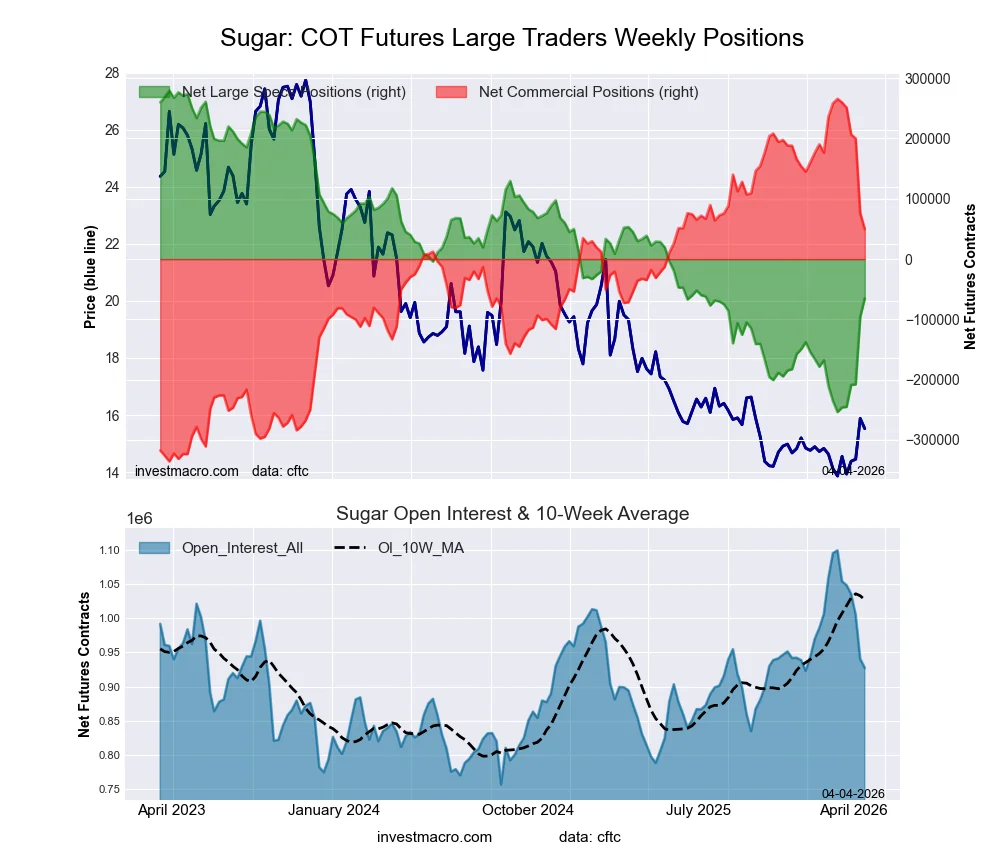 The SUGAR large speculator standing this week came in at a net position of -65,117 contracts in the data reported through Tuesday. This was a weekly boost of 30,687 contracts from the previous week which had a total of -95,804 net contracts.
This week’s current strength score (the trader positioning range over the past three years, measured from 0 to 100) shows the speculators are currently Bearish with a score of 35.4 percent. The commercials are Bullish with a score of 64.1 percent and the small traders (not shown in chart) are Bearish with a score of 49.5 percent.
Price Trend-Following Model: Weak Downtrend
Our weekly trend-following model classifies the current market price position as: Weak Downtrend.
| SUGAR Futures Statistics | SPECULATORS | COMMERCIALS | SMALL TRADERS |
| – Percent of Open Interest Longs: | 20.8 | 52.1 | 10.4 |
| – Percent of Open Interest Shorts: | 27.8 | 46.7 | 8.8 |
| – Net Position: | -65,117 | 49,637 | 15,480 |
| – Gross Longs: | 192,731 | 482,933 | 96,642 |
| – Gross Shorts: | 257,848 | 433,296 | 81,162 |
| – Long to Short Ratio: | 0.7 to 1 | 1.1 to 1 | 1.2 to 1 |
| NET POSITION TREND: | | | |
| – Strength Index Score (3 Year Range Pct): | 35.4 | 64.1 | 49.5 |
| – Strength Index Reading (3 Year Range): | Bearish | Bullish | Bearish |
| NET POSITION MOVEMENT INDEX: | | | |
| – 6-Week Change in Strength Index: | 35.4 | -35.9 | 33.3 |
COFFEE Futures:
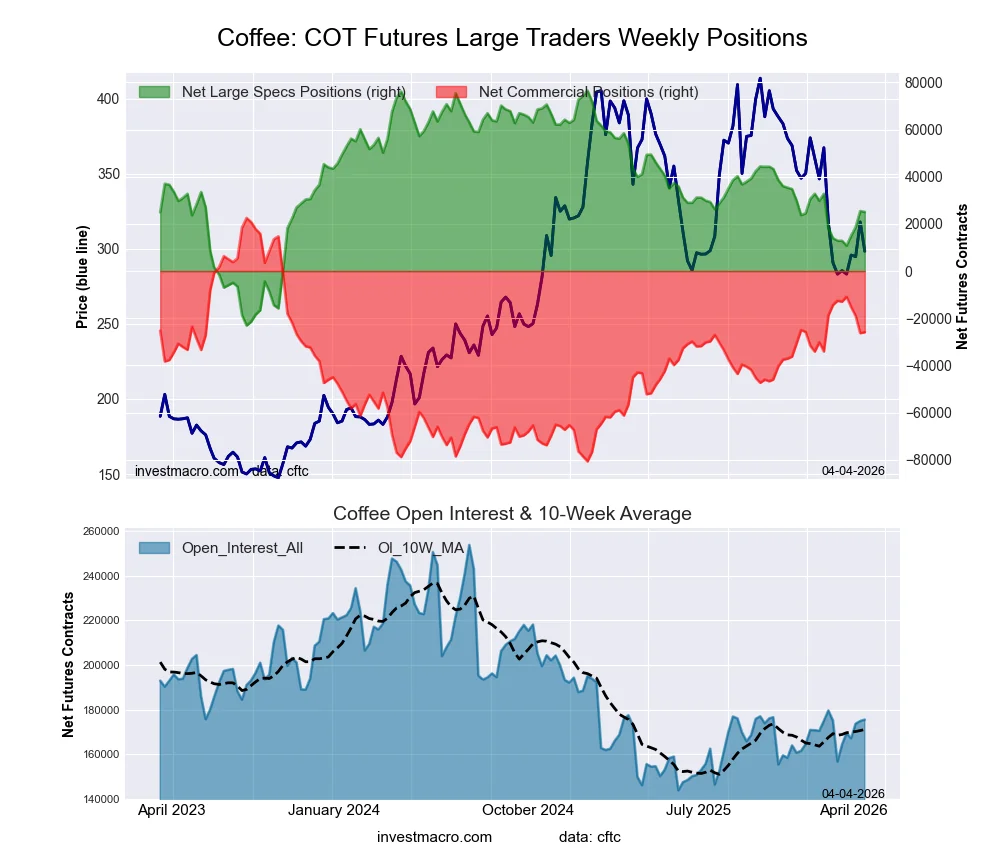 The COFFEE large speculator standing this week came in at a net position of 25,056 contracts in the data reported through Tuesday. This was a weekly decrease of -368 contracts from the previous week which had a total of 25,424 net contracts.
This week’s current strength score (the trader positioning range over the past three years, measured from 0 to 100) shows the speculators are currently Bearish with a score of 48.3 percent. The commercials are Bullish with a score of 53.1 percent and the small traders (not shown in chart) are Bearish with a score of 28.3 percent.
Price Trend-Following Model: Downtrend
Our weekly trend-following model classifies the current market price position as: Downtrend.
| COFFEE Futures Statistics | SPECULATORS | COMMERCIALS | SMALL TRADERS |
| – Percent of Open Interest Longs: | 29.4 | 37.8 | 5.2 |
| – Percent of Open Interest Shorts: | 15.1 | 52.5 | 4.7 |
| – Net Position: | 25,056 | -25,934 | 878 |
| – Gross Longs: | 51,593 | 66,289 | 9,169 |
| – Gross Shorts: | 26,537 | 92,223 | 8,291 |
| – Long to Short Ratio: | 1.9 to 1 | 0.7 to 1 | 1.1 to 1 |
| NET POSITION TREND: | | | |
| – Strength Index Score (3 Year Range Pct): | 48.3 | 53.1 | 28.3 |
| – Strength Index Reading (3 Year Range): | Bearish | Bullish | Bearish |
| NET POSITION MOVEMENT INDEX: | | | |
| – 6-Week Change in Strength Index: | 12.2 | -12.9 | 20.3 |
SOYBEANS Futures:
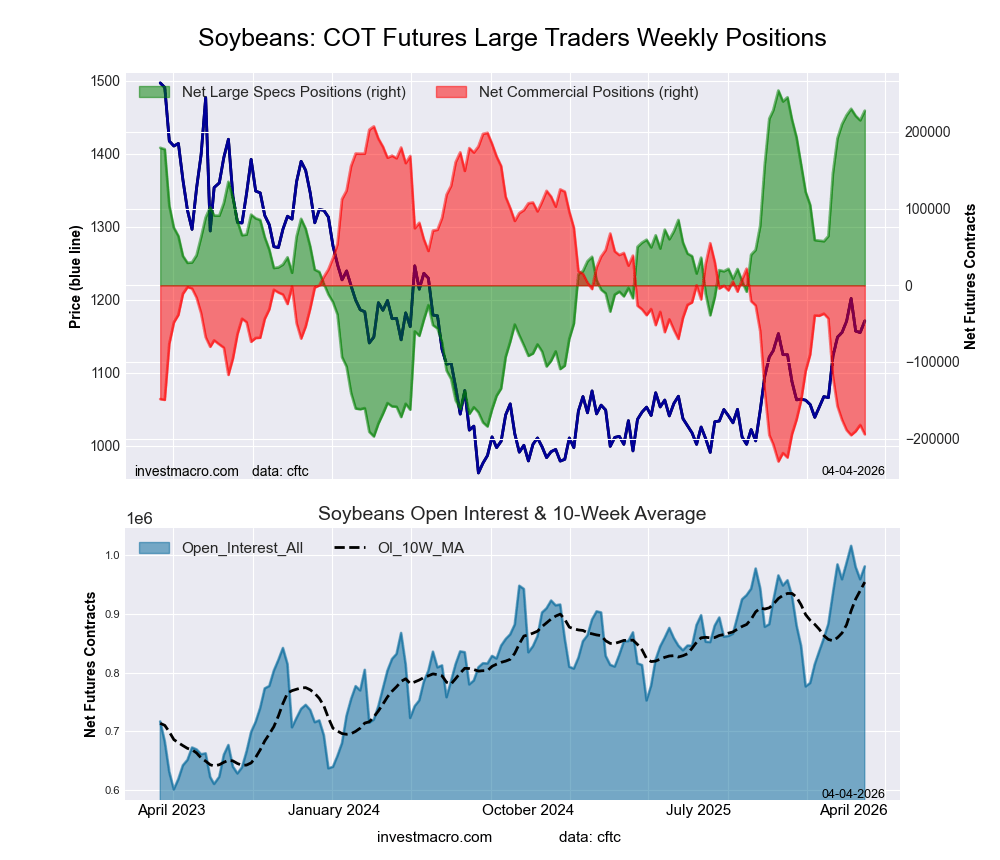 The SOYBEANS large speculator standing this week came in at a net position of 227,846 contracts in the data reported through Tuesday. This was a weekly advance of 12,636 contracts from the previous week which had a total of 215,210 net contracts.
This week’s current strength score (the trader positioning range over the past three years, measured from 0 to 100) shows the speculators are currently Bullish-Extreme with a score of 94.2 percent. The commercials are Bearish-Extreme with a score of 8.1 percent and the small traders (not shown in chart) are Bearish-Extreme with a score of 6.8 percent.
Price Trend-Following Model: Uptrend
Our weekly trend-following model classifies the current market price position as: Uptrend.
| SOYBEANS Futures Statistics | SPECULATORS | COMMERCIALS | SMALL TRADERS |
| – Percent of Open Interest Longs: | 29.8 | 45.4 | 5.2 |
| – Percent of Open Interest Shorts: | 6.6 | 65.2 | 8.6 |
| – Net Position: | 227,846 | -194,445 | -33,401 |
| – Gross Longs: | 292,633 | 445,071 | 51,226 |
| – Gross Shorts: | 64,787 | 639,516 | 84,627 |
| – Long to Short Ratio: | 4.5 to 1 | 0.7 to 1 | 0.6 to 1 |
| NET POSITION TREND: | | | |
| – Strength Index Score (3 Year Range Pct): | 94.2 | 8.1 | 6.8 |
| – Strength Index Reading (3 Year Range): | Bullish-Extreme | Bearish-Extreme | Bearish-Extreme |
| NET POSITION MOVEMENT INDEX: | | | |
| – 6-Week Change in Strength Index: | 8.0 | -8.4 | 2.0 |
SOYBEAN OIL Futures:
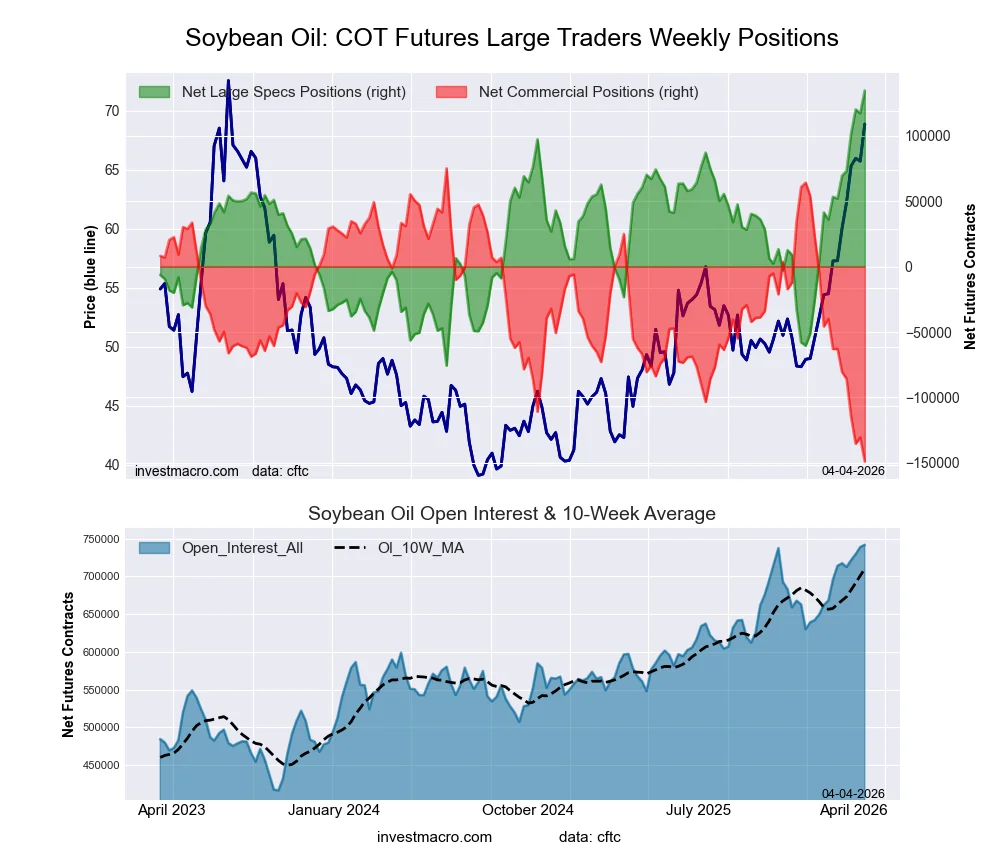 The SOYBEAN OIL large speculator standing this week came in at a net position of 134,557 contracts in the data reported through Tuesday. This was a weekly lift of 17,422 contracts from the previous week which had a total of 117,135 net contracts.
This week’s current strength score (the trader positioning range over the past three years, measured from 0 to 100) shows the speculators are currently Bullish-Extreme with a score of 100.0 percent. The commercials are Bearish-Extreme with a score of 0.0 percent and the small traders (not shown in chart) are Bullish-Extreme with a score of 90.0 percent.
Price Trend-Following Model: Strong Uptrend
Our weekly trend-following model classifies the current market price position as: Strong Uptrend.
| SOYBEAN OIL Futures Statistics | SPECULATORS | COMMERCIALS | SMALL TRADERS |
| – Percent of Open Interest Longs: | 25.2 | 44.8 | 5.7 |
| – Percent of Open Interest Shorts: | 7.1 | 64.9 | 3.8 |
| – Net Position: | 134,557 | -148,949 | 14,392 |
| – Gross Longs: | 186,950 | 332,088 | 42,373 |
| – Gross Shorts: | 52,393 | 481,037 | 27,981 |
| – Long to Short Ratio: | 3.6 to 1 | 0.7 to 1 | 1.5 to 1 |
| NET POSITION TREND: | | | |
| – Strength Index Score (3 Year Range Pct): | 100.0 | 0.0 | 90.0 |
| – Strength Index Reading (3 Year Range): | Bullish-Extreme | Bearish-Extreme | Bullish-Extreme |
| NET POSITION MOVEMENT INDEX: | | | |
| – 6-Week Change in Strength Index: | 39.3 | -38.4 | 17.3 |
SOYBEAN MEAL Futures:
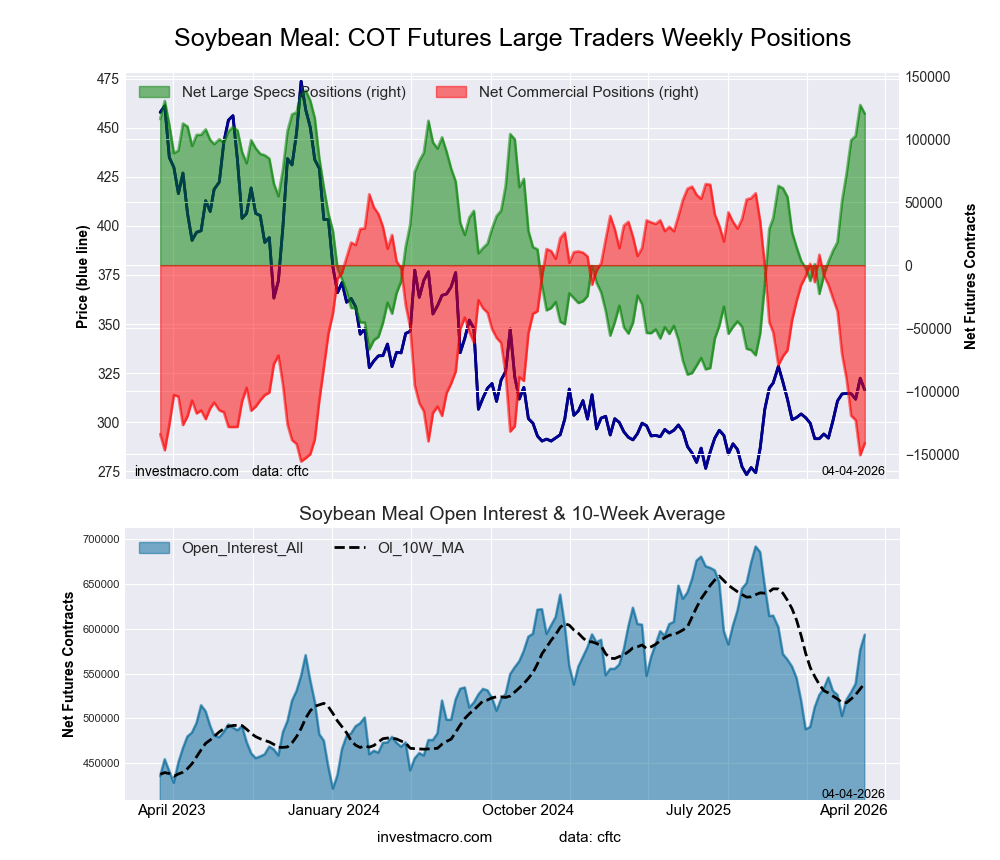 The SOYBEAN MEAL large speculator standing this week came in at a net position of 120,194 contracts in the data reported through Tuesday. This was a weekly lowering of -6,877 contracts from the previous week which had a total of 127,071 net contracts.
This week’s current strength score (the trader positioning range over the past three years, measured from 0 to 100) shows the speculators are currently Bullish-Extreme with a score of 91.9 percent. The commercials are Bearish-Extreme with a score of 6.6 percent and the small traders (not shown in chart) are Bullish with a score of 61.6 percent.
Price Trend-Following Model: Strong Uptrend
Our weekly trend-following model classifies the current market price position as: Strong Uptrend.
| SOYBEAN MEAL Futures Statistics | SPECULATORS | COMMERCIALS | SMALL TRADERS |
| – Percent of Open Interest Longs: | 29.5 | 43.8 | 8.0 |
| – Percent of Open Interest Shorts: | 9.2 | 67.6 | 4.5 |
| – Net Position: | 120,194 | -141,216 | 21,022 |
| – Gross Longs: | 175,060 | 259,734 | 47,754 |
| – Gross Shorts: | 54,866 | 400,950 | 26,732 |
| – Long to Short Ratio: | 3.2 to 1 | 0.6 to 1 | 1.8 to 1 |
| NET POSITION TREND: | | | |
| – Strength Index Score (3 Year Range Pct): | 91.9 | 6.6 | 61.6 |
| – Strength Index Reading (3 Year Range): | Bullish-Extreme | Bearish-Extreme | Bullish |
| NET POSITION MOVEMENT INDEX: | | | |
| – 6-Week Change in Strength Index: | 45.2 | -47.6 | 16.0 |
LIVE CATTLE Futures:
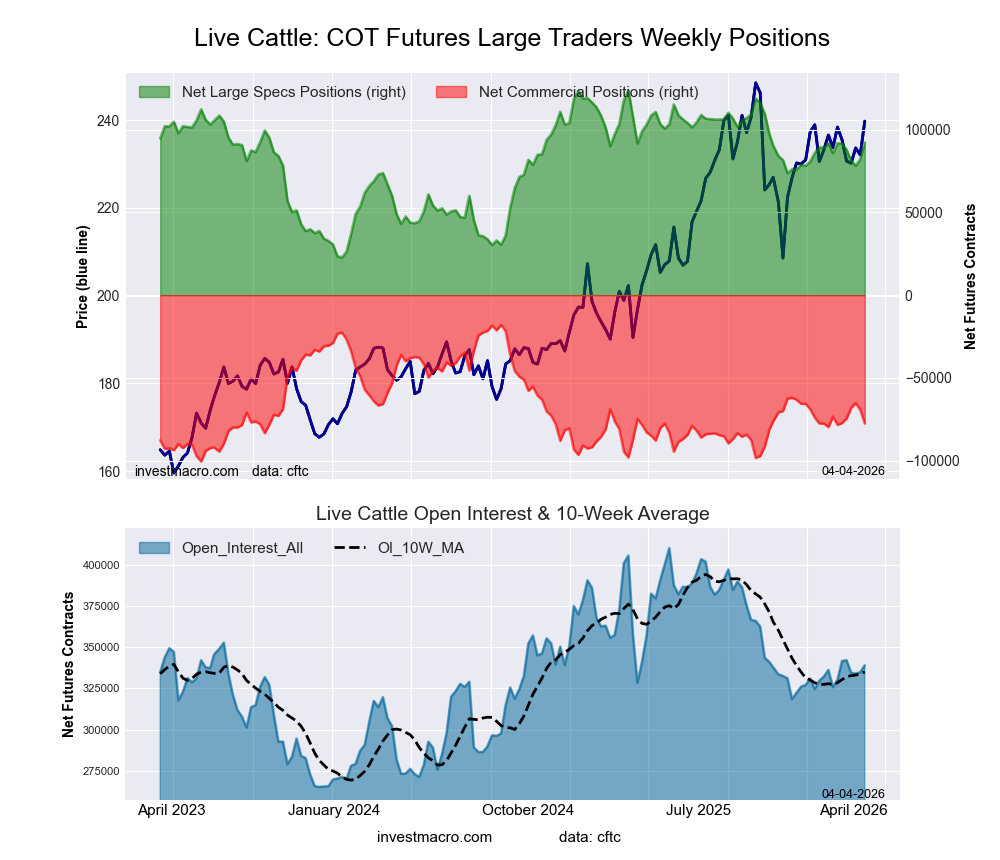 The LIVE CATTLE large speculator standing this week came in at a net position of 92,260 contracts in the data reported through Tuesday. This was a weekly lift of 10,113 contracts from the previous week which had a total of 82,147 net contracts.
This week’s current strength score (the trader positioning range over the past three years, measured from 0 to 100) shows the speculators are currently Bullish with a score of 68.9 percent. The commercials are Bearish with a score of 27.8 percent and the small traders (not shown in chart) are Bearish with a score of 46.5 percent.
Price Trend-Following Model: Strong Uptrend
Our weekly trend-following model classifies the current market price position as: Strong Uptrend.
| LIVE CATTLE Futures Statistics | SPECULATORS | COMMERCIALS | SMALL TRADERS |
| – Percent of Open Interest Longs: | 43.0 | 30.2 | 8.9 |
| – Percent of Open Interest Shorts: | 15.7 | 53.1 | 13.2 |
| – Net Position: | 92,260 | -77,534 | -14,726 |
| – Gross Longs: | 145,655 | 102,496 | 30,134 |
| – Gross Shorts: | 53,395 | 180,030 | 44,860 |
| – Long to Short Ratio: | 2.7 to 1 | 0.6 to 1 | 0.7 to 1 |
| NET POSITION TREND: | | | |
| – Strength Index Score (3 Year Range Pct): | 68.9 | 27.8 | 46.5 |
| – Strength Index Reading (3 Year Range): | Bullish | Bearish | Bearish |
| NET POSITION MOVEMENT INDEX: | | | |
| – 6-Week Change in Strength Index: | 0.5 | 1.0 | -4.7 |
LEAN HOGS Futures:
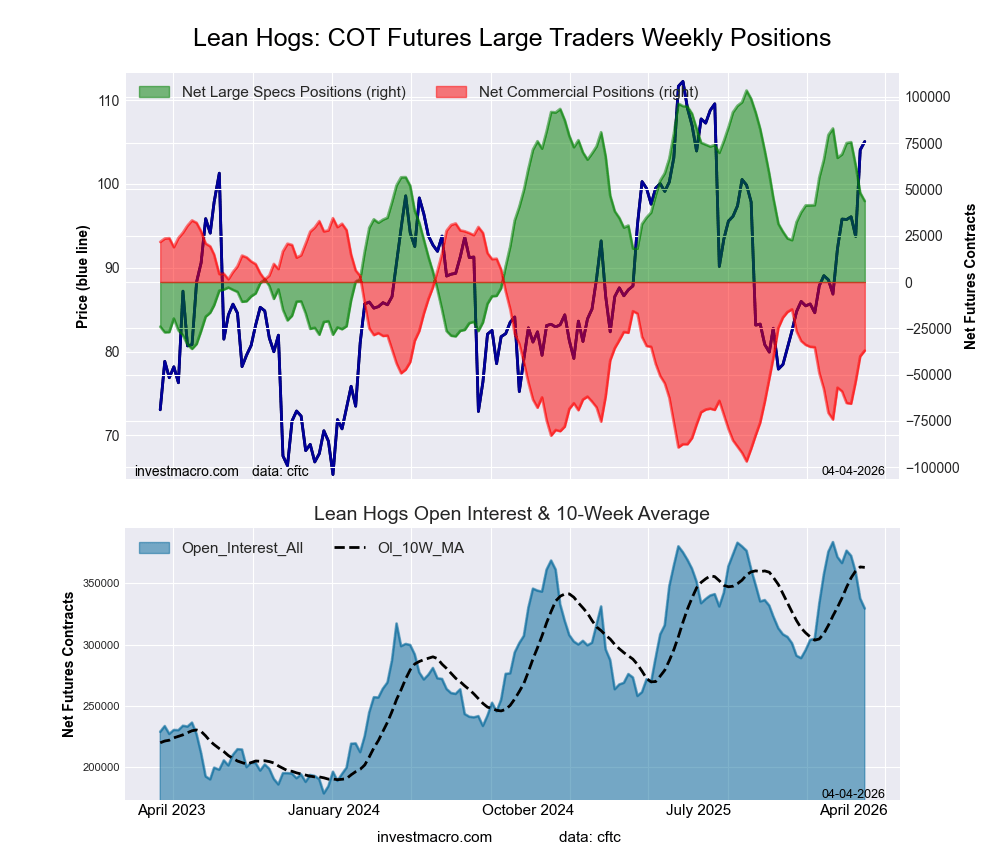 The LEAN HOGS large speculator standing this week came in at a net position of 43,711 contracts in the data reported through Tuesday. This was a weekly decrease of -4,434 contracts from the previous week which had a total of 48,145 net contracts.
This week’s current strength score (the trader positioning range over the past three years, measured from 0 to 100) shows the speculators are currently Bullish with a score of 57.2 percent. The commercials are Bearish with a score of 45.5 percent and the small traders (not shown in chart) are Bearish with a score of 37.4 percent.
Price Trend-Following Model: Strong Uptrend
Our weekly trend-following model classifies the current market price position as: Strong Uptrend.
| LEAN HOGS Futures Statistics | SPECULATORS | COMMERCIALS | SMALL TRADERS |
| – Percent of Open Interest Longs: | 36.6 | 35.0 | 6.5 |
| – Percent of Open Interest Shorts: | 23.4 | 46.2 | 8.5 |
| – Net Position: | 43,711 | -37,042 | -6,669 |
| – Gross Longs: | 120,667 | 115,185 | 21,369 |
| – Gross Shorts: | 76,956 | 152,227 | 28,038 |
| – Long to Short Ratio: | 1.6 to 1 | 0.8 to 1 | 0.8 to 1 |
| NET POSITION TREND: | | | |
| – Strength Index Score (3 Year Range Pct): | 57.2 | 45.5 | 37.4 |
| – Strength Index Reading (3 Year Range): | Bullish | Bearish | Bearish |
| NET POSITION MOVEMENT INDEX: | | | |
| – 6-Week Change in Strength Index: | -16.7 | 15.2 | 20.1 |
COTTON Futures:
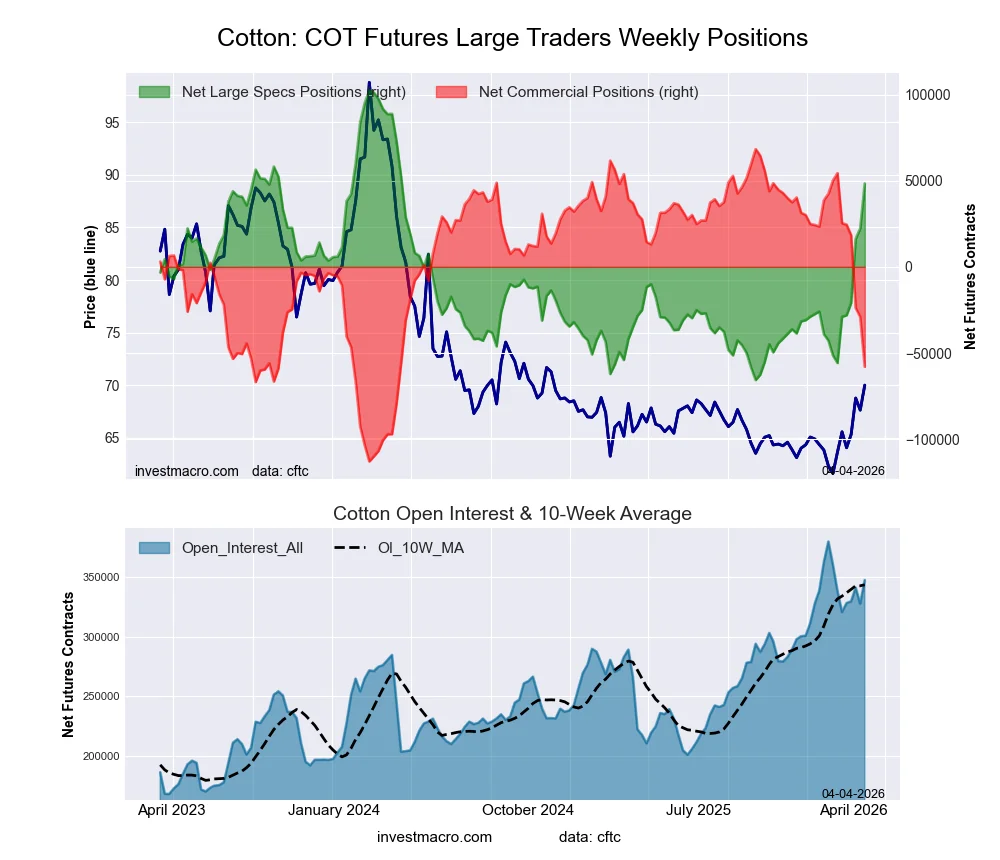 The COTTON large speculator standing this week came in at a net position of 48,387 contracts in the data reported through Tuesday. This was a weekly lift of 26,120 contracts from the previous week which had a total of 22,267 net contracts.
This week’s current strength score (the trader positioning range over the past three years, measured from 0 to 100) shows the speculators are currently Bullish with a score of 67.9 percent. The commercials are Bearish with a score of 30.3 percent and the small traders (not shown in chart) are Bullish-Extreme with a score of 92.6 percent.
Price Trend-Following Model: Strong Uptrend
Our weekly trend-following model classifies the current market price position as: Strong Uptrend.
| COTTON Futures Statistics | SPECULATORS | COMMERCIALS | SMALL TRADERS |
| – Percent of Open Interest Longs: | 37.3 | 36.5 | 5.6 |
| – Percent of Open Interest Shorts: | 23.4 | 53.1 | 2.9 |
| – Net Position: | 48,387 | -57,948 | 9,561 |
| – Gross Longs: | 129,730 | 126,818 | 19,624 |
| – Gross Shorts: | 81,343 | 184,766 | 10,063 |
| – Long to Short Ratio: | 1.6 to 1 | 0.7 to 1 | 2.0 to 1 |
| NET POSITION TREND: | | | |
| – Strength Index Score (3 Year Range Pct): | 67.9 | 30.3 | 92.6 |
| – Strength Index Reading (3 Year Range): | Bullish | Bearish | Bullish-Extreme |
| NET POSITION MOVEMENT INDEX: | | | |
| – 6-Week Change in Strength Index: | 62.0 | -62.0 | 60.3 |
COCOA Futures:
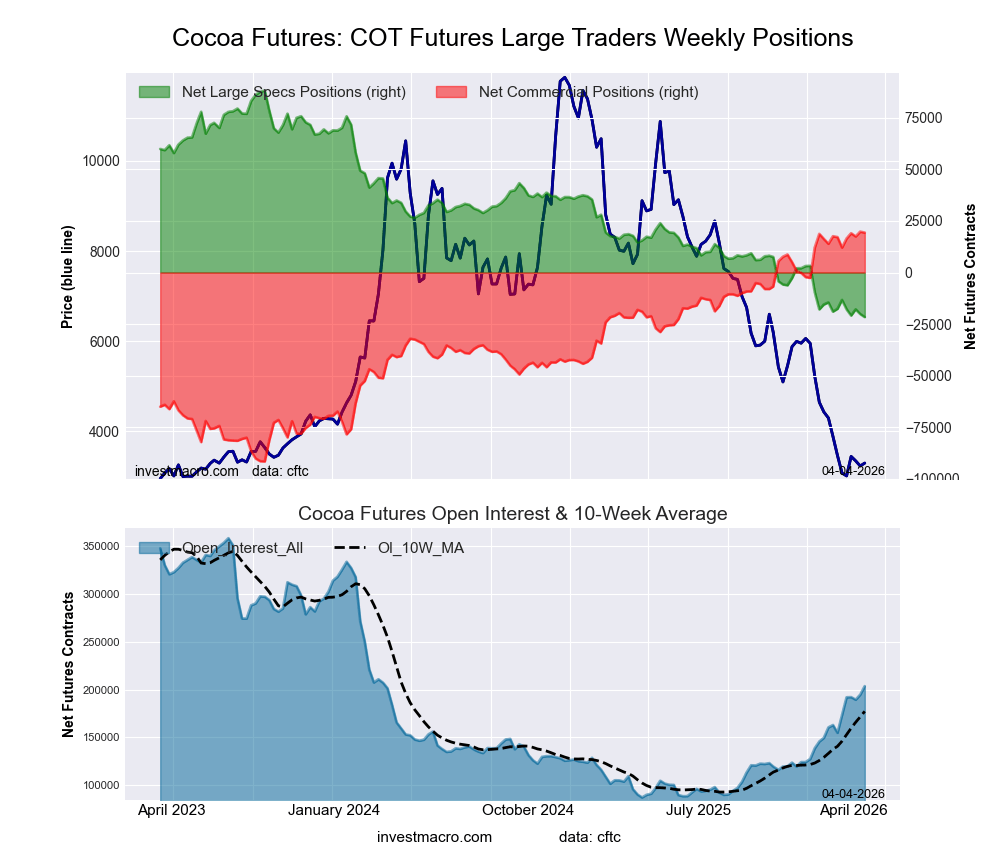 The COCOA large speculator standing this week came in at a net position of -21,601 contracts in the data reported through Tuesday. This was a weekly decrease of -1,485 contracts from the previous week which had a total of -20,116 net contracts.
This week’s current strength score (the trader positioning range over the past three years, measured from 0 to 100) shows the speculators are currently Bearish-Extreme with a score of 0.0 percent. The commercials are Bullish-Extreme with a score of 99.6 percent and the small traders (not shown in chart) are Bearish with a score of 48.5 percent.
Price Trend-Following Model: Downtrend
Our weekly trend-following model classifies the current market price position as: Downtrend.
| COCOA Futures Statistics | SPECULATORS | COMMERCIALS | SMALL TRADERS |
| – Percent of Open Interest Longs: | 21.1 | 49.4 | 5.7 |
| – Percent of Open Interest Shorts: | 31.7 | 39.9 | 4.6 |
| – Net Position: | -21,601 | 19,366 | 2,235 |
| – Gross Longs: | 42,906 | 100,631 | 11,697 |
| – Gross Shorts: | 64,507 | 81,265 | 9,462 |
| – Long to Short Ratio: | 0.7 to 1 | 1.2 to 1 | 1.2 to 1 |
| NET POSITION TREND: | | | |
| – Strength Index Score (3 Year Range Pct): | 0.0 | 99.6 | 48.5 |
| – Strength Index Reading (3 Year Range): | Bearish-Extreme | Bullish-Extreme | Bearish |
| NET POSITION MOVEMENT INDEX: | | | |
| – 6-Week Change in Strength Index: | -3.6 | 2.0 | 16.9 |
WHEAT Futures:
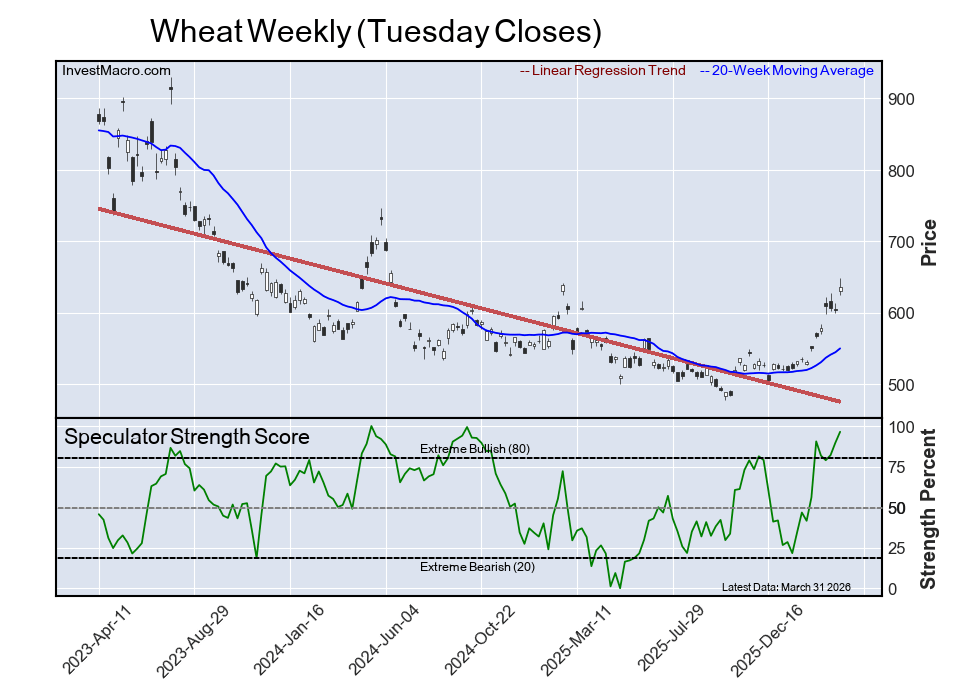
 The WHEAT large speculator standing this week came in at a net position of -9,415 contracts in the data reported through Tuesday. This was a weekly boost of 7,673 contracts from the previous week which had a total of -17,088 net contracts.
This week’s current strength score (the trader positioning range over the past three years, measured from 0 to 100) shows the speculators are currently Bullish-Extreme with a score of 96.5 percent. The commercials are Bearish-Extreme with a score of 0.0 percent and the small traders (not shown in chart) are Bullish with a score of 65.2 percent.
Price Trend-Following Model: Uptrend
Our weekly trend-following model classifies the current market price position as: Uptrend.
| WHEAT Futures Statistics | SPECULATORS | COMMERCIALS | SMALL TRADERS |
| – Percent of Open Interest Longs: | 29.7 | 33.1 | 6.9 |
| – Percent of Open Interest Shorts: | 31.6 | 31.6 | 6.6 |
| – Net Position: | -9,415 | 7,524 | 1,891 |
| – Gross Longs: | 145,000 | 161,925 | 33,907 |
| – Gross Shorts: | 154,415 | 154,401 | 32,016 |
| – Long to Short Ratio: | 0.9 to 1 | 1.0 to 1 | 1.1 to 1 |
| NET POSITION TREND: | | | |
| – Strength Index Score (3 Year Range Pct): | 96.5 | 0.0 | 65.2 |
| – Strength Index Reading (3 Year Range): | Bullish-Extreme | Bearish-Extreme | Bullish |
| NET POSITION MOVEMENT INDEX: | | | |
| – 6-Week Change in Strength Index: | 40.5 | -48.5 | 30.6 |
Article By InvestMacro – Receive our weekly COT Reports by Email
*COT Report: The COT data, released weekly to the public each Friday, is updated through the most recent Tuesday (data is 3 days old) and shows a quick view of how large speculators or non-commercials (for-profit traders) were positioned in the futures markets.
The CFTC categorizes trader positions according to commercial hedgers (traders who use futures contracts for hedging as part of the business), non-commercials (large traders who speculate to realize trading profits) and nonreportable traders (usually small traders/speculators) as well as their open interest (contracts open in the market at time of reporting).See CFTC criteria here.
All information and opinions on this website and contained in this article are for general informational purposes only and do not constitute investment advice.