The GBP/USD pair is currently consolidating, hovering around the 1.2631 mark. This consolidation phase follows recent reports highlighting a slowdown in the expansion plans of British businesses for workforce and wage growth, raising concerns about future economic dynamics and inflationary pressures.
A key report from the Lloyds Bank Business Barometer indicates a noticeable dip in the hiring outlook among companies. The differential between firms looking to hire and those planning cuts fell to 27% from a peak of 36% in February. This level is only slightly above the long-term average of 22%. Moreover, there has also been a marginal decline in the proportion of businesses anticipating wage increases in the next year.
Despite these trends, Bank of England (BoE) data provides a somewhat optimistic outlook, showing that British borrowers manage the high-interest environment relatively well. The incidence of problematic debt remains significantly lower than levels seen following the 2008 financial crisis, underscoring the resilience of the UK’s economic system and indicating signs of GDP recovery.
Catherine Mann, a member of the BoE’s Monetary Policy Committee, has called for a more realistic assessment of monetary policy expectations, suggesting that market predictions for substantial interest rate cuts by the BoE might be overly optimistic. Current market sentiment suggests a high probability of a rate reduction at the BoE’s August meeting.
Technical analysis of GBP/USD
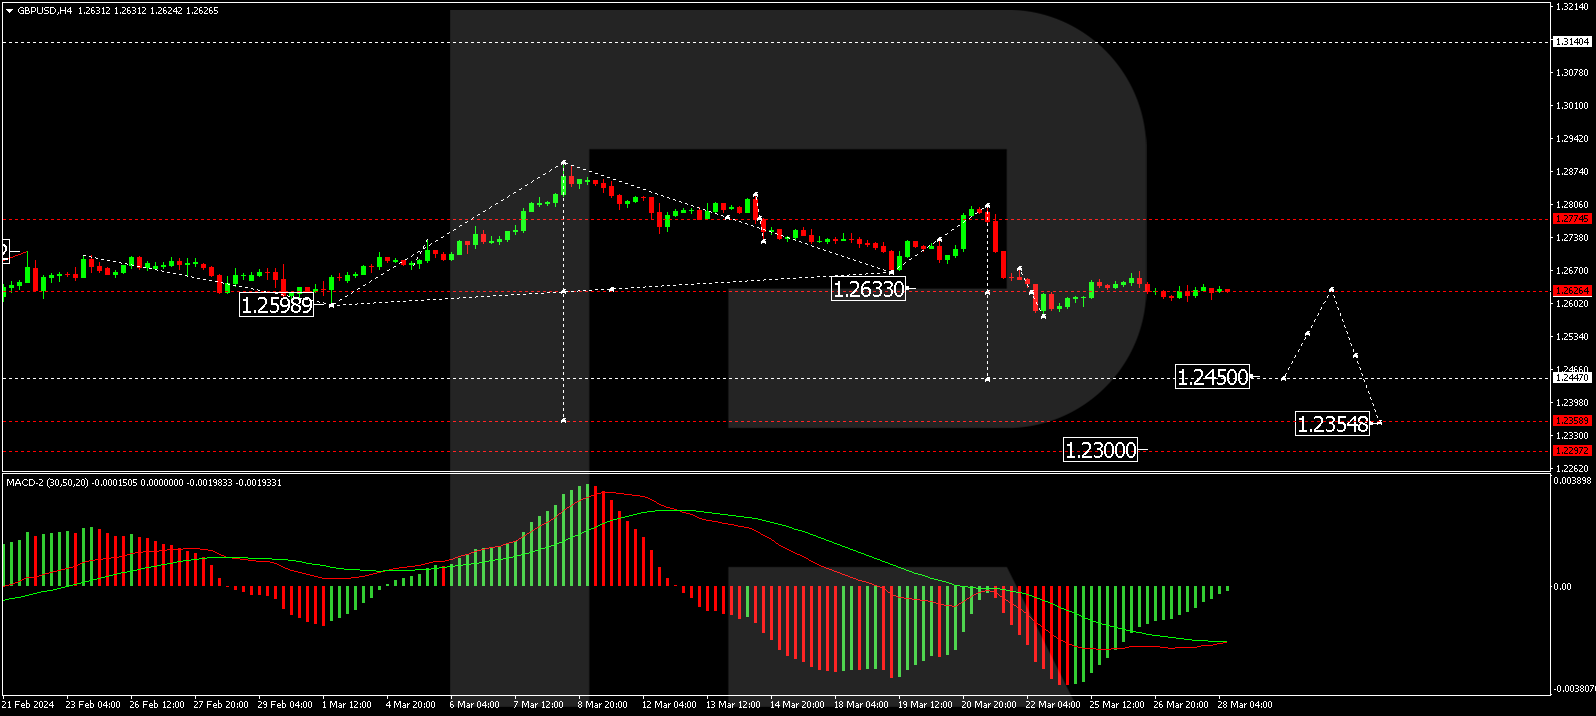
The H4 chart analysis for GBP/USD shows ongoing consolidation around 1.2626. A breakout above this range could signal a potential corrective rise to 1.2700. Conversely, a move below this level may indicate a downward trend towards 1.2450 as an initial target. A potential correction to 1.2626 could follow, with a possible further decline to 1.2355. The MACD oscillator’s position below zero supports the possibility of continued downward movement.
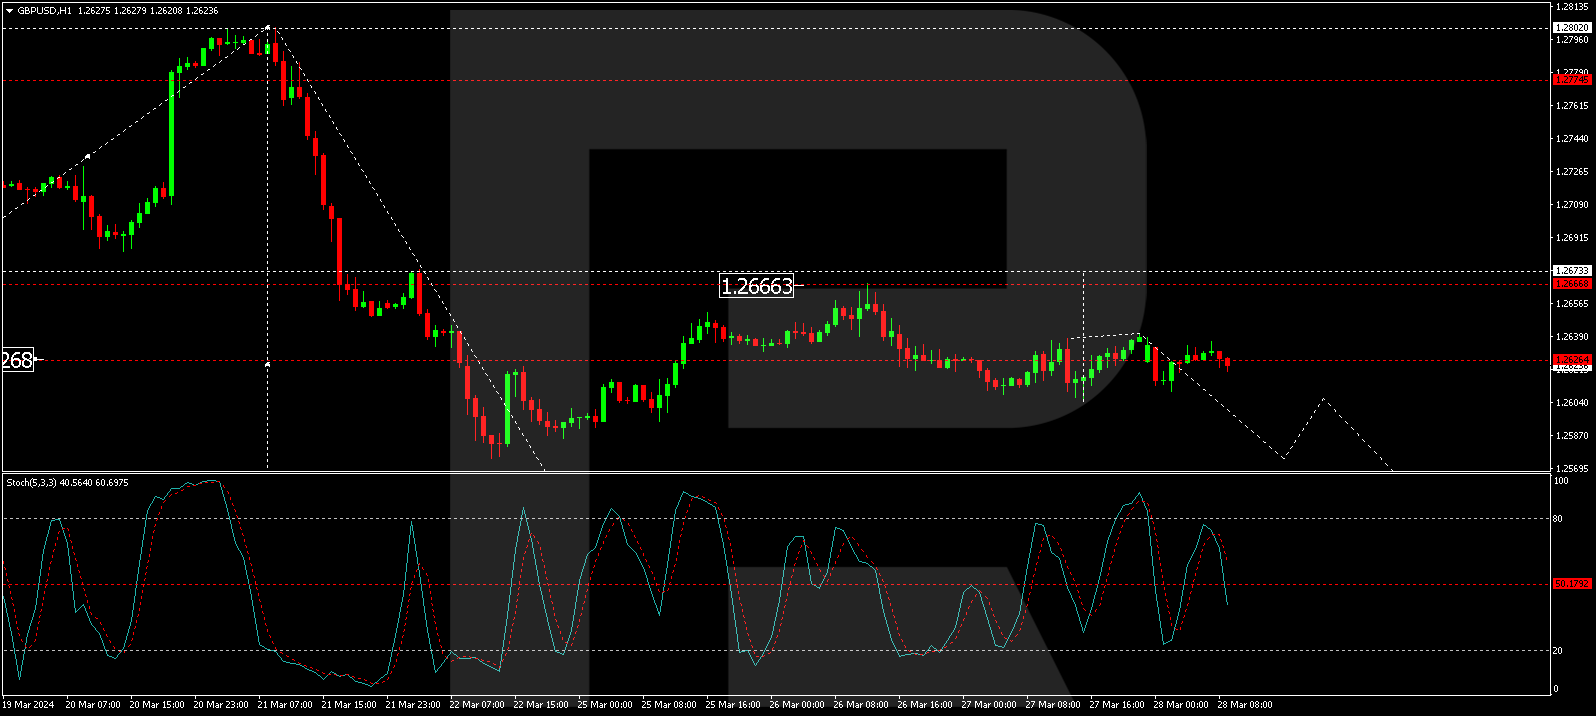
On the H1 chart, the pair is forming a consolidation range around 1.2626, with no definitive trend. An upward breakout might lead to a corrective move towards 1.2676, while a downward breakout could signal the continuation of a decline to 1.2545 and potentially to 1.2450. The Stochastic oscillator, currently below 80 and trending downwards, aligns with the likelihood of a continued decline.
Disclaimer
Any forecasts contained herein are based on the author’s particular opinion. This analysis may not be treated as trading advice. RoboForex bears no responsibility for trading results based on trading recommendations and reviews contained herein.
On Wednesday, the US stock indices ended trading with moderate growth. A decline in T-note bond yields supported the broader market. Investors also welcomed reports that S&P Global Ratings maintained its AA+ long-term US sovereign credit rating and A-1+ short-term sovereign credit rating with a stable outlook. As of Wednesday’s stock market close, the Dow Jones Index (US30) increased by 1.22%. The S&P 500 Index (US500) added 0.86%. The NASDAQ Technology Index (US100) closed positive 0.51%.
Merck’s (MRK) stock price rose more than 4% and topped the Dow Jones Industrials Index after its pulmonary arterial hypertension drug Winrevair received approval from the US Food and Drug Administration. Netflix (NFLX) shares closed down more than 2% after Wedbush removed it from its list of best ideas, saying the company will have a “much harder time” impressing investors this year compared to last. According to SEC filings, Salesforce (CRM) closed down more than 1% and topped the Dow Jones Industrials losers list on signs of insider selling after CEO Benioff sold $4.59 million worth of shares on Monday.
Equity markets in Europe were mostly up on Wednesday. Germany’s DAX (DE40) rose by 0.50% and set a new all-time high, France’s CAC 40 (FR40) closed yesterday up 0.25%, Spain’s IBEX 35 (ES35) added 1.09%, and the UK’s FTSE 100 (UK100) closed positive 0.01%. The Euro Stoxx 50 Index (EU50) rose to a 23-year high on Wednesday.
More ECB policymakers are hinting at a rate cut in June. Yesterday, ECB Governing Council representative Kazaks said inflation will continue to fall across the Eurozone, and June could be a good time for the ECB to start lowering borrowing costs. His colleague, ECB executive board representative Cipollone, added that if incoming data confirms the scenario envisioned in the March forecasts, the ECB should be ready to roll back its restrictive monetary policy stance quickly. Currently, swaps are pricing in the odds of a 25 bps ECB rate cut to 13% at the next meeting on April 11 and fully pricing in that rate cut (100%) at the next meeting on June 6.
German retail sales in February 2024 fell by 1.9% month-on-month, falling short of market forecasts that expected a 0.3% increase. This was the fourth consecutive month of decline in retail sales and the sharpest pace since October 2022, reflecting the impact of higher inflation and high borrowing costs.
The UK economy contracted by 0.3% in the final quarter of 2023, entering a technical recession as high inflation, record borrowing costs, and weak external demand put pressure on demand and activity.
WTI crude futures rose to $82 a barrel on Thursday, breaking a two-day decline, as the latest EIA report pointed to a smaller weekly increase in US crude inventories compared to API data. The EIA data showed that US crude inventories rose by 3.165 million barrels last week, beating market expectations for a 1.275 million barrel decline but far less than the 9.337 million barrel increase reported by the API. Investors also highlighted ongoing supply concerns before next week’s OPEC Joint Ministerial Monitoring Committee meeting.
Asian markets traded flat yesterday. Japan’s Nikkei 225 (JP225) rose by 0.90%, China’s FTSE China A50 (CHA50) declined by 0.76%, Hong Kong’s Hang Seng (HK50) lost 1.36% yesterday, while Australia’s ASX 200 (AU200) was positive 0.51%. At the market open on Thursday, Chinese indices bounced off one-month lows amid expectations that Chinese authorities will step up policy support to shore up the economy. On Thursday, Chinese lawmaker Zhao Leji said that the country would continue to open its economy to foreign investors, which boosted market sentiment. Investors are awaiting data on manufacturing and services activity in China in the coming days to gauge the health of the world’s second-largest economy. Meanwhile, Chinese President Xi Jinping met with US business leaders in Beijing on Wednesday as the government seeks to return foreign investors to the country.
The Reserve Bank of South Africa unanimously decided to keep the key repo rate at 8.25%, marking the fifth consecutive meeting at 2009 levels, as expected. Policymakers emphasized that risks to the inflation outlook were generally skewed to the upside. Core inflation accelerated for the second consecutive month, reaching 5.6% in February from January’s 5.3%, nearing the upper end of the central bank’s target range of 3-6%. Inflation is not expected to reach the middle of the target range until the end of 2025, later than previously thought, as it was initially expected to do so by mid-year.
Expectations for Australian consumer inflation fell to 4.3% in March 2024 from 4.5% in February, indicating the lowest level since October 2021 amid signs that domestic price pressures continue to ease. Australian retail sales rose by 0.3% month-on-month in February 2024, slowing sharply from a 1.1% increase in the previous month and below market forecasts of 0.4%. The S&P/ASX 200 Index (AU200) closed at 7,897 on Thursday, hitting new record highs. Mining stocks led the gains amid higher gold, iron ore, and lithium prices. The interest rate-sensitive banking, real estate, and retail sectors also rose as softer-than-expected domestic inflation data bolstered bets for a rate cut in the second half of 2024.
S&P 500 (US500) 5,248.49 +44.91 (+0.86%)
Dow Jones (US30) 39,760.08 +477.75 (+1.22%)
DAX (DE40) 18,477.09 +92.74 (+0.50%)
FTSE 100 (UK100) 7,931.98 +1.02 (+0.01%)
USD Index 104.37 +0.08 (+0.07%)
Important events today:
– Australia Retail Sales (m/m) at 02:30 (GMT+2);
– UK GDP (q/q) at 09:00 (GMT+2);
– Eurozone German Retail Sales (m/m) at 09:00 (GMT+2);
– Switzerland KOF Leading Indicators (m/m) at 10:00 (GMT+2);
– Eurozone German Unemployment Rate (m/m) at 10:55 (GMT+2);
– US GDP (q/q) at 14:30 (GMT+2);
– Canada GDP (m/m) at 14:30 (GMT+2);
– US Initial Jobless Claims (w/w) at 14:30 (GMT+2);
– US Chicago PMI (m/m) at 15:45 (GMT+2);
– US Michigan Consumer Sentiment (m/m) at 16:00 (GMT+2).
This article reflects a personal opinion and should not be interpreted as an investment advice, and/or offer, and/or a persistent request for carrying out financial transactions, and/or a guarantee, and/or a forecast of future events.
This novel approach involves storing and cooling coral sperm and larvae, or germ cells, at very low temperatures and holding them in government biorepositories.
These repositories are an important hedge against extinction for corals. Managed effectively, they can help offset threats to the Earth’s reefs on a global scale. These frozen assets can be used today, 10 years or even 100 years from now to help reseed the oceans and restore living reefs.
Smithsonian scientists use cryopreserved coral sperm to increase the genetic diversity of elkhorn coral.
Safely frozen alive
Cryopreservation is a process for freezing biological material while maintaining its viability. It involves introducing sugarlike substances, called cryoprotectants, into cells to help prevent lethal ice formation during the freezing phase. If done properly, the cells remain frozen and alive in liquid nitrogen, unchanged, for many years.
Today, coral cryopreservation techniques rely largely on freezing spermand larvae. Since 2007, I have trained many colleagues in coral cryopreservation and worked with them to successfully preserve coral sperm. Today we have sperm from over 50 species of corals preserved in biorepositories worldwide.
We have used this cryopreserved sperm to produce new coral across the Caribbean via a selective breeding process called assisted gene flow. The goal was to use cryopreserved sperm and interbreed corals that would not necessarily have encountered each other – a type of long-distance matchmaking.
Genetic diversity is maintained by combining as many different parents as possible to produce new sexually produced offspring. Since corals are cemented to the seabed, when population numbers in their area decline, new individuals can be introduced via cryopreservation. The hope is that these new genetic combinations might have an adaptation that will help coral survive changes in future warming oceans.
Corals in Kaneohe Bay, Hawaii during 2014 and 2015 warming events in which over 80% of corals were affected. Some species and individuals, like the coral at left, were resistant to warming. Claire Lager, Smithsonian, CC BY-ND
These assisted gene flow studies produced 600 new genetic-assorted individuals of the threatened elkhorn coral Acropora palmata. As of early 2024, there are only about 150 elkhorn individuals left in the wild in the Florida population. If given the chance, these selectively bred corals held in captivity could significantly increase the wild elkhorn gene pool.
Preserving sperm cells and larvae is an important hedge against the loss of biodiversity and species extinctions. But we can only collect this material during fleeting spawning events when corals release egg and sperm into the water.
These episodes occur over just a few days a year – a small time window that poses logistical challenges for researchers and conservationists, and limits the speed at which we can successfully cryo-bank coral species.
To complicate matters further, warming oceans and increasingly frequent marine heat waves can biologically stress corals. This can make their reproductive material too weak to withstand the rigors of being cryopreserved and thawed.
An elkhorn coral produced through assisted gene flow, showing vigorous growth and development. Cody Engelsma, CC BY-ND
Scaling up the rescue
To collect coral material faster, we are developing a cryopreservation process for whole coral fragments, using a method called isochoric vitrification. This technique is still developing. However, if fully successful, it will preserve whole coral fragments without causing ice to form in their tissues, thus producing viable fragments after they’ve thawed that thrive and can be placed back out on the reef.
To do this, we dehydrate the fragment by exposing it to a viscous cryoprotectant cocktail. Then we place it into a small aluminum cylinder and immerse the cylinder in liquid nitrogen, which has a temperature of minus 320 degrees Fahrenheit (minus 196 Celsius).
This process freezes the cylinder’s contents so fast that the cryoprotectant forms a clear glass instead of allowing ice crystals to develop. When we want to thaw the fragments, we place them into a warm water bath for a few minutes, then rehydrate them in seawater.
Using this method, we can collect and cryopreserve coral fragments year-round, since we don’t have to wait and watch for fleeting spawning events. This approach greatly accelerates our conservation efforts.
Protecting as many species as possible will require expanding and sharing our science to create robust cryopreserved-and-thawed coral material through multiple methods. My colleagues and I want the technology to be easy, fast and cheap so any professional can replicate our process and help us preserve corals across the globe.
We have created a video-based coral cryo-training program that includes directions for building simple, 3D-printed cryo-freezers, and have collaborated with engineers to develop new methods that now allow coral larvae to be frozen by the hundreds on simple, inexpensive metal meshes. These new tools will make it possible for labs around the world to significantly accelerate coral collection around the globe within the next five years.
Without coral reefs, the world would lose a valuable source of food, coastal protection, medicines and income – and some of the world’s most unique and beautiful ecosystems.
Safeguarding the future
Recent climate models estimate that if greenhouse gas emissions continue unabated, 95% or more of the world’s corals could die by the mid-2030s. This leaves precious little time to conserve the biodiversity and genetic diversity of reefs.
One approach, which is already under way, is bringing all coral species into human care. The Smithsonian is part of the Coral Biobank Alliance, an international collaboration to conserve corals by collecting live colonies, skeletons and genetic samples and using the best scientific practices to help rebuild reefs.
To date, over 200 coral species, out of some 1,000 known hard coral species, and thousands of colonies are under human care in institutions around the world, including organizations connected with the U.S. and European arms of the Association of Zoos and Aquariums. Although these are clones of colonies from the wild, these individuals could be put into coral breeding systems that could be used for later cryopreservation of their genetically-assorted larvae. Alternatively, their larvae could be used for reef restoration projects.
Until climate change is slowed and reversed, reefs will continue to degrade. Ensuring a better future for coral reefs will require building up coral biorepositories, establishing on-land nurseries to hold coral colonies and develop new larval settlers, and training new cryo-professionals.
For decades, zoos have used captive breeding and reintroduction to protect animals species that have fallen to critically low levels. Similarly, I believe our novel solutions can create hope and help save coral reefs to reseed our oceans today and long into the future.
Check out these potential profits that you may have missed from our Daily Market Analysis.
EURGBP bears bag 20 pips
GBPUSD reaches all profit targets
Crude bulls pockets 63 points
1) EURGBP extends downside pressure
Where and when was Target Price (TP) published?
This technical scenario (EURGBP) is based on the FXTM Signals that are posted twice a day (before the London and New York sessions) for all FXTM clients to follow.
After consolidating in the Asian session, the EURGBP extended losses this morning thanks to mixed data from Germany and dovish remarks by an ECB policymaker.
How much in potential profits?
The EURGBP tumbled through all bearish profit targets on the H1 timeframe.
Given how the entry was at 0.85713, this is equivalent to 20 pips of profit.
2) GBPUSD hits all target levels
This technical scenario (GBPUSD) is based on the FXTM Signals that are posted twice a day (before the London and New York sessions) for all FXTM clients to follow.
The major currency pair tumbled this morning, dragged down by an appreciating dollar.
How much in potential profits?
Considering how the entry was at 1.26267, this is roughly 15 pips of profit on the M15 timeframe.
3) Crude touches 4th and final profit target
This technical scenario (Crude) is based on the FXTM Signals that are posted twice a day (before the London and New York sessions) for all FXTM clients to follow.
The EURSEK hijacked our attention on Wednesday after hitting a fresh 2024 high above 11.50!
Bulls were already in a position of power with the minor currency pair blasting through key resistance earlier in the week.
With the Swedish Krona weakening further this morning after Sweden’s central bank indicated a potential rate cut as soon as May, further upside could be on the cards for the EURSEK.
Note: Riksbank left interest rates unchanged at 4% in March but struck a dovish note.
Traders are currently pricing in an 86% probability of a 25-basis point Riksbank cut by May 2024.
When considering how this may be before the ECB and Fed which are expected to cut in June, it will make Riskbank the second major bank in the G10 space after Switzerland to cut rates.
Fun fact: The SEK has weakened against almost every single major currency this month.
Beyond the Riksbank decision, the latest economic sentiment data from Europe matched expectations, rising to 96.30 in March from 95.50 in the previous month. It will be wise to keep an eye on data from Germany published on Thursday which could influence expectations around when the ECB will start cutting rates.
Focusing on the technical picture, the EURSEK is faced with a “moment of truth” as it is confronted with a combined resistance of its 200-day simple moving average (SMA) and an upward-sloping resistance line at 11.50136.
From an Elliot Wave perspective, the 3rd impulse wave is in play and may rally to 11.68710 (over 17,000 points from its current 200-day SMA).
This is one highly probable scenario that EURSEK bulls, (those looking to see prices rally) may look forward to if the confluence of resistance is broken.
On the back of these news releases, EURSEK H1 broke out of the resistance zone of an upward-sloping channel which started to appear on Monday, March 25th, 2024, and is being rejected at the combined resistance earlier highlighted in D1 above.
EURSEK bears (those looking to see a price decline) may have their sights turned to the support zone of this channel at 11.44333 if the price continues to decline.
Bloomberg’s FX model points to a 78% chance that EURSEK will trade within the 11.3738 – 11.5829 range into next week.
As of Tuesday’s stock market close, the Dow Jones Index (US30) decreased by 0.08%. The S&P 500 Index (US500) was down 0.28%. The NASDAQ Technology Index (US100) closed negative 0.42%.
On Tuesday, stock indices gave up early gains and suffered moderate losses. Nvidia (NVDA) fell more than 2%, causing chip maker stocks to fall, which impacted the overall market. Eight of the eleven sectors ended trading lower. The US economic news on Tuesday was mixed for stocks, with new capital goods orders rising more than expected in February, but the US consumer confidence index unexpectedly declined.
Tesla (TSLA) closed higher by more than 2% after it was revealed that Italy’s Ministry of Industry has contacted the company about the potential production of electric trucks.
Equity markets in Europe were mostly up on Monday. Germany’s DAX (DE40) rose by 0.67% and set a new all-time high, France’s CAC 40 (FR40) closed Tuesday up 0.41%, Spain’s IBEX 35 (ES35) rose by 0.36%, and the UK’s FTSE 100 (UK100) closed positive 0.17%.
The GfK Consumer Confidence Index for April in Germany rose by 1.4 to 27.4, stronger than expectations of 28.0. ECB Governing Council spokesman Müller said the data over the coming weeks may be enough to confirm a slowdown in inflation by the time ECB policymakers set borrowing costs in June.
The Swiss franc fell to 0.9 per US dollar in late March, the lowest in nearly five months, amid contrasting monetary policies from the Swiss National Bank and the Federal Reserve. The SNB cut its benchmark interest rate by 25 bps to 1.5% at its March meeting, surprising markets that had expected it to hold, the first rate cut among major central banks since global disinflation began in 2023. In addition to the rate cut, the SNB sharply revised its inflation forecast for Switzerland downward, with policymakers expecting inflation to stay below 1.5% in the near term despite the government ending utility subsidies.
Sweden’s Riksbank will hold a monetary policy meeting today. The Riksbank is expected to leave rates unchanged at this meeting, but traders will be hoping for hints that a rate cut will come in June or even earlier.
WTI crude prices fell to $81 a barrel on Wednesday, extending losses from the previous session. A large increase in US crude inventories raised demand concerns in the world’s top oil consumer. Industry data showed that US crude inventories rose by 9.337 million barrels last week, a reversal from the previous week’s 1.519 million barrel decline and the biggest weekly increase since February last year.
Asian markets were mostly down. Japan’s Nikkei 225 (JP225) lost 0.40%, China’s FTSE China A50 (CHA50) jumped 0.69%, Hong Kong’s Hang Seng (HK50) ended yesterday up 0.88% and Australia’s ASX 200 (AU200) was negative 0.41%.
Softer-than-expected Australian inflation data bolstered bets that the Reserve Bank of Australia (RBA) may start cutting interest rates this summer. The data showed that Australia’s monthly consumer price index for February 2024 came in at 3.4%, unchanged from the previous two months and missing forecasts for a slight rise to 3.5%.
The Japanese yen’s gradual decline toward 152 per dollar for the first time since 1990 was enough for Japan’s finance minister to immediately warn of “decisive steps” to tame “disorderly” moves. He last uttered those words before the central bank intervened at the end of 2022 to support the yen. Meanwhile, Bank of Japan Governor Kazuo Ueda said Wednesday that supporting the economy with an accommodative monetary policy is now essential.
S&P 500 (US500) 5,203.58 −14.61 (−0.28%)
Dow Jones (US30) 39,282.33 −31.31 (−0.08%)
DAX (DE40) 18,384.35 +123.04 (+0.67%)
FTSE 100 (UK100) 7,930.96 +13.39 (+0.17%)
USD Index 104.30 +0.07 (+0.07%)
Important events today:
– Australia Consumer Price Index (m/m) at 02:30 (GMT+2);
This article reflects a personal opinion and should not be interpreted as an investment advice, and/or offer, and/or a persistent request for carrying out financial transactions, and/or a guarantee, and/or a forecast of future events.
The AUD/USD pair is declining, reaching 0.6539 on Wednesday.
The Australian dollar is heading back to a three-week low following the release of softer-than-expected consumer price index (CPI) data from Australia.
For February 2024, inflation in Australia stood at 3.4%, unchanged from the previous report, in contrast to the anticipated slight increase to 3.5%. This marks the lowest inflation level since November 2021.
Last week, the Reserve Bank of Australia (RBA) held its meeting and decided to keep the interest rate unchanged at 4.35% annually. The rate remains at a 12-year peak, unchanged for the third consecutive meeting. The RBA’s stance has slightly shifted; the regulator no longer indicates further rate hikes, confident that inflation will ease pressure. This opens the possibility of rate reductions later in the year.
The US dollar is strengthening today amid growing expectations that the Federal Reserve will maintain interest rates high for an extended period. This contrasts with forecasts of monetary policy easing by other central banks, some of which could occur before the Fed’s actions.
Technical Analysis of AUD/USD
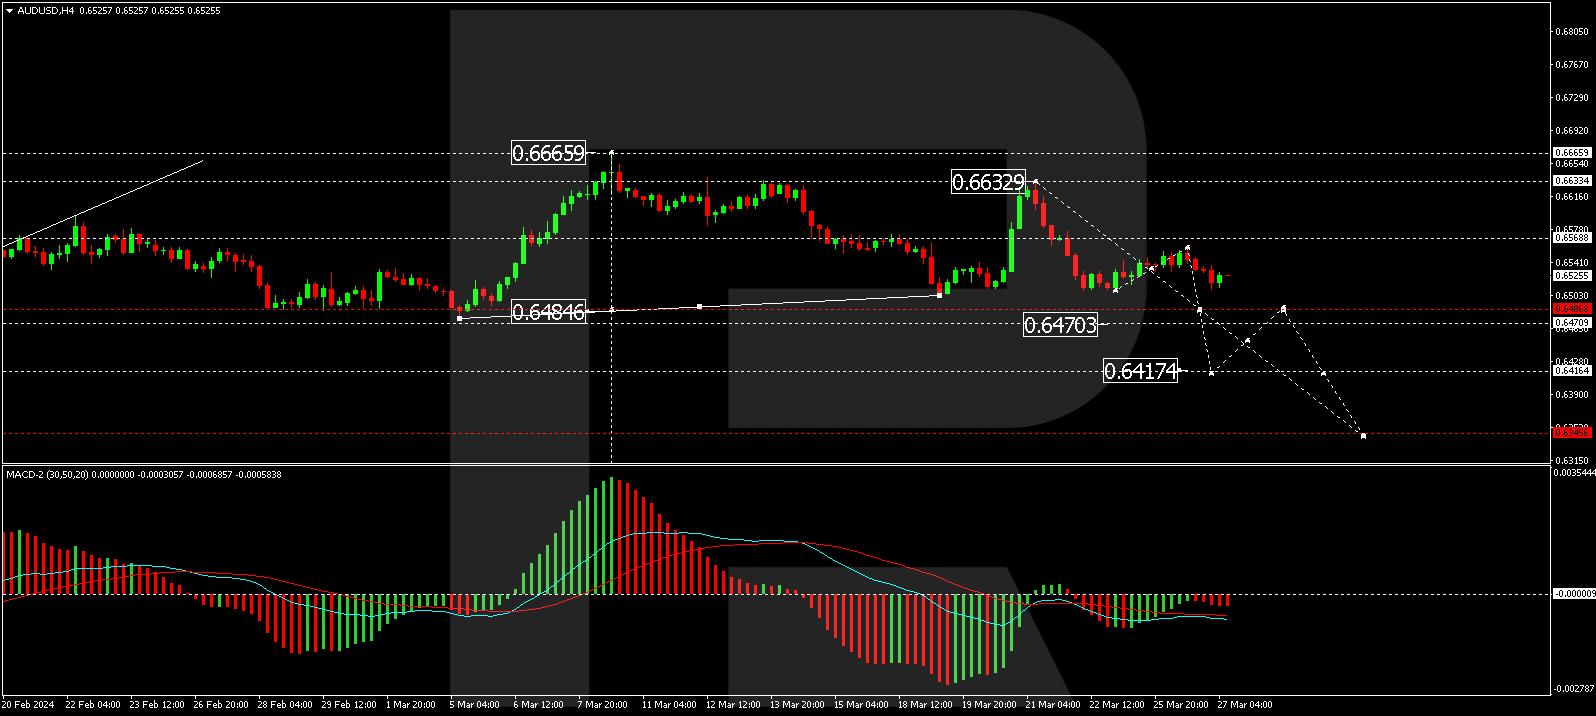
On the H4 chart of AUD/USD, a correction to 0.6558 has been completed. The market is continuing to develop a declining wave to 0.6486. After reaching this level, a consolidation range is expected. With a downward exit from this range, there is a potential for further decline to 0.6417. This target is local. The MACD indicator supports this scenario, with its signal line below zero and strictly directed downwards.
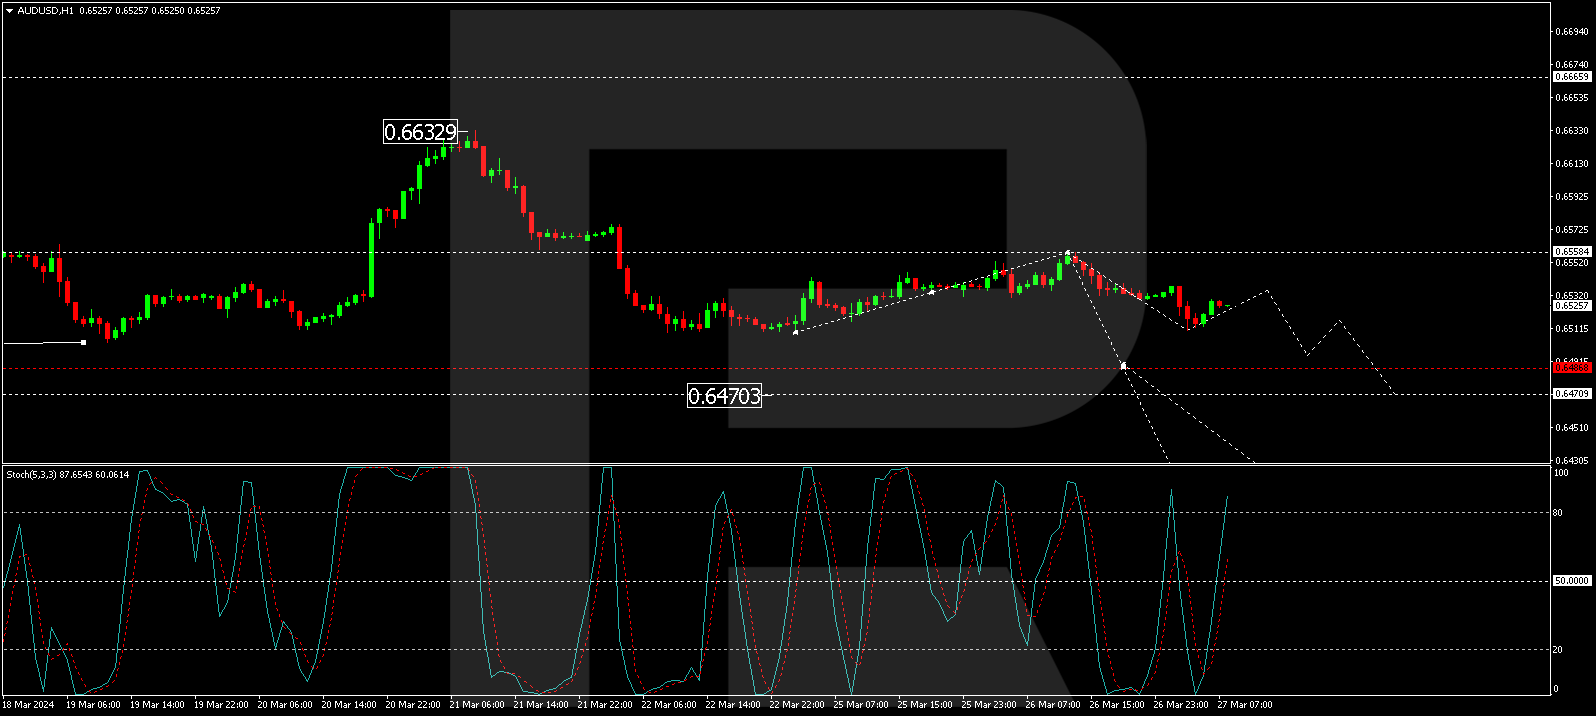
On the H1 chart, AUD/USD is forming a declining wave structure towards 0.6486. After reaching this level, a corrective phase to 0.6533 may occur, followed by a decline to 0.6470, with the potential to continue the trend towards 0.6417. The Stochastic oscillator confirms this scenario, with its signal line above 80 and preparing for a decline to 20.
Disclaimer
Any forecasts contained herein are based on the author’s particular opinion. This analysis may not be treated as trading advice. RoboForex bears no responsibility for trading results based on trading recommendations and reviews contained herein.
Humans are very good at spotting patterns, or repeating features people can recognize. For instance, ancient Polynesians navigated across the Pacific by recognizing many patterns, from the stars’ constellations to more subtle ones such as the directions and sizes of ocean swells.
Very recently, mathematicians like me have started to study large collections of objects that have no patterns of a particular sort. How large can collections be before a specified pattern has to appear somewhere in the collection? Understanding such scenarios can have significant real-world implications: For example, what’s the smallest number of server failures that would lead to the severing of the internet?
Research from mathematician Jordan Ellenberg at the University of Wisconsin and researchers at Google’s Deep Mind have proposed a novel approach to this problem. Their work uses artificial intelligence to find large collections that don’t contain a specified pattern, which can help us understand some worst-case scenarios.
The idea of patternless collections can be illustrated by a popular card game called Set. In this game, players lay out 12 cards, face up. Each card has a different simple picture on it. They vary in terms of number, color, shape and shading. Each of these four features can have one of three values.
Players race to look for “sets,” which are groups of three cards in which every feature is either the same or different in each card. For instance, cards with one solid red diamond, two solid green diamonds and three solid purple diamonds form a set: All three have different numbers (one, two, three), the same shading (solid), different colors (red, green, purple) and the same shape (diamond).
Marsha Falco originally created the game Set to help explain her research on population genetics.
Finding a set is usually possible – but not always. If none of the players can find a set from the 12 cards on the table, then they flip over three more cards. But they still might not be able to find a set in these 15 cards. The players continue to flip over cards, three at a time, until someone spots a set.
So what is the maximum number of cards you can lay out without forming a set?
If you wanted to find the smallest collection of cards with no set, you could in principle do an exhaustive search of every possible collection of cards chosen from the deck of 81 cards. But there are an enormous number of possibilities – on the order of 1024 (that’s a “1” followed by 24 zeros). And if you increase the number of features of the cards from four to, say, eight, the complexity of the problem would overwhelm any computer doing an exhaustive search for “no set” collections.
Mathematicians love to think about computationally difficult problems like this. These complex problems, if approached in the right way, can become tractable.
It’s easier to find best-case scenarios – here, that would mean the fewest number of cards that could contain a set. But there were few known strategies that could explore bad scenarios – here, that would mean a large collection of cards that do not contain a set.
Ellenberg and his collaborators approached the bad scenario with a type of AI called large language models, or LLMs. The researchers first wrote computer programs that generate some examples of collections of many that contain no set. These collections typically have “cards” with more than four features.
Then they fed these programs to the LLM, which soon learned how to write many similar programs and choose the ones that give rise to the largest set-free collections to undergo the process again. Iterating that process by repeatedly tweaking the most successful programs enables them to find larger and larger set-free collections.
This method allows people to explore disordered collections – in this instance, collections of cards that contain no set – in an entirely new way. It does not guarantee that researchers will find the absolute worst-case scenario, but they will find scenarios that are much worse than a random generation would yield.
Their work can help researchers understand how events might align in a way that leads to catastrophic failure.
For example, how vulnerable is the electrical grid to a malicious attacker who destroys select substations? Suppose that a bad collection of substations is one where they don’t form a connected grid. The worst-case scenario is now a very large number of substations that, when taken all together, still don’t yield a connected grid. The amount of substations excluded from this collection make up the smallest number a malicious actor needs to destroy to deliberately disconnect the grid.
The work of Ellenberg and his collaborators demonstrates yet another way that AI is a very powerful tool. But to solve very complex problems, at least for now, it still needs human ingenuity to guide it.
Small-scale solar power, also known as rooftop or distributed solar, has grown considerably in the U.S. over the past decade. It provides electricity without emitting air pollutants or climate-warming greenhouse gases, and it meets local energy demand without requiring costly investments in transmission and distribution systems.
However, its expansion is making it harder for electric utilities and power grid managers to design fair and efficient retail electricity rates – the prices that households pay.
Under traditional electricity pricing, customers pay one charge per kilowatt-hour of electricity consumption that covers both the energy they use and the fixed costs of maintaining the grid. As more people adopt rooftop solar, they buy less energy from the grid. Fewer customers are left to shoulder utilities’ fixed costs, potentially making power more expensive for everyone.
This trend can drive more customers to leave the system and raise prices further – a scenario known as the utility death spiral. One 2018 study calculated that two-thirds of recent electricity distribution cost increases at California’s three investor-owned utilities were associated with the growth of residential solar.
With abundant sun and solar-friendly policies, California has 36% of U.S. small-scale solar capacity, much more than any other state. And the state is engaged in a heated debate over pricing electricity in ways designed to make energy less expensive for low-income households.
We study energy markets and public policy affecting energy and the environment, and have analyzed various retail electricity rate structures and their economic impacts on power producers and consumers. Our key finding is that an income-based, fixed-charge rate structure of the type that California is currently considering offers the most efficient and equitable solution – if it is designed correctly.
The California Legislature approved fixed-rate electricity charges, based on income, in 2022. Now, state utility regulators are weighing a proposal that would formalize them.
Two-part power bills
The debate over fixed charges began in 2022, when the California Legislature enacted an energy bill that ordered state regulators to study income-based fixed charges and decide whether to adopt them by July 1, 2024. Then the state’s three largest utilities – Southern California Edison, Pacific Gas and Electric, and San Diego Gas & Electric – submitted a proposal to the state Public Utilities Commission in mid-2023 that would separate retail bills into two parts: a fixed charge and a variable charge.
The fixed charge would be a preset monthly fee, independent of energy usage but tied to income levels, so wealthier customers would pay a larger share of grid maintenance costs. The variable charge would be based on the amount of electricity consumed and would cover the actual costs of electricity production and delivery.
A two-part billing system that separates fixed costs from variable usage charges offers potential benefits for both consumers and utilities.
For utilities, the fixed charge offers a stable revenue stream. The companies know how many households they serve, and they can plan on the fixed amounts that those households will pay each month. Households that go solar would still pay the fixed charge, since most of them draw electricity from the grid when the sun doesn’t shine.
This approach provides financial stability for the utility and access to the grid for all. Consumers would benefit because with a certain amount of income guaranteed, utilities could charge significantly less per kilowatt-hour for the actual electricity that households use.
One significant concern is that if electricity costs less, people may use more of it, which could undermine efforts toward energy conservation and lead to an increase in emissions. In our view, the way to address this risk is by fine-tuning the two-part billing structure so that it covers only a portion of the utilities’ costs through fixed charges and incorporates the rest into the variable usage rates.
Put another way, combining a lower fixed charge with a higher variable charge would ensure that utilities can still cover their fixed costs effectively, while encouraging mindful energy use among consumers. Ensuring affordable electricity for consumers, fair cost recovery for utilities and overall fairness and efficiency in the energy market requires striking a delicate balance.
Another argument from critics, often labeled “energy socialism,” asserts that higher-income households might end up subsidizing excessive electricity use by lower-income households under the income-based rate structure. In our view, this perception is inaccurate.
Wealthy households would pay more to maintain the grid, via larger fixed charges, than poorer households, but would not subsidize lower-income households’ energy use. All income groups would pay the same rate for each additional kilowatt-hour of electricity that they use. Decisions on energy use would remain economically driven, regardless of consumers’ income level.
Fixed fees are too big
While our research supports California utilities’ approach in principle, we believe their proposal has shortcomings – notably in the proposed income brackets.
As currently framed, households with annual incomes between US$28,000 and $69,000 would pay a fixed fee of $20 to $34 per month. Households earning between $69,000 and $180,000 would pay $51 to $73 per month, and those earning more than $180,000 would pay $85 to $128.
The middle-income bracket starts just above California’s median household income. Consequently, nearly half of all California households could find themselves paying a substantial monthly fee – $51 to $73 – regardless of their actual electricity usage.
It could be hard to convince consumers to pay significant fixed fees for intangible services, especially middle-income residents who have either gone solar or may do so. Not surprisingly, the proposal has encountered considerable pushback from the solar industry.
Finding the sweet spot
In response to public outcry, California lawmakers recently introduced Assembly Bill 1999, which would replace the income-graduated fixed-charge requirement with fixed charges of $5 per month for low-income customers and up to $10 per month for others. In our view, this reaction goes too far in the other direction.
Capping fixed charges at such low levels would force utilities to hike their energy use rates to cover fixed costs – again, risking the death spiral scenario. Our research indicates that there is a range for the fixed charge that would cover a reasonable share of utilities’ fixed costs, but is not high enough to burden consumers.
Without utility cost data, we can’t pinpoint this range precisely. However, based on estimates of utilities’ costs, we believe the caps proposed in AB 1999 are too low and could end up unfairly burdening those the bill aims to protect.
In our research, based on a hypothetical case study, we found a sweet spot in which fixed charges cover about 40% of utilities’ fixed costs. Charges at this level provide maximum benefit to consumers, although they reduce energy producers’ profits.
Our findings are similar to an alternative proposal jointly presented by The Utility Reform Network, a nonprofit consumer advocacy organization, and the Natural Resources Defense Council, an environmental advocacy group. This plan suggests a two-part rate structure with an average fixed charge of about $36 per month. Low-income households would pay $5 per month, and those earning over $150,000 yearly would pay about $62.
We believe this proposal moves in the right direction by ensuring fair contributions to grid costs, while also encouraging efficient energy use and investment in clean energy infrastructure. It could act as a guide for other U.S. states searching for methods to balance utility fixed-cost recovery with fair pricing and continued growth of small-scale solar power.
This article has been updated to remove unsubstantiated information about the 2019 Saddleridge wildfire in California provided by AP in a photo caption.
The Dow Jones Index (US30) decreased by 0.41% as of Monday’s stock market close. The S&P 500 Index (US500) was down 0.31%. The NASDAQ Technology Index (US100) closed negative 0.27%. Stock indices declined moderately on Monday as some hawkish comments from the Federal Reserve pushed T-note yields up and stocks lower. Atlanta Fed President Bostic said that if the economy performs as expected, the Fed can be patient with interest rates, and he expects only one 25 bps rate cut this year. Bostic’s prediction is less than the three 25 bps rate cuts the FOMC has scheduled for this year. Fed spokeswoman Cook said yesterday that a cautious approach to monetary easing may be needed to restore price stability and that cutting interest rates too quickly could risk entrenching inflation. Markets rate the odds of a 25 bps rate cut at 13% for the next FOMC meeting on May 1 and 79% for the June 12 meeting.
Take-Two Interactive Software closed down more than 6% after gaming publication Kotaku reported that Grand Theft Auto VI production has begun to be delayed, and the game may not be released in 2025. Shares of United Airlines Holdings (UAL) fell more than 3% after a report that the US Federal Aviation Administration is considering imposing temporary sanctions on the company, including a ban on adding new routes, following a series of safety incidents. In addition, Intel (INTC) and Advanced Micro Devices (AMD) shares fell after the Financial Times reported that China is seeking to restrict US-made microprocessors and servers in government computers.
Equity markets in Europe mostly went up yesterday. Germany’s DAX (DE40) rose by 0.30%, France’s CAC 40 (FR40) closed Monday at its opening price, Spain’s IBEX 35 (ES35) added 0.08%, and the UK’s FTSE 100 (UK100) closed negative 0.17%. Frankfurt’s DAX (DE40) reached another record high of 18,268, gaining from the previous week and benefitting from dovish cues from major central banks. Increasing sentiment that policymakers are leaning towards rate cuts has led money markets to price in nearly a whole percentage point of ECB rate cuts this year ahead of the ECB meeting in early April. Automakers’ trading in Frankfurt rose sharply, with BMW and Volkswagen adding 2% and 1%, respectively, while Mercedes and Continental ended in the green territory. In addition, Allianz added more than 1%, leading to a positive session for the financial sector.
WTI crude oil prices rose above $82 per barrel on Tuesday, extending gains from the previous session, as various supply concerns supported oil prices. The Russian government ordered oil companies to cut production in the second quarter to meet OPEC’s target of 9 million bpd after output of around 9.5 million bpd in February. Ukrainian attacks on Russian refineries have also affected about 12% of the country’s refining capacity. In the Middle East, the UN Security Council passed a resolution calling for a ceasefire between Israel and Hamas. However, analysts doubt this will stop Houthi attacks on ships in the Red Sea disrupting supply routes.
Asian markets were mostly down yesterday. Japan’s Nikkei 225 (JP225) decreased by 1.16%, China’s FTSE China A50 (CHA50) lost 1.03%, Hong Kong’s Hang Seng (HK50) was down 0.93% at the end of Monday, while Australia’s ASX 200 (AU200) was positive 0.53%.
Japan’s annual business services inflation was unchanged at 2.1% in February, suggesting that companies continue to pass on rising labor costs to consumers thanks to the prospect of sustained wage growth. The annual increase in the service producer price index, which measures how much companies charge each other for services, was unchanged from January, data from the Bank of Japan (BoJ) showed Tuesday. Japan’s Finance Minister Shun’ichi Suzuki said he did not rule out taking any measures to curb yen weakness, adding that excessive volatility increases uncertainty for business operations and the broader economy. The remarks came a day after the country’s top currency diplomat, Masato Kanda, said the weakening yen did not reflect fundamentals and called recent moves speculative.
S&P 500 (US500) 5,218.19 −15.99 (−0.31%)
Dow Jones (US30) 39,313.64 −162.26 (−0.41%)
DAX (DE40) 18,261.31 +55.37 (+0.30%)
FTSE 100 (UK100) 7,917.57 −13.35 (−0.17%)
USD Index 104.23 −0.20 (−0.19%)
Important events today:
– Eurozone GfK German Consumer Climate (m/m) at 09:00 (GMT+2);
– US Durable Goods Orders (m/m) at 14:30 (GMT+2);
– US CB Consumer Confidence (m/m) at 16:00 (GMT+2).
This article reflects a personal opinion and should not be interpreted as an investment advice, and/or offer, and/or a persistent request for carrying out financial transactions, and/or a guarantee, and/or a forecast of future events.


 Healthy corals like these on Australia’s Lady Elliot Reef could disappear by the 2030s if climate change is not curbed.


 Can you find a matching set?

