By InvestMacro
Here are the latest charts and statistics for the Commitment of Traders (COT) data published by the Commodities Futures Trading Commission (CFTC).
The latest COT data is updated through Tuesday April 16th and shows a quick view of how large market participants (for-profit speculators and commercial traders) were positioned in the futures markets. All currency positions are in direct relation to the US dollar where, for example, a bet for the euro is a bet that the euro will rise versus the dollar while a bet against the euro will be a bet that the euro will decline versus the dollar.
Weekly Speculator Changes led by Brazilian Real & New Zealand Dollar
The COT currency market speculator bets were lower this week as just three out of the eleven currency markets we cover had higher positioning while the other eight markets had lower speculator contracts.
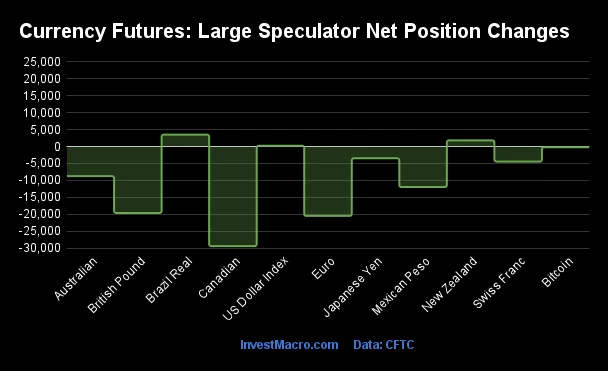
Leading the gains for the currency markets was the Brazilian Real (3,517 contracts) with the New Zealand Dollar (1,821 contracts) and the US Dollar Index (213 contracts) also showing positive weeks.
The currencies seeing declines in speculator bets on the week were the Canadian Dollar (-29,430 contracts), the EuroFX (-20,499 contracts), the British Pound (-19,633 contracts), the Mexican Peso (-11,960 contracts), the Australian Dollar (-8,742 contracts), the Swiss Franc (-4,448 contracts), the Japanese Yen (-3,468 contracts) and with Bitcoin (-210 contracts) also registering lower bets on the week.
Speculators strongly boosting US Dollar bets vs Major Currencies
Highlighting the COT currency’s data this week is the overall strength being shown in the speculator’s positioning for the US dollar.
The way the futures markets work for currencies is that every bet for or against a currency is also a bet for against the US dollar. Right now, most of the major currencies are strongly on the defensive in their exchange rates and, especially, in their speculator positions versus the US dollar, underlining the strength of the sentiment for the US currency.
Here are current highlights of the major currencies weakness (US dollar strength):
First up, the Australian dollar (AUD) speculator position is currently over -100,000 contracts for the fourth time out of the last 5 weeks. The all-time record low was reached just last month on March 19th at a total of -107,538 contracts.
The British pound sterling (GBP) contracts have now fallen for four out of the last 5 weeks with the contract level currently at its lowest point since November.
The euro (EUR) currency contracts have decreased in four of the last five weeks as well. The current level is barely positive (+12,224 contracts), falling rapidly (started the year over +100,000 contracts) and now at the lowest level since 2022.
The Japanese yen (JPY) contracts continued to fall this week and have dropped in 13 out of the last 14 weeks. At a total of -165,619 contracts, the current position is at a new lowest standing since 2007.
The Swiss franc (CHF) position has been falling sharply as well. The speculative position for the franc has now declined for 11 consecutive weeks and is at the lowest level since 2019 at -36,212 contracts.
Finally, the Canadian dollar (CAD) has fallen for eight consecutive weeks with a drop this week of -29,430 contracts. The total decrease over just the last 8 weeks has amounted to approximately -82,000 contracts and has brought the current speculative level to the lowest point since 2017.
Helping to keep the US dollar strong is the fading expectations of multiple rate cuts from the Federal Reserve. Inflation levels continue to persist in a growing US economy, putting a dent into this year’s rate cut narrative and giving the USD an interest-rate differential boost against it’s major currency counterparts.
The exchange rates of the major currencies are also in a current short-term downtrend vs the USD. The AUD, NZD, GBP, EUR and CHF exchange rates all have dipped this week to the lowest levels since October or November in the latest spot trading data. The JPY, meanwhile, is currently trading at the lowest levels in 34-years.
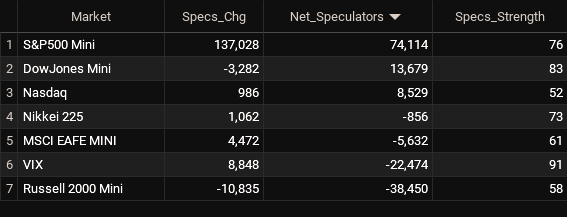
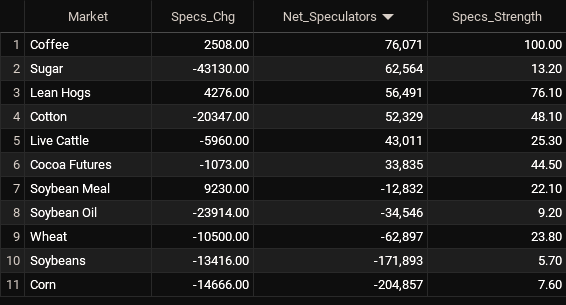
Currencies Net Speculators Leaderboard
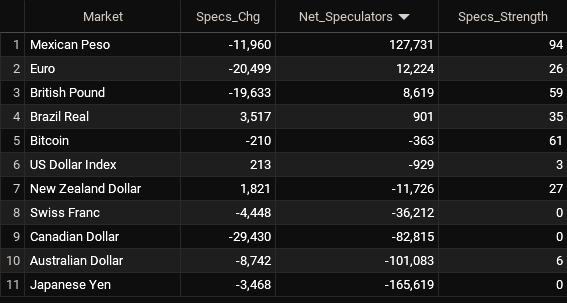
Legend: Weekly Speculators Change | Speculators Current Net Position | Speculators Strength Score compared to last 3-Years (0-100 range)
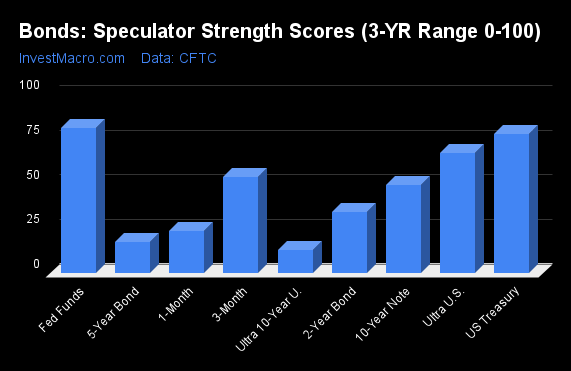
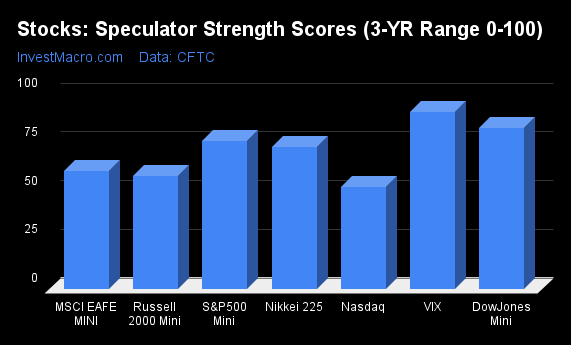
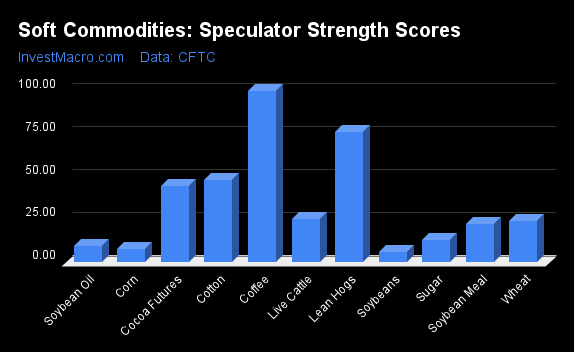
Strength Scores led by Mexican Peso & Bitcoin
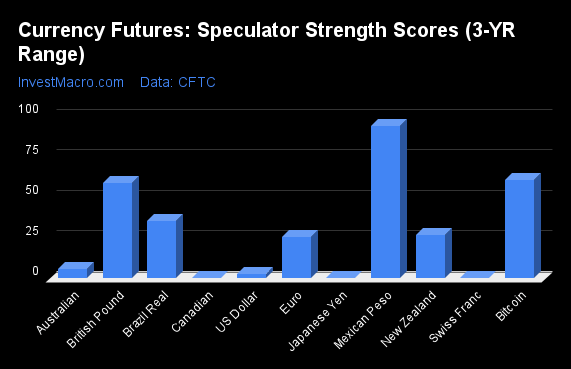
COT Strength Scores (a normalized measure of Speculator positions over a 3-Year range, from 0 to 100 where above 80 is Extreme-Bullish and below 20 is Extreme-Bearish) showed that the Mexican Peso (94 percent) and the Bitcoin (61 percent) lead the currency markets this week. The British Pound (59 percent) comes in as the next highest in the weekly strength scores.
On the downside, the Canadian Dollar (0 percent), the Swiss Franc (0 percent), the Japanese Yen (0 percent), the US Dollar Index (3 percent) and the Australian Dollar (6 percent) come in at the lowest strength levels currently and are all in Extreme-Bearish territory (below 20 percent).
Strength Statistics:
US Dollar Index (2.9 percent) vs US Dollar Index previous week (2.5 percent)
EuroFX (25.5 percent) vs EuroFX previous week (34.2 percent)
British Pound Sterling (59.0 percent) vs British Pound Sterling previous week (72.0 percent)
Japanese Yen (0.0 percent) vs Japanese Yen previous week (2.4 percent)
Swiss Franc (0.0 percent) vs Swiss Franc previous week (8.9 percent)
Canadian Dollar (0.0 percent) vs Canadian Dollar previous week (22.4 percent)
Australian Dollar (5.8 percent) vs Australian Dollar previous week (13.7 percent)
New Zealand Dollar (27.1 percent) vs New Zealand Dollar previous week (21.9 percent)
Mexican Peso (94.1 percent) vs Mexican Peso previous week (100.0 percent)
Brazilian Real (35.4 percent) vs Brazilian Real previous week (30.8 percent)
Bitcoin (60.9 percent) vs Bitcoin previous week (64.1 percent)
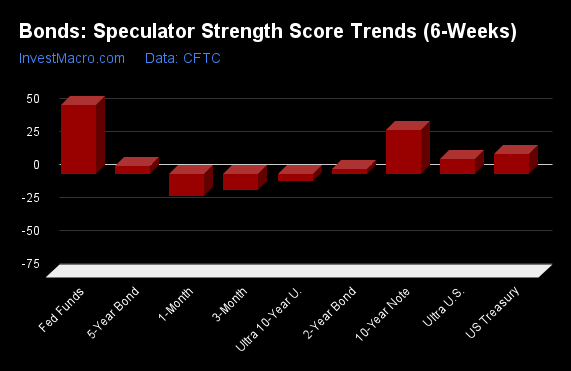
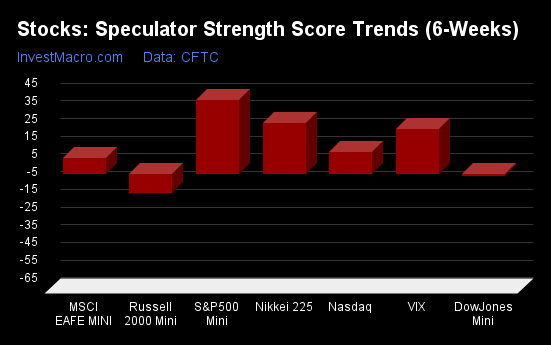
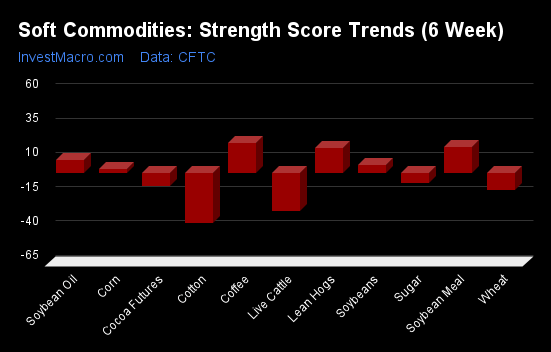
Bitcoin & Mexican Peso top the 6-Week Strength Trends
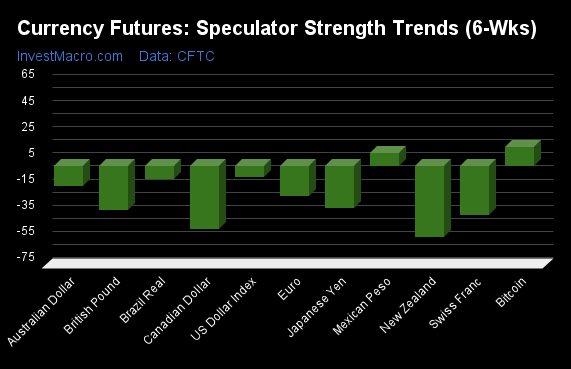
COT Strength Score Trends (or move index, calculates the 6-week changes in strength scores) showed that Bitcoin (15 percent) and the Mexican Peso (10 percent) lead the past six weeks trends for the currencies and are the only markets with positive trends at the moment.
The New Zealand Dollar (-54 percent) leads the downside trend scores currently with the Canadian Dollar (-48 percent), Swiss Franc (-37 percent) and the British Pound (-33 percent) following next with lower trend scores.
Strength Trend Statistics:
US Dollar Index (-8.5 percent) vs US Dollar Index previous week (-6.8 percent)
EuroFX (-23.0 percent) vs EuroFX previous week (-12.8 percent)
British Pound Sterling (-33.0 percent) vs British Pound Sterling previous week (-12.0 percent)
Japanese Yen (-32.1 percent) vs Japanese Yen previous week (-20.2 percent)
Swiss Franc (-37.5 percent) vs Swiss Franc previous week (-39.8 percent)
Canadian Dollar (-47.9 percent) vs Canadian Dollar previous week (-39.5 percent)
Australian Dollar (-14.8 percent) vs Australian Dollar previous week (-11.9 percent)
New Zealand Dollar (-53.8 percent) vs New Zealand Dollar previous week (-67.0 percent)
Mexican Peso (10.4 percent) vs Mexican Peso previous week (22.5 percent)
Brazilian Real (-9.6 percent) vs Brazilian Real previous week (-26.2 percent)
Bitcoin (14.9 percent) vs Bitcoin previous week (27.3 percent)
Individual COT Forex Markets:
US Dollar Index Futures:
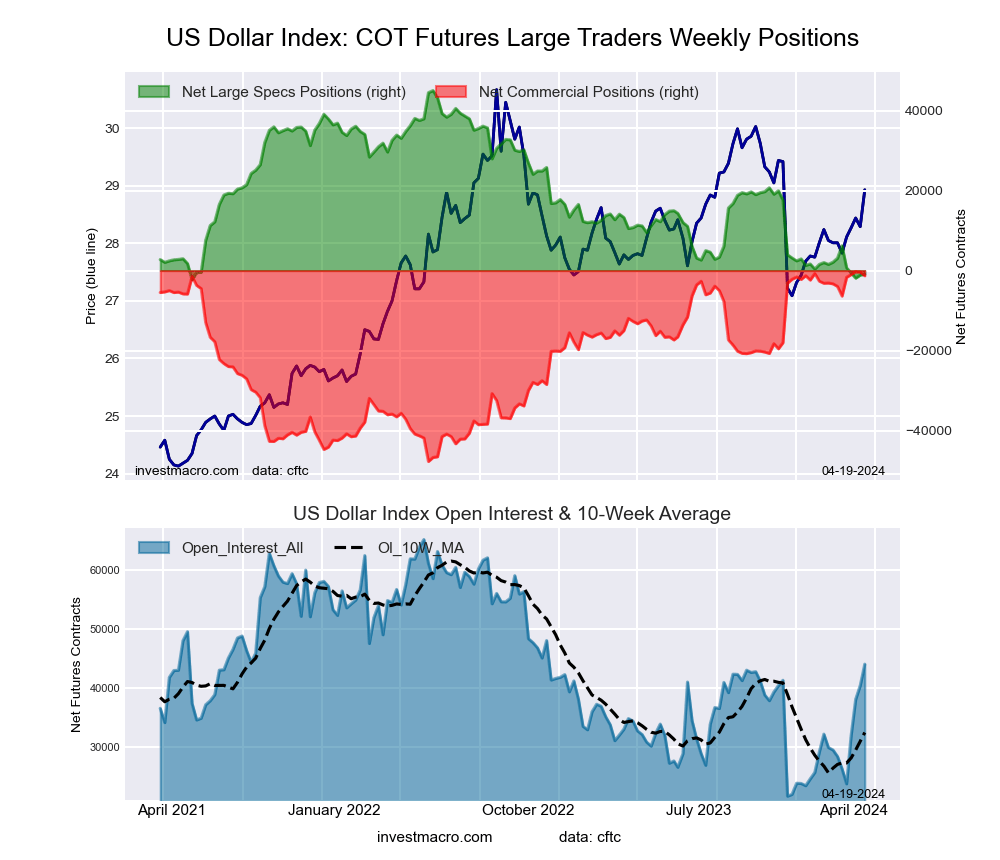 The US Dollar Index large speculator standing this week resulted in a net position of -929 contracts in the data reported through Tuesday. This was a weekly gain of 213 contracts from the previous week which had a total of -1,142 net contracts.
This week’s current strength score (the trader positioning range over the past three years, measured from 0 to 100) shows the speculators are currently Bearish-Extreme with a score of 2.9 percent. The commercials are Bullish-Extreme with a score of 97.9 percent and the small traders (not shown in chart) are Bearish with a score of 37.2 percent.
Price Trend-Following Model: Strong Uptrend
Our weekly trend-following model classifies the current market price position as: Strong Uptrend. The current action for the model is considered to be: New Buy – Long Position.
| US DOLLAR INDEX Statistics | SPECULATORS | COMMERCIALS | SMALL TRADERS |
| – Percent of Open Interest Longs: | 67.9 | 18.2 | 10.4 |
| – Percent of Open Interest Shorts: | 70.0 | 21.2 | 5.4 |
| – Net Position: | -929 | -1,309 | 2,238 |
| – Gross Longs: | 29,911 | 8,040 | 4,596 |
| – Gross Shorts: | 30,840 | 9,349 | 2,358 |
| – Long to Short Ratio: | 1.0 to 1 | 0.9 to 1 | 1.9 to 1 |
| NET POSITION TREND: | |||
| – Strength Index Score (3 Year Range Pct): | 2.9 | 97.9 | 37.2 |
| – Strength Index Reading (3 Year Range): | Bearish-Extreme | Bullish-Extreme | Bearish |
| NET POSITION MOVEMENT INDEX: | |||
| – 6-Week Change in Strength Index: | -8.5 | 5.6 | 15.9 |
Euro Currency Futures:
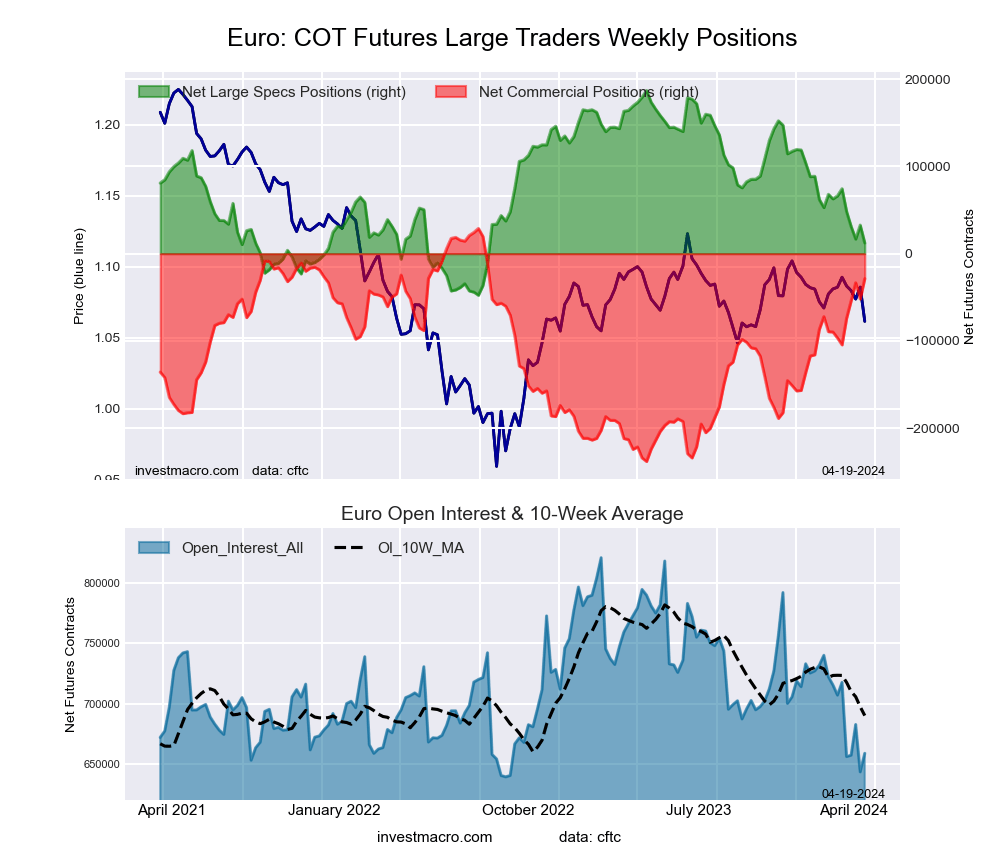 The Euro Currency large speculator standing this week resulted in a net position of 12,224 contracts in the data reported through Tuesday. This was a weekly decrease of -20,499 contracts from the previous week which had a total of 32,723 net contracts.
This week’s current strength score (the trader positioning range over the past three years, measured from 0 to 100) shows the speculators are currently Bearish with a score of 25.5 percent. The commercials are Bullish with a score of 78.5 percent and the small traders (not shown in chart) are Bearish-Extreme with a score of 5.2 percent.
Price Trend-Following Model: Strong Downtrend
Our weekly trend-following model classifies the current market price position as: Strong Downtrend. The current action for the model is considered to be: Hold – Maintain Short Position.
| EURO Currency Statistics | SPECULATORS | COMMERCIALS | SMALL TRADERS |
| – Percent of Open Interest Longs: | 27.2 | 60.1 | 11.2 |
| – Percent of Open Interest Shorts: | 25.3 | 64.4 | 8.7 |
| – Net Position: | 12,224 | -28,654 | 16,430 |
| – Gross Longs: | 178,912 | 395,979 | 73,794 |
| – Gross Shorts: | 166,688 | 424,633 | 57,364 |
| – Long to Short Ratio: | 1.1 to 1 | 0.9 to 1 | 1.3 to 1 |
| NET POSITION TREND: | |||
| – Strength Index Score (3 Year Range Pct): | 25.5 | 78.5 | 5.2 |
| – Strength Index Reading (3 Year Range): | Bearish | Bullish | Bearish-Extreme |
| NET POSITION MOVEMENT INDEX: | |||
| – 6-Week Change in Strength Index: | -23.0 | 25.5 | -22.4 |
British Pound Sterling Futures:
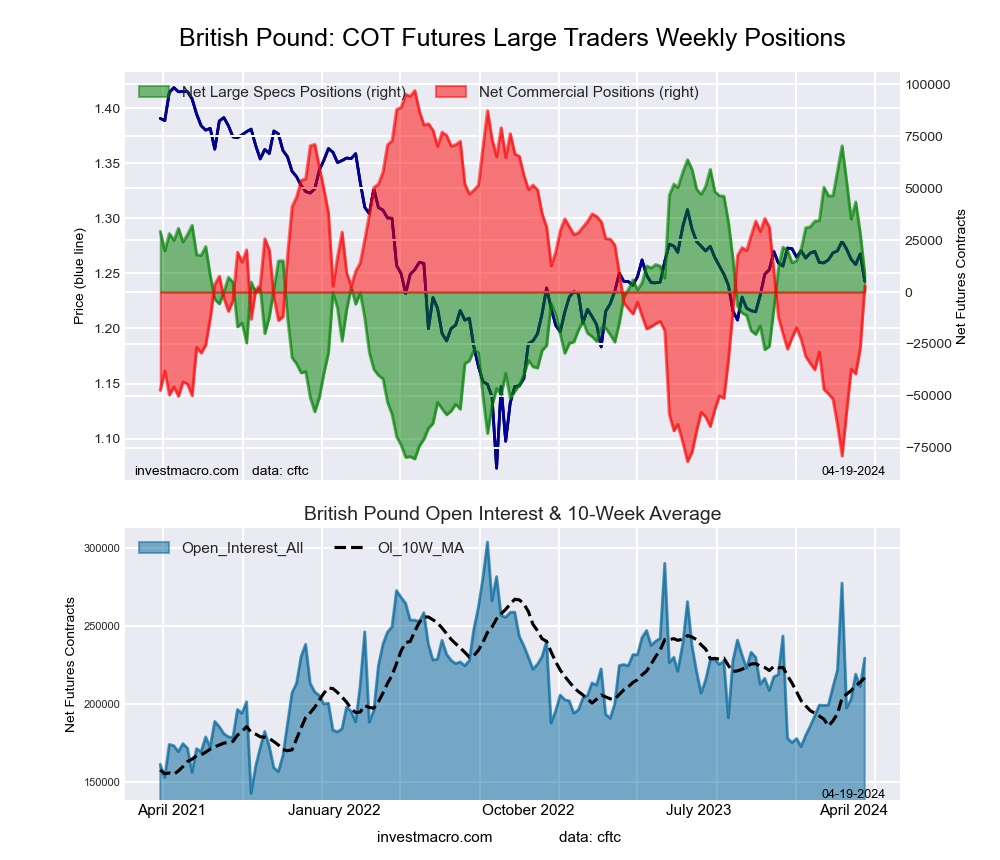 The British Pound Sterling large speculator standing this week resulted in a net position of 8,619 contracts in the data reported through Tuesday. This was a weekly decline of -19,633 contracts from the previous week which had a total of 28,252 net contracts.
This week’s current strength score (the trader positioning range over the past three years, measured from 0 to 100) shows the speculators are currently Bullish with a score of 59.0 percent. The commercials are Bearish with a score of 47.3 percent and the small traders (not shown in chart) are Bearish with a score of 35.3 percent.
Price Trend-Following Model: Strong Downtrend
Our weekly trend-following model classifies the current market price position as: Strong Downtrend. The current action for the model is considered to be: Hold – Maintain Short Position.
| BRITISH POUND Statistics | SPECULATORS | COMMERCIALS | SMALL TRADERS |
| – Percent of Open Interest Longs: | 31.3 | 56.6 | 9.5 |
| – Percent of Open Interest Shorts: | 27.5 | 55.4 | 14.5 |
| – Net Position: | 8,619 | 2,972 | -11,591 |
| – Gross Longs: | 71,800 | 129,957 | 21,721 |
| – Gross Shorts: | 63,181 | 126,985 | 33,312 |
| – Long to Short Ratio: | 1.1 to 1 | 1.0 to 1 | 0.7 to 1 |
| NET POSITION TREND: | |||
| – Strength Index Score (3 Year Range Pct): | 59.0 | 47.3 | 35.3 |
| – Strength Index Reading (3 Year Range): | Bullish | Bearish | Bearish |
| NET POSITION MOVEMENT INDEX: | |||
| – 6-Week Change in Strength Index: | -33.0 | 37.6 | -34.0 |
Japanese Yen Futures:
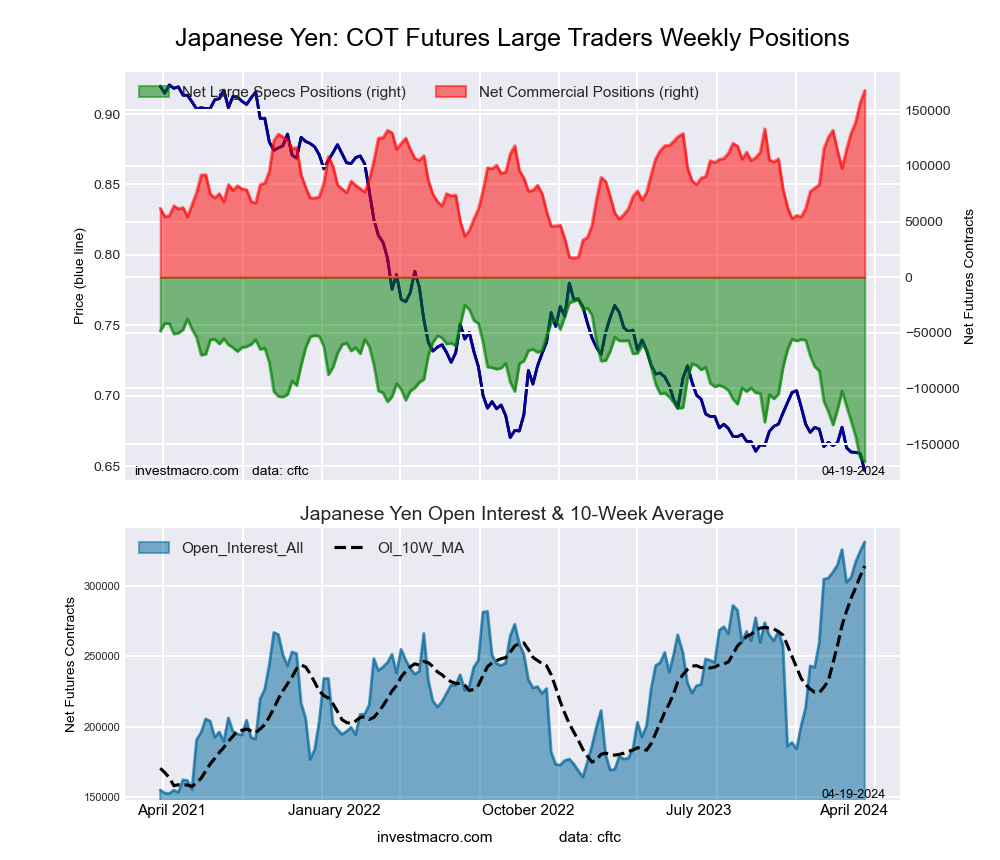 The Japanese Yen large speculator standing this week resulted in a net position of -165,619 contracts in the data reported through Tuesday. This was a weekly reduction of -3,468 contracts from the previous week which had a total of -162,151 net contracts.
This week’s current strength score (the trader positioning range over the past three years, measured from 0 to 100) shows the speculators are currently Bearish-Extreme with a score of 0.0 percent. The commercials are Bullish-Extreme with a score of 100.0 percent and the small traders (not shown in chart) are Bullish with a score of 75.9 percent.
Price Trend-Following Model: Strong Downtrend
Our weekly trend-following model classifies the current market price position as: Strong Downtrend. The current action for the model is considered to be: Hold – Maintain Short Position.
| JAPANESE YEN Statistics | SPECULATORS | COMMERCIALS | SMALL TRADERS |
| – Percent of Open Interest Longs: | 14.9 | 69.7 | 13.7 |
| – Percent of Open Interest Shorts: | 65.0 | 19.0 | 14.3 |
| – Net Position: | -165,619 | 167,742 | -2,123 |
| – Gross Longs: | 49,463 | 230,642 | 45,373 |
| – Gross Shorts: | 215,082 | 62,900 | 47,496 |
| – Long to Short Ratio: | 0.2 to 1 | 3.7 to 1 | 1.0 to 1 |
| NET POSITION TREND: | |||
| – Strength Index Score (3 Year Range Pct): | 0.0 | 100.0 | 75.9 |
| – Strength Index Reading (3 Year Range): | Bearish-Extreme | Bullish-Extreme | Bullish |
| NET POSITION MOVEMENT INDEX: | |||
| – 6-Week Change in Strength Index: | -32.1 | 36.0 | -23.4 |
Swiss Franc Futures:
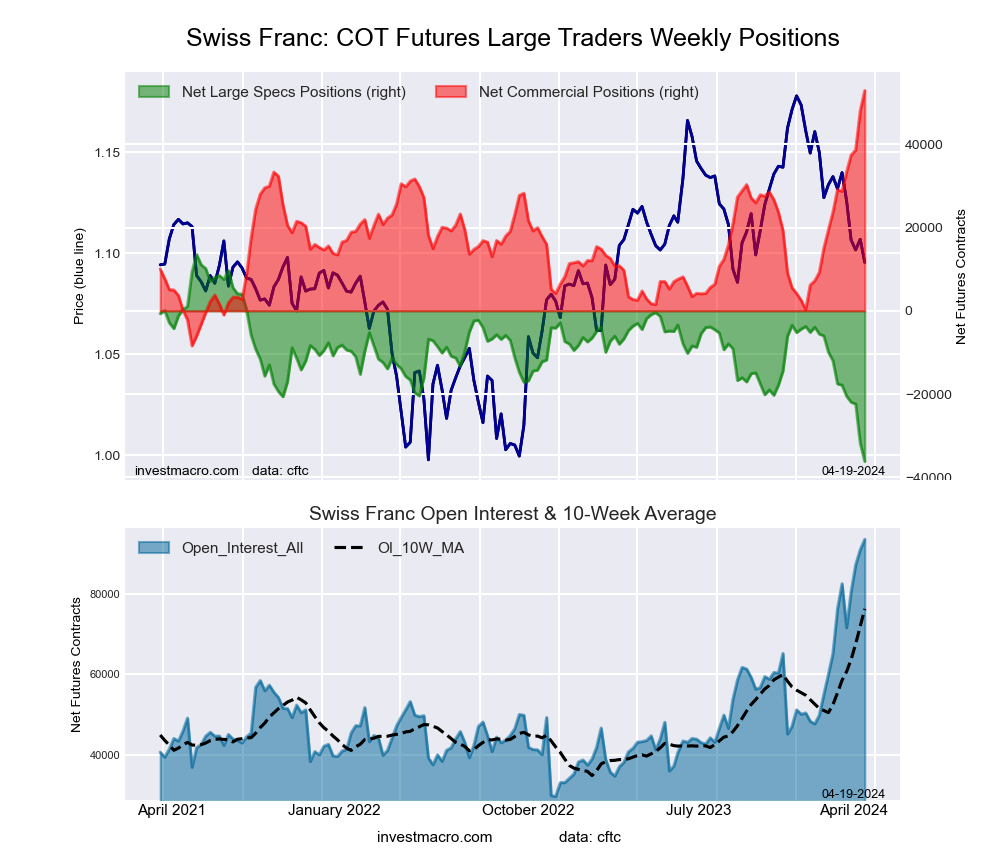 The Swiss Franc large speculator standing this week resulted in a net position of -36,212 contracts in the data reported through Tuesday. This was a weekly decline of -4,448 contracts from the previous week which had a total of -31,764 net contracts.
This week’s current strength score (the trader positioning range over the past three years, measured from 0 to 100) shows the speculators are currently Bearish-Extreme with a score of 0.0 percent. The commercials are Bullish-Extreme with a score of 100.0 percent and the small traders (not shown in chart) are Bearish-Extreme with a score of 1.1 percent.
Price Trend-Following Model: Strong Downtrend
Our weekly trend-following model classifies the current market price position as: Strong Downtrend. The current action for the model is considered to be: Hold – Maintain Short Position.
| SWISS FRANC Statistics | SPECULATORS | COMMERCIALS | SMALL TRADERS |
| – Percent of Open Interest Longs: | 15.7 | 74.3 | 10.0 |
| – Percent of Open Interest Shorts: | 54.4 | 17.6 | 27.9 |
| – Net Position: | -36,212 | 52,956 | -16,744 |
| – Gross Longs: | 14,650 | 69,412 | 9,349 |
| – Gross Shorts: | 50,862 | 16,456 | 26,093 |
| – Long to Short Ratio: | 0.3 to 1 | 4.2 to 1 | 0.4 to 1 |
| NET POSITION TREND: | |||
| – Strength Index Score (3 Year Range Pct): | 0.0 | 100.0 | 1.1 |
| – Strength Index Reading (3 Year Range): | Bearish-Extreme | Bullish-Extreme | Bearish-Extreme |
| NET POSITION MOVEMENT INDEX: | |||
| – 6-Week Change in Strength Index: | -37.5 | 38.8 | -23.3 |
Canadian Dollar Futures:
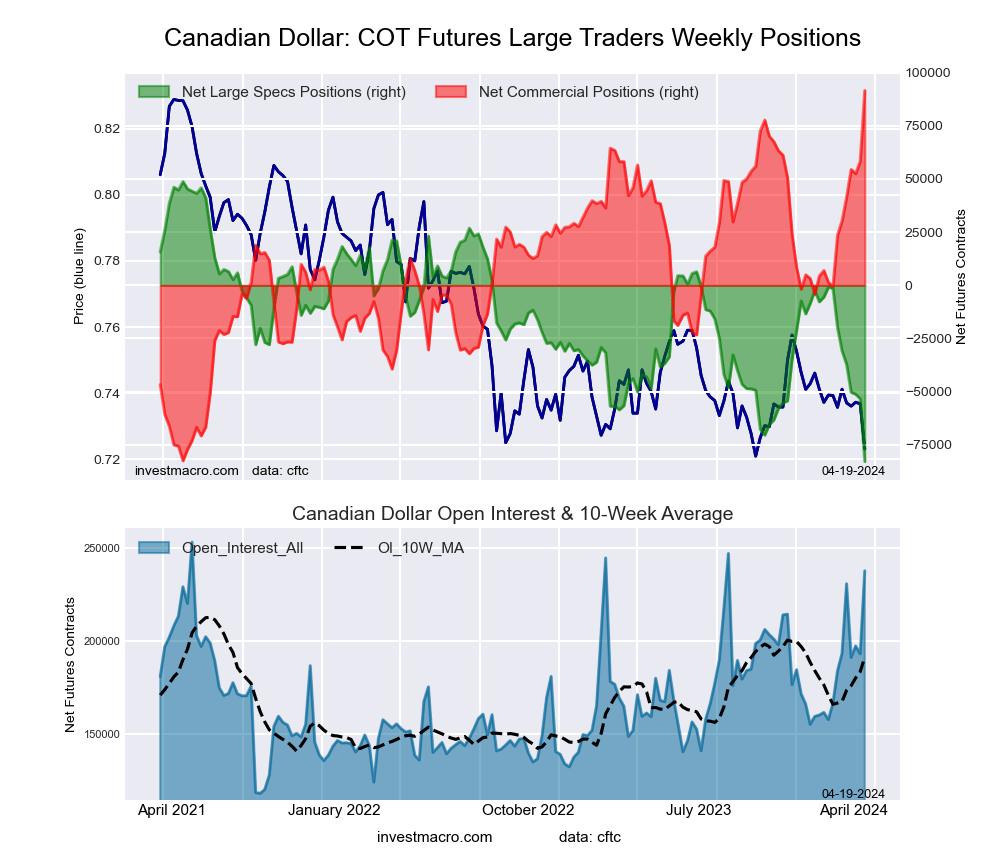 The Canadian Dollar large speculator standing this week resulted in a net position of -82,815 contracts in the data reported through Tuesday. This was a weekly fall of -29,430 contracts from the previous week which had a total of -53,385 net contracts.
This week’s current strength score (the trader positioning range over the past three years, measured from 0 to 100) shows the speculators are currently Bearish-Extreme with a score of 0.0 percent. The commercials are Bullish-Extreme with a score of 100.0 percent and the small traders (not shown in chart) are Bearish-Extreme with a score of 3.4 percent.
Price Trend-Following Model: Strong Downtrend
Our weekly trend-following model classifies the current market price position as: Strong Downtrend. The current action for the model is considered to be: Hold – Maintain Short Position.
| CANADIAN DOLLAR Statistics | SPECULATORS | COMMERCIALS | SMALL TRADERS |
| – Percent of Open Interest Longs: | 15.6 | 70.2 | 11.6 |
| – Percent of Open Interest Shorts: | 50.5 | 31.7 | 15.3 |
| – Net Position: | -82,815 | 91,572 | -8,757 |
| – Gross Longs: | 37,067 | 166,834 | 27,645 |
| – Gross Shorts: | 119,882 | 75,262 | 36,402 |
| – Long to Short Ratio: | 0.3 to 1 | 2.2 to 1 | 0.8 to 1 |
| NET POSITION TREND: | |||
| – Strength Index Score (3 Year Range Pct): | 0.0 | 100.0 | 3.4 |
| – Strength Index Reading (3 Year Range): | Bearish-Extreme | Bullish-Extreme | Bearish-Extreme |
| NET POSITION MOVEMENT INDEX: | |||
| – 6-Week Change in Strength Index: | -47.9 | 39.1 | -11.2 |
Australian Dollar Futures:
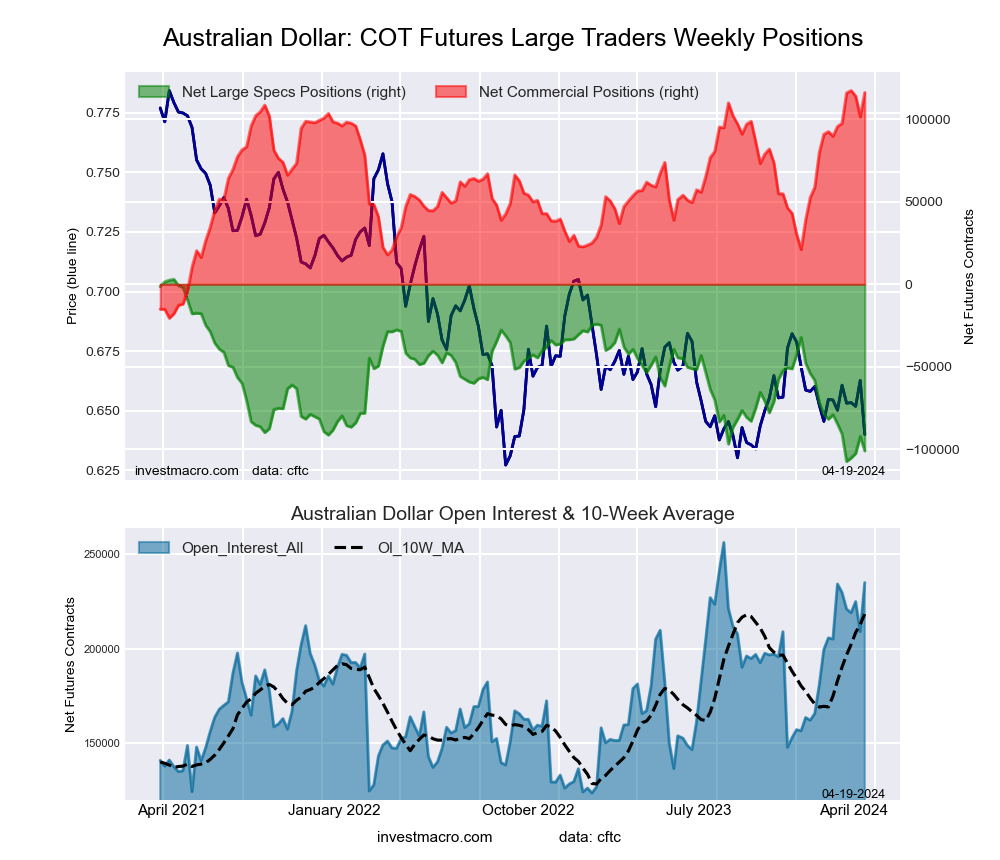 The Australian Dollar large speculator standing this week resulted in a net position of -101,083 contracts in the data reported through Tuesday. This was a weekly lowering of -8,742 contracts from the previous week which had a total of -92,341 net contracts.
This week’s current strength score (the trader positioning range over the past three years, measured from 0 to 100) shows the speculators are currently Bearish-Extreme with a score of 5.8 percent. The commercials are Bullish-Extreme with a score of 99.1 percent and the small traders (not shown in chart) are Bearish-Extreme with a score of 15.7 percent.
Price Trend-Following Model: Strong Downtrend
Our weekly trend-following model classifies the current market price position as: Strong Downtrend. The current action for the model is considered to be: Hold – Maintain Short Position.
| AUSTRALIAN DOLLAR Statistics | SPECULATORS | COMMERCIALS | SMALL TRADERS |
| – Percent of Open Interest Longs: | 18.0 | 72.1 | 7.7 |
| – Percent of Open Interest Shorts: | 61.1 | 22.6 | 14.2 |
| – Net Position: | -101,083 | 116,344 | -15,261 |
| – Gross Longs: | 42,365 | 169,334 | 18,142 |
| – Gross Shorts: | 143,448 | 52,990 | 33,403 |
| – Long to Short Ratio: | 0.3 to 1 | 3.2 to 1 | 0.5 to 1 |
| NET POSITION TREND: | |||
| – Strength Index Score (3 Year Range Pct): | 5.8 | 99.1 | 15.7 |
| – Strength Index Reading (3 Year Range): | Bearish-Extreme | Bullish-Extreme | Bearish-Extreme |
| NET POSITION MOVEMENT INDEX: | |||
| – 6-Week Change in Strength Index: | -14.8 | 14.9 | -10.7 |
New Zealand Dollar Futures:
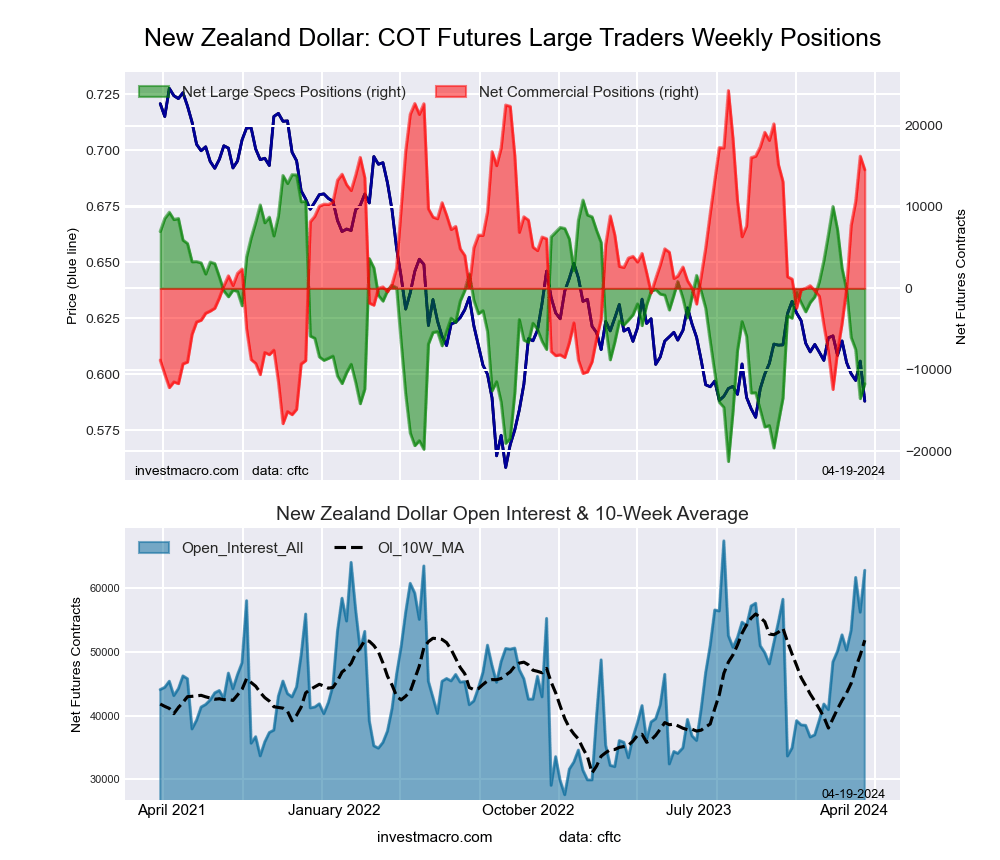 The New Zealand Dollar large speculator standing this week resulted in a net position of -11,726 contracts in the data reported through Tuesday. This was a weekly lift of 1,821 contracts from the previous week which had a total of -13,547 net contracts.
This week’s current strength score (the trader positioning range over the past three years, measured from 0 to 100) shows the speculators are currently Bearish with a score of 27.1 percent. The commercials are Bullish with a score of 76.2 percent and the small traders (not shown in chart) are Bearish-Extreme with a score of 17.5 percent.
Price Trend-Following Model: Strong Downtrend
Our weekly trend-following model classifies the current market price position as: Strong Downtrend. The current action for the model is considered to be: Hold – Maintain Short Position.
| NEW ZEALAND DOLLAR Statistics | SPECULATORS | COMMERCIALS | SMALL TRADERS |
| – Percent of Open Interest Longs: | 28.7 | 65.5 | 5.2 |
| – Percent of Open Interest Shorts: | 47.3 | 42.4 | 9.7 |
| – Net Position: | -11,726 | 14,570 | -2,844 |
| – Gross Longs: | 18,019 | 41,195 | 3,272 |
| – Gross Shorts: | 29,745 | 26,625 | 6,116 |
| – Long to Short Ratio: | 0.6 to 1 | 1.5 to 1 | 0.5 to 1 |
| NET POSITION TREND: | |||
| – Strength Index Score (3 Year Range Pct): | 27.1 | 76.2 | 17.5 |
| – Strength Index Reading (3 Year Range): | Bearish | Bullish | Bearish-Extreme |
| NET POSITION MOVEMENT INDEX: | |||
| – 6-Week Change in Strength Index: | -53.8 | 54.6 | -43.9 |
Mexican Peso Futures:
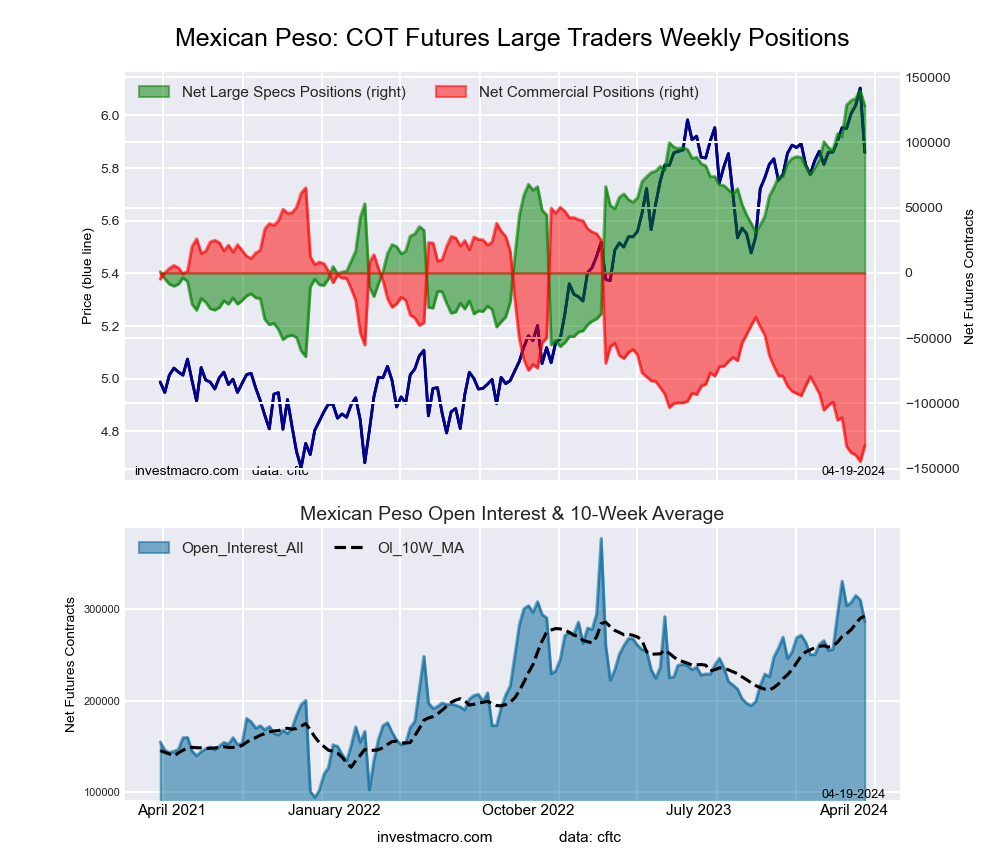 The Mexican Peso large speculator standing this week resulted in a net position of 127,731 contracts in the data reported through Tuesday. This was a weekly decline of -11,960 contracts from the previous week which had a total of 139,691 net contracts.
This week’s current strength score (the trader positioning range over the past three years, measured from 0 to 100) shows the speculators are currently Bullish-Extreme with a score of 94.1 percent. The commercials are Bearish-Extreme with a score of 5.9 percent and the small traders (not shown in chart) are Bearish with a score of 39.2 percent.
Price Trend-Following Model: Weak Uptrend
Our weekly trend-following model classifies the current market price position as: Weak Uptrend. The current action for the model is considered to be: Hold – Maintain Long Position.
| MEXICAN PESO Statistics | SPECULATORS | COMMERCIALS | SMALL TRADERS |
| – Percent of Open Interest Longs: | 60.3 | 36.7 | 2.6 |
| – Percent of Open Interest Shorts: | 15.7 | 82.8 | 1.0 |
| – Net Position: | 127,731 | -132,119 | 4,388 |
| – Gross Longs: | 172,573 | 105,028 | 7,388 |
| – Gross Shorts: | 44,842 | 237,147 | 3,000 |
| – Long to Short Ratio: | 3.8 to 1 | 0.4 to 1 | 2.5 to 1 |
| NET POSITION TREND: | |||
| – Strength Index Score (3 Year Range Pct): | 94.1 | 5.9 | 39.2 |
| – Strength Index Reading (3 Year Range): | Bullish-Extreme | Bearish-Extreme | Bearish |
| NET POSITION MOVEMENT INDEX: | |||
| – 6-Week Change in Strength Index: | 10.4 | -9.3 | -11.1 |
Brazilian Real Futures:
 The Brazilian Real large speculator standing this week resulted in a net position of 901 contracts in the data reported through Tuesday. This was a weekly increase of 3,517 contracts from the previous week which had a total of -2,616 net contracts.
This week’s current strength score (the trader positioning range over the past three years, measured from 0 to 100) shows the speculators are currently Bearish with a score of 35.4 percent. The commercials are Bullish with a score of 65.3 percent and the small traders (not shown in chart) are Bearish with a score of 41.0 percent.
Price Trend-Following Model: Strong Downtrend
Our weekly trend-following model classifies the current market price position as: Strong Downtrend. The current action for the model is considered to be: Hold – Maintain Short Position.
| BRAZIL REAL Statistics | SPECULATORS | COMMERCIALS | SMALL TRADERS |
| – Percent of Open Interest Longs: | 60.7 | 30.9 | 4.7 |
| – Percent of Open Interest Shorts: | 59.2 | 33.6 | 3.5 |
| – Net Position: | 901 | -1,605 | 704 |
| – Gross Longs: | 35,812 | 18,203 | 2,752 |
| – Gross Shorts: | 34,911 | 19,808 | 2,048 |
| – Long to Short Ratio: | 1.0 to 1 | 0.9 to 1 | 1.3 to 1 |
| NET POSITION TREND: | |||
| – Strength Index Score (3 Year Range Pct): | 35.4 | 65.3 | 41.0 |
| – Strength Index Reading (3 Year Range): | Bearish | Bullish | Bearish |
| NET POSITION MOVEMENT INDEX: | |||
| – 6-Week Change in Strength Index: | -9.6 | 12.2 | -20.3 |
Bitcoin Futures:
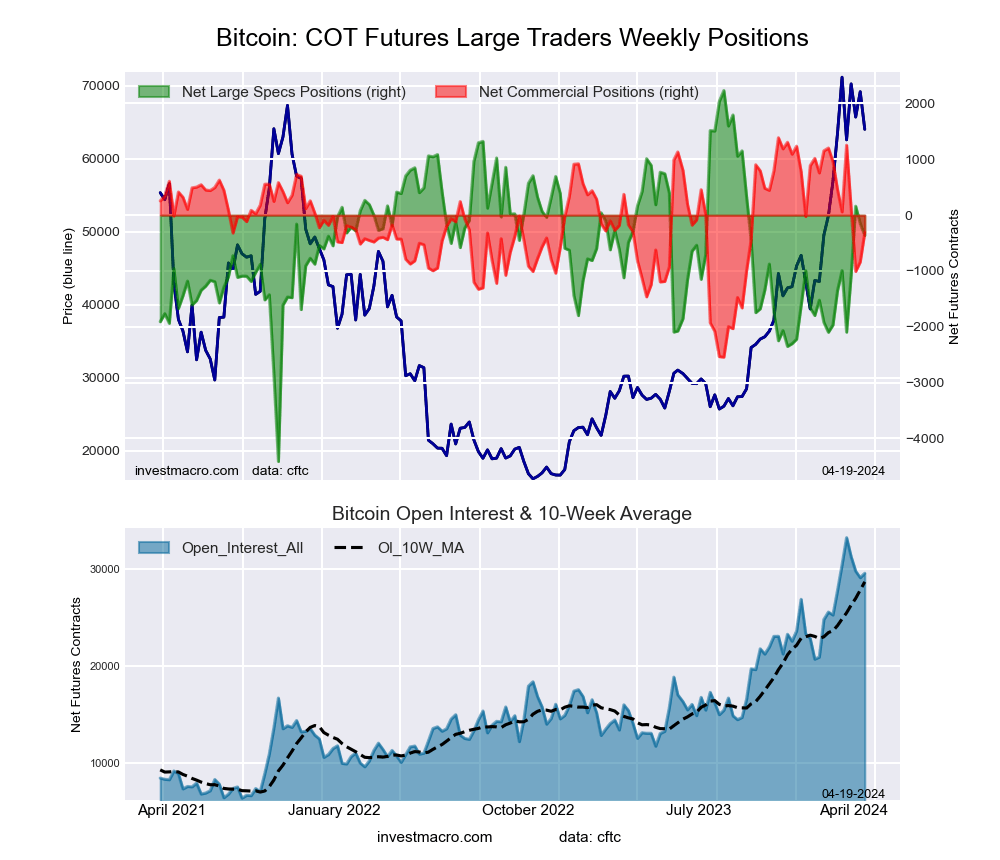 The Bitcoin large speculator standing this week resulted in a net position of -363 contracts in the data reported through Tuesday. This was a weekly fall of -210 contracts from the previous week which had a total of -153 net contracts.
This week’s current strength score (the trader positioning range over the past three years, measured from 0 to 100) shows the speculators are currently Bullish with a score of 60.9 percent. The commercials are Bullish with a score of 56.7 percent and the small traders (not shown in chart) are Bearish with a score of 28.3 percent.
Price Trend-Following Model: Uptrend
Our weekly trend-following model classifies the current market price position as: Uptrend. The current action for the model is considered to be: Hold – Maintain Long Position.
| BITCOIN Statistics | SPECULATORS | COMMERCIALS | SMALL TRADERS |
| – Percent of Open Interest Longs: | 75.7 | 5.1 | 5.2 |
| – Percent of Open Interest Shorts: | 76.9 | 6.2 | 2.9 |
| – Net Position: | -363 | -313 | 676 |
| – Gross Longs: | 22,339 | 1,513 | 1,532 |
| – Gross Shorts: | 22,702 | 1,826 | 856 |
| – Long to Short Ratio: | 1.0 to 1 | 0.8 to 1 | 1.8 to 1 |
| NET POSITION TREND: | |||
| – Strength Index Score (3 Year Range Pct): | 60.9 | 56.7 | 28.3 |
| – Strength Index Reading (3 Year Range): | Bullish | Bullish | Bearish |
| NET POSITION MOVEMENT INDEX: | |||
| – 6-Week Change in Strength Index: | 14.9 | -19.7 | -4.9 |
Article By InvestMacro – Receive our weekly COT Newsletter
*COT Report: The COT data, released weekly to the public each Friday, is updated through the most recent Tuesday (data is 3 days old) and shows a quick view of how large speculators or non-commercials (for-profit traders) were positioned in the futures markets.
The CFTC categorizes trader positions according to commercial hedgers (traders who use futures contracts for hedging as part of the business), non-commercials (large traders who speculate to realize trading profits) and nonreportable traders (usually small traders/speculators) as well as their open interest (contracts open in the market at time of reporting). See CFTC criteria here.