
By RoboForex Analytical Department
The EUR/USD pair has dipped to its lowest since 15 February this year following the release of encouraging data regarding the US manufacturing sector’s activity on Monday. This improvement, the first since September 2022, has bolstered the US dollar’s position.
The Institute for Supply Management (ISM) reported that the manufacturing business activity index climbed to 50.3 points in March from 47.8 in the preceding month. This rise above the crucial 50.0-point threshold, which distinguishes contraction from expansion, signals a positive development for the sector.
Key insights from the report highlight an increase in new orders, although manufacturing employment figures remained subdued. The surge in raw material prices also influenced the overall index, which might have otherwise recorded a higher reading. Importantly, this data signifies the end of the manufacturing sector’s most prolonged downturn in 16 months, a sector that constitutes approximately 10.4% of the US economy.
Further economic data revealed that the US Core Personal Consumption Expenditure (PCE) rose by 0.3% in February, slightly below the anticipated 0.4% increase. This Core PCE index, closely monitored by the Federal Reserve, suggests that the Fed may have room to adjust interest rates downwards in June 2024, given the subdued inflationary pressures.
Market expectations for the Federal Reserve’s decision in June have seen slight adjustments. CME FedWatch Tool data indicate a 66% likelihood of policy easing, a slight decrease from the prior 68% and significantly up from 57% the previous week.
Free Reports:
 Download Our Metatrader 4 Indicators – Put Our Free MetaTrader 4 Custom Indicators on your charts when you join our Weekly Newsletter
 Get our Weekly Commitment of Traders Reports - See where the biggest traders (Hedge Funds and Commercial Hedgers) are positioned in the futures markets on a weekly basis.
Technical analysis of EUR/USD
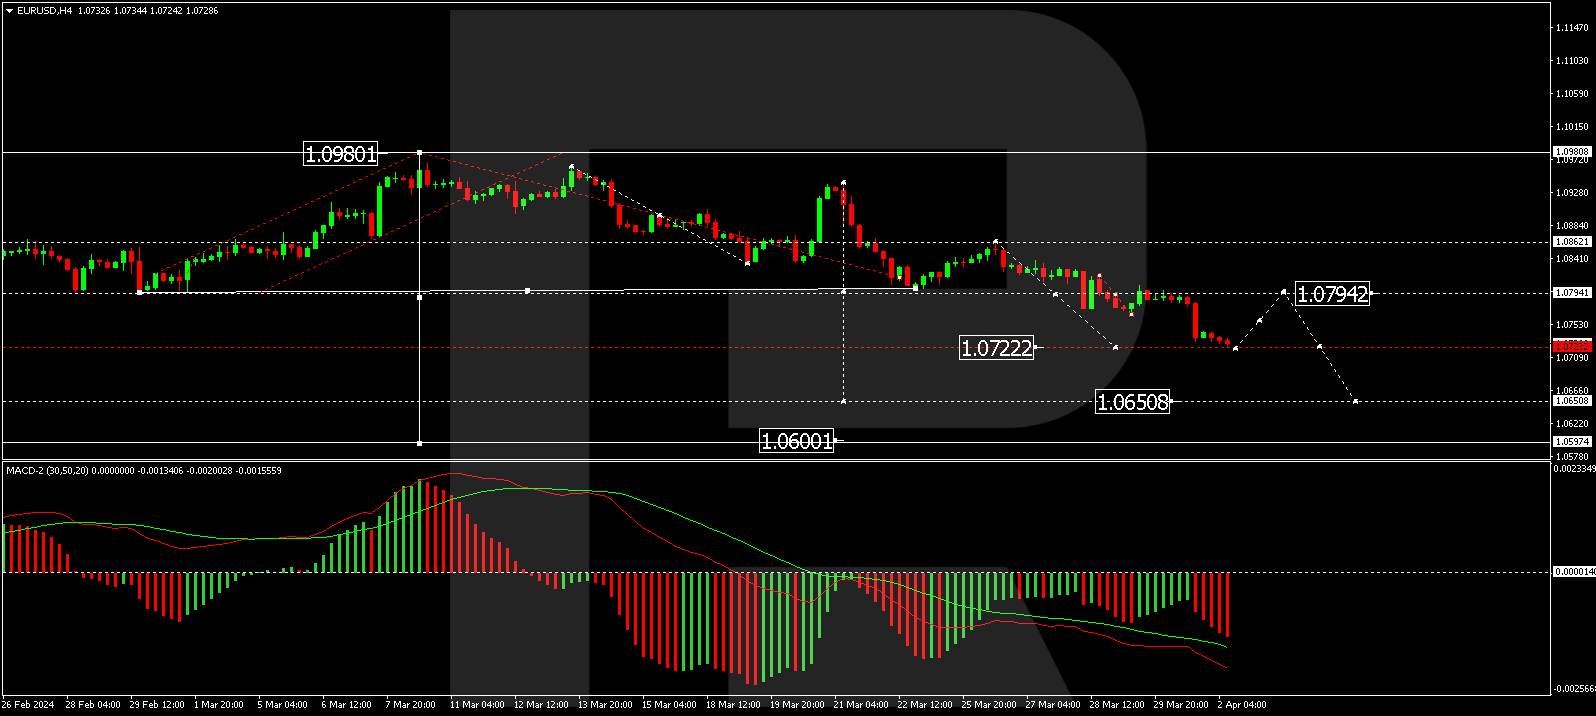
H4 Chart Analysis: the EUR/USD pair is currently in a consolidation phase around the 1.0794 level. A downward breakout from this range could lead to a continued decline towards 1.0650. A corrective move back to 1.0794, testing from below, may follow, with potential further descent to 1.0600. This scenario is supported by the MACD indicator, which shows the signal line below zero, indicating a continued downward trend.
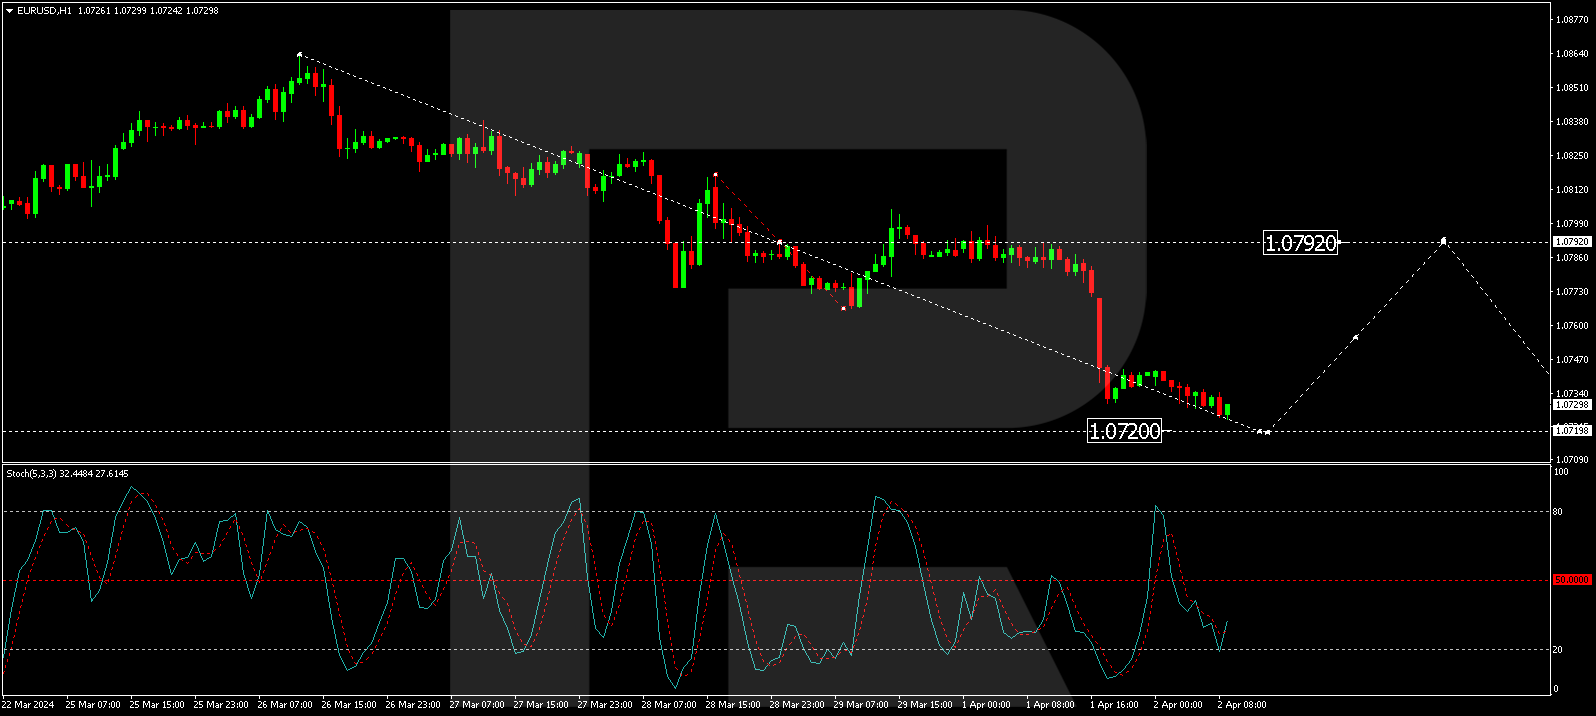
H1 Chart Analysis: a corrective structure has been completed at the 1.0804 level on the H1 chart. Following the news release, the market breached the 1.0777 level downwards, continuing the downward trajectory towards 1.0720. Upon completion, a potential uptick to 1.0790 (testing from below) could occur before another drop to the 1.0650 mark. The Stochastic oscillator, currently below 50, anticipates a further decline to the 20 mark, supporting the bearish outlook.
Disclaimer
Any forecasts contained herein are based on the author’s particular opinion. This analysis may not be treated as trading advice. RoboForex bears no responsibility for trading results based on trading recommendations and reviews contained herein.

- COT Metals Charts: Weekly Speculator Bets see small gains for Silver & Gold Jul 12, 2026
- COT Bonds Charts: Speculator Bets led by SOFR 3-Months & 2-Year Bonds Jul 12, 2026
- COT Energy Charts: Weekly Speculator Changes led by Brent Oil Jul 12, 2026
- COT Soft Commodities Charts: Weekly Speculator Changes led by Sugar, Corn & Soybeans Jul 12, 2026
- The US and European stock indices are rising again amid renewed investor interest in the AI industry. Jul 10, 2026
- USD/JPY Falls as Yen Recovers Weekly Losses Jul 10, 2026
- Crude oil prices surged sharply by 7% in reaction to the rapid escalation of the conflict in the Middle East Jul 9, 2026
- Middle East Tensions Weigh on Gold Jul 9, 2026
- Pound Awaits Tighter Policy from Bank of England Jul 8, 2026
- The United States carried out airstrikes on Iran after Iran’s attacked tankers in the Strait of Hormuz. The RBNZ raised the interest rate to 2.5% Jul 8, 2026