
By RoboForex Analytical Department
The commodity market, struggling to maintain its upward momentum, frequently slips into sell-offs. On Thursday, the price of Brent crude oil fell to 83.60 USD per barrel.
On Wednesday evening, Brent lost almost 1% of its value due to expectations regarding lending costs. Market discussions revolved around the possibility that the Federal Reserve’s interest rates could remain high for an extended period. This outlook is detrimental to the demand prospects for energy resources.
The yield on US government bonds increased on Wednesday, dragging the USD along and exerting significant pressure on the entire spectrum of commodity assets, including oil. This development raises concerns as commodities become less attractive to investors who pay in US dollars. Market participants speculated on the consequences if the Federal Reserve postpones the beginning of the easing cycle or decides not to lower rates at all this year.
According to the API, fresh statistics showed that crude oil inventories in the US fell by 6.490 million barrels for the week. Gasoline stocks decreased by 0.452 million barrels, while distillate reserves rose by 2.045 million.
With June approaching, concerns grow regarding the upcoming OPEC meeting this Sunday.
Free Reports:
 Sign Up for Our Stock Market Newsletter – Get updated on News, Charts & Rankings of Public Companies when you join our Stocks Newsletter
 Get our Weekly Commitment of Traders Reports - See where the biggest traders (Hedge Funds and Commercial Hedgers) are positioned in the futures markets on a weekly basis.
Brent technical analysis
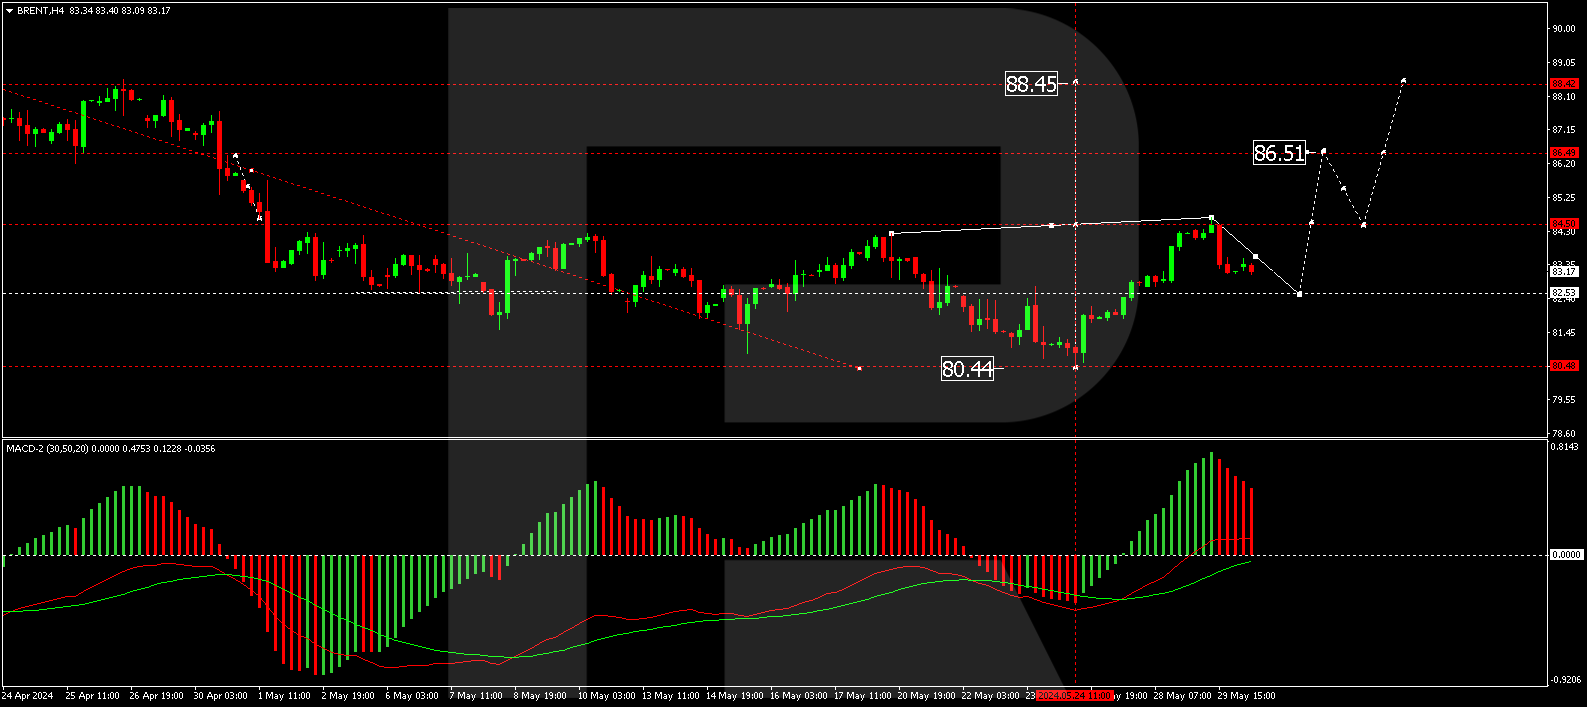
On the H4 chart, Brent made its first upward impulse towards 84.66. Today, a corrective wave is developing towards 82.55, with an anticipated formation of a consolidation range above this level. An upward breakout from this range is expected to initiate a new growth wave towards 84.70. Breaking through this level could extend the trend to 86.50, representing a short-term target. Technically, this scenario is confirmed by the MACD indicator. Its signal line is above zero and is pointing strictly upwards.
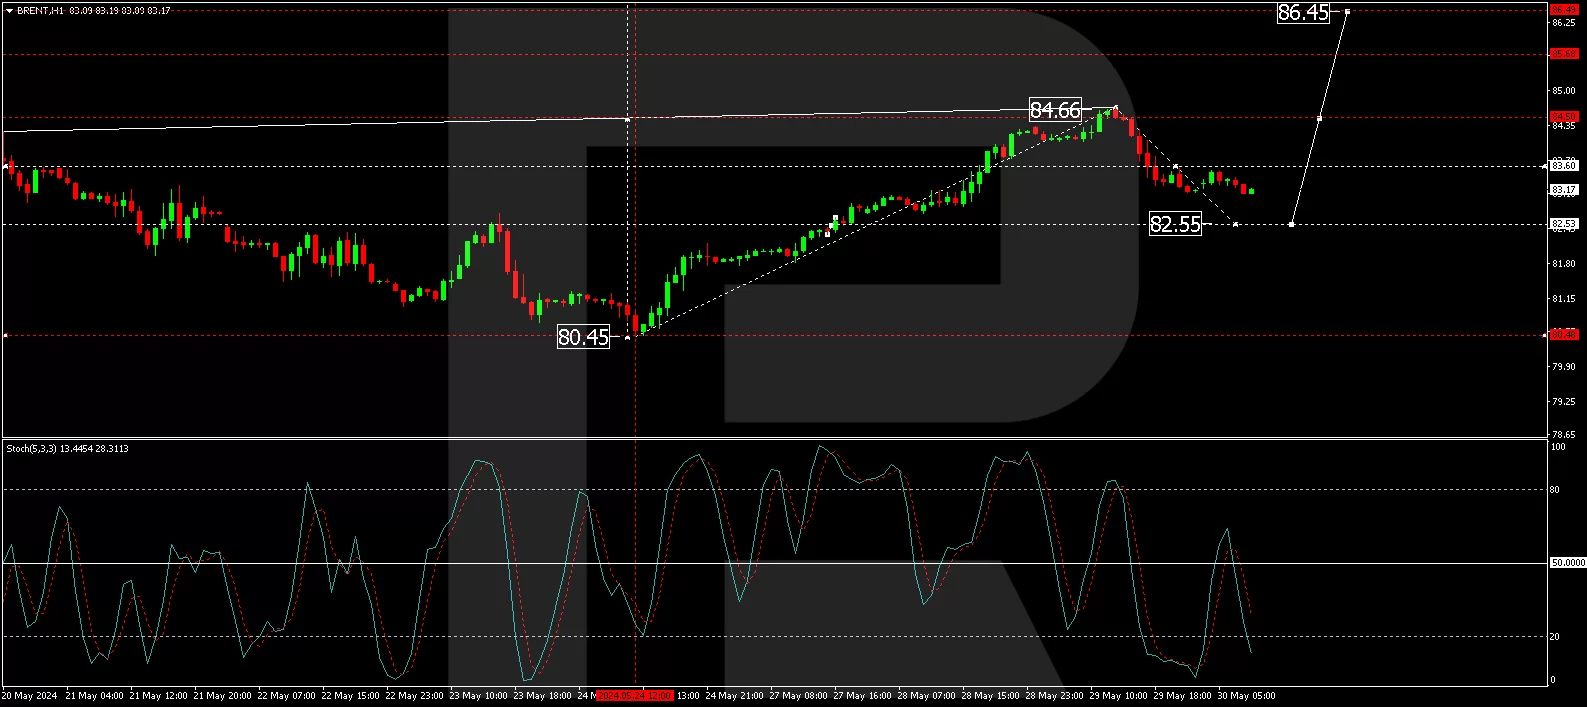
On the H1 chart, Brent completed a growth impulse structure to 84.66. It is currently correcting to 83.60. A consolidation range has formed below this level. An upward breakout from this range will signal the start of a growth wave towards 85.00 while breaking downwards will open up the potential for a correction to 82.55. After this correction, a new growth wave towards 85.00 could develop. Technically, this scenario is confirmed by the Stochastic oscillator. Its signal line is above the 20 mark. A new growth structure to the 80 mark is expected.
Disclaimer
Any forecasts contained herein are based on the author’s particular opinion. This analysis may not be treated as trading advice. RoboForex bears no responsibility for trading results based on trading recommendations and reviews contained herein.

- Geopolitical and macroeconomic conditions continue to pressure market sentiment Jul 20, 2026
- USD/JPY Poised to Continue Gains as Expensive Oil and Lack of Support Weigh on Yen Jul 20, 2026
- COT Metals Charts: Weekly Speculator Bets led by Copper & Steel Jul 18, 2026
- COT Bonds Charts: Weekly Speculator Bets led by 2-Year, SOFR 3M & 5-Year Bonds Jul 18, 2026
- COT Energy Charts: Weekly Speculator Bets led by Brent Oil & Heating Oil Jul 18, 2026
- COT Soft Commodities Charts: Weekly Speculator Bets led by Wheat, Corn & Soybean Meal Jul 18, 2026
- The Bank of Canada kept its interest rate unchanged. Platinum prices reached a three‑week high Jul 16, 2026
- Stock indices rose after the release of US inflation data. China’s GDP slowed sharply Jul 15, 2026
- GBP/USD Awaits Political News: What Will Happen Next Jul 15, 2026
- USD/JPY Holds at Highs: Pressure Lingers on Yen Jul 14, 2026
