Source: Michael Ballanger (3/20/23)
Michael Ballanger of GGM Advisory Inc. shares his thoughts on the current state of the stock market, the Silicon Bank Failure, and what stocks he believes should be on your radar.
The week that ended in Saint Paddy’s Day celebrations around the world will be long remembered as the week in which investors around the world finally woke up to the terror of counterparty risk and bail-in confiscation. To the infinite chagrin of the Wall Street spin doctors, even the usually complacent and always obedient mainstream media were reporting what really happened at Silicon Valley Bank and Signature Bank as opposed to the trollop we were being fed about “mismanagement” and “lack of risk controls” and “excessive overconcentration.”
The immortal Richard Russell would always urge his subscribers to “follow the money” whenever an event popped out of the blue and shocked investors like a prominent figure disappearing or a corporate failure (like a bank), and in the case of all of these sudden and inexplicable bank runs, one must ask one’s self “Who benefitted?” in respect of not so much the failures but more so of the massive deposits that fled for the safety of the larger “Too Big to Fail” money-center behemoths that just may or may not have been the source of the rumors that led to the panic that caused the cataclysmic drop in deposits at both failed banks.
Stocks Are Cheap
Then, just as Wall Street was acclimatizing itself to the notion of revised deposit insurance levels and Fed backstopping of the smaller regional banks, along with saunters Credit Suisse, the crown jewel investment bank of the Land of the Watchmaking Gnomes of Zurich, getting monkey-hammered to new lows after the Saudi National Bank told them to “pound sand” after they were asked for a “liquidity injection” (bailout). That set off a whole new round of panic sales within the Eurozone banks and continued to feed and fan the fires of uncertainty across the pond, with even those supposedly stodgy Canadian banks caught in the crossfire.
Now, this is all revisionist mumbo-jumbo because all that really matters is how the events pertaining to the global banking fraternity affect central bank monetary policy — as in — will Powell not only pause but also pivot due to the systemic shocks felt in boardrooms and trading floors the world over last week. Christine Lagarde dismissed it as “elitist lobbying” and still proceeded with a 50 bps. hike in the European bank rate.
I usually watch BNN/Bloomberg during the day for its clarity rather than the one I watched on Friday morning (CNBC), and it took very little time for me to be reminded as to why I quit listening to the never-ending parade of stock market cheerleaders that they trot out in ten-minute segments all pretending to be “debating” the course of interest rates or inflation or sentiment, but they all arrive at one breathless conclusion — that stocks are cheap (!) but not for long.
Was the Silicon Bank Failure in the Same Vein as Chrysler?
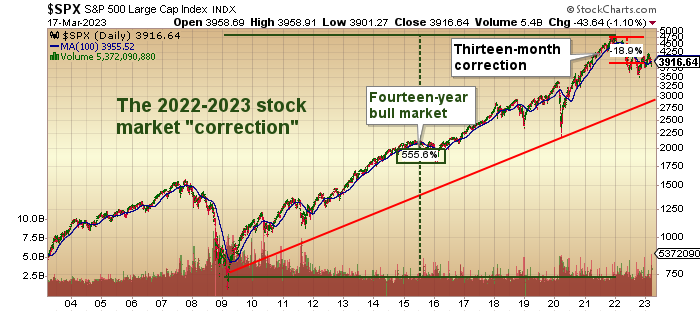
The most difficult part of analyzing market corrections like this one is that events like those that transpired in the past two weeks are usually found at or near major turning points in both market direction and central bank policy.
For example, people think that the Great Bull Market that began in the 1980s found its bottom in August 1982, the month when Paul Volcker turned on the proverbial dime and suddenly hacked a half point off the Fed Funds rate, and it is true that stock surged from around Dow 875 to over 1,000 within a few weeks but what people fail to realize is that the real low was actually March of 1980 in a period in which the big worry was The Chrysler Corporation whose disastrous expansion into overseas markets during the
It is my belief that with the inflationary effects of the tight jobs market causing nightmares for the Fed, and since stocks are only down 18% from the January 2022 top, there really is very little justification for abandoning the current tight monetary policy.
The stagflation of the ’70s sent it into the crosshairs of bankruptcy. On May 10, 1980, United States Secretary of the Treasury G. William Miller announced the approval of nearly US$1.5 billion dollars in federal loan guarantees for the nearly bankrupt automaker.
At the time, it was the largest rescue package ever granted by the U.S. government to an American corporation but what it represented was what I call “seminal moments” in stock market history.
The moments usually mark the turn for either the very good or the very bad. Examples of this would include the big rally after JFK was killed in 1963, where, as perverse as it might have been thought, JFK tackling Big Oil and threatening to dismantle the Fed were no longer seen as depressants to stocks, hence the rally.
Converse to that event, a seemingly-bullish punctuation to the DotCom mania happened in January 2000 when media giant Time Warner and internet superstar upstart America Online announced that they would be merging in what eventually became the singular worst business combination in all of history. The surviving entity to this day is only one-seventh the value of the merged entities back in 2000.
The question remains: “Was the Silicon Bank failure a seminal moment in the same vein as Chrysler in 1980?”
The jury is most certainly out because Fed Chairman Powell has been seen wearing 6″ elevator shoes, shaving his head, and trying to acquire a taste for large Montezuma cigars while beating back the inflation beast as did a famous predecessor in the 1980-1982 period.
It is my belief that with the inflationary effects of the tight jobs market causing nightmares for the Fed, and since stocks are only down 18% from the January 2022 top, there really is very little justification for abandoning the current tight monetary policy.
I watched gold plunge 35.3% in 2008 only to advance over 180% to all-time highs after liquidity issues brought about forced selling in the metals just before the central banks bailed out the member banks with a money-printing exercise of orgasmic proportion.
Of course, with all the job cuts on Wall Street and the shrinking bonus pools at all the big investment banks, the wails of protest will be loud and often until the punch bowl gets refilled, and happy days are once again here.
Unless one is a reader of minds or sayer of soothes, it is impossible to determine which was Powell goes next Wednesday so all I will do is look to the tea leaves in the bottom of the cup AND, of course, the charts, which have been a useful sextant with which to navigate the major averages. Last week was actually an “UP” week for stocks despite the volatility and the Friday drubbing.
With all of the negative headlines, it really did appear as though we were in the midst of a seminal moment where traders were buying the regional bank panic thinking that it was a 9/11, GFC, or Covid Crash moment lighting industrial blowtorches into the backsides of those stingy central bankers.
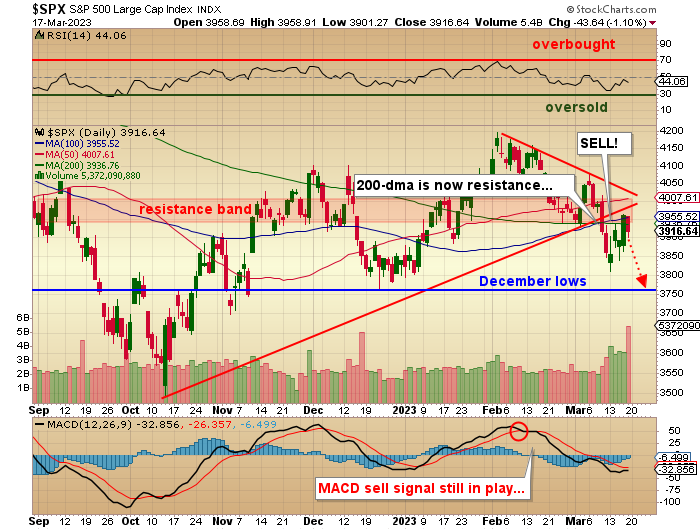
However, all that really occurred was a relief rally after the plunge to SPX 3,808, and while the RSI for the SPX failed to get below 30, MACD looked a tad oversold, which set up the move to the 200-dma at 3,940 above, which reside the 100 and 50-day m.a.’s as well as the big downtrend line off the February top.
Friday’s action negated Thursday’s close above the 200-dma which is now descending and resides at 3,936. I still believe that, at the very best, we can expect a successful retest of the December low at 3,764, but if that fails by month-end, then we are going to new lows below the October lows of 3,491.
Gold and Silver
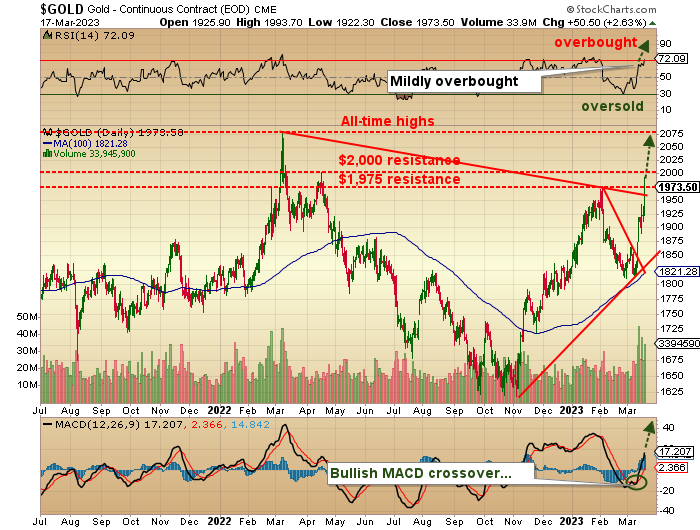
In last week’s missive, I wrote: “I see a test of the US$1,900 range by the end of the month, but if, in fact, I see further turmoil in the regional banks that spreads to the money-center banks and abroad, gold could catch a “fear trade” bid as traders move rapidly for the safety of non-paper assets.”
That “fear trade” bid came in like an Indian monsoon last week, with gold up over US$150/ounce, silver over US$1.20, and the HUI 29 points higher. With crude oil and copper down, color commentary by the pundits suggested that it was the slowing economy that was spooking the oil and copper pits, but from my vantage point, you would have expected the U.S. dollar (USD) to end the week on the lows, which it did not.
Whenever I see the performance triumvirate of gold chasing silver, silver chasing the PM equities (HUI), and PM equities decoupling from their anchorage to the USD and the SPX, I feel justified in adding to holdings. That is precisely what we got last week, and that silver put in a +4.88% move versus a +3.68% move for gold, but the stud of the day was the HUI which posted a +5.42% pop which, as I have been saying, for weeks now, will have a positive effect on our basket of junior miners.
My largest holding and top pick for the past few years, Getchell Gold Corp. (GTCH:CSE; GGLDF:OTCQB) added 12.28% Friday, a welcome relief for those of us that cannot begin to explain how that share price could trade down to US$9.20 per ounce of in-ground gold in mining-friendly Nevada as it did last week.
Their 2,059,900-ounce Fondaway Canyon (100%-owned) deposit is wide open to depth and along strike and is considered to have definite Tier One potential.
A couple of weeks ago, I suggested that Agnico Eagle Mines Ltd. (AEM:TSX; AEM:NYSE) in the low-mid US$40’s might be an interesting contrarian play due to the universal loathing being shown toward a group of companies with near-pristine balance sheets and strong income statements.
In the past two weeks, the number one input cost for miners — energy — has come under huge downside pressure falling 17.5% while their product is up 8.4%. That represents an expanding profit margin for the group, and here we are two weeks later, with AEM touching US$51.22 on Friday, and that is only after miners finally woke up on Thursday.
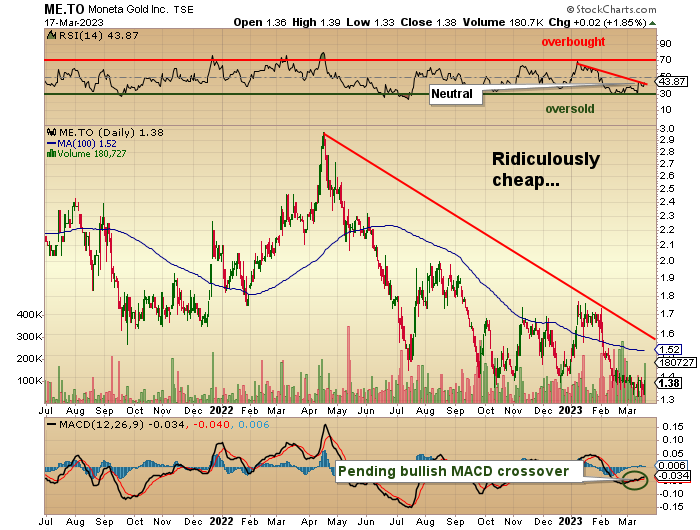
Another company that has caught my eye (thanks to my colleague and real technical analyst and market historian David Chapman) is Moneta Gold Inc. (MEAUF:OTCMKTS), formerly Moneta Porcupine Mines Inc. (ME:TSX), one of the first stocks I ever bought back in 1977
I used to follow it, but a bloated share structure and unremarkable asset mix kept me at a distance — until last week — when Chappie suggested I have a look. The first thing I asked was about the share structure, and to my surprise, I found that they went through a consolidation a while ago such that today there are a manageable 102,416,437 issued and a market cap of only US$102 million.
Digging deeper, I had forgotten that they always had a big land package in the heart of the Destour-Porcupine-Fault-Zone (“DPFZ”), a mineralized corridor within the legendary Abitibi-Greenstone Belt of northern Ontario and Quebec and have, in recent years significantly advanced the Tower Gold Project which includes a 17-km. strip of the DPFZ.
- The current mineral resource estimate of 4.46 million ounces (“Moz”) indicated contained gold within 150.6 million tonnes (“Mt”) at a grade of 0.92 grams per tonne Au (“g/t”) and 8.29 Moz inferred contained ounces within 235.6 Mt at a grade of 1.09 g/t announced on September 7, 2022.
Adding 4.46 million ounces of indicated plus 8.28 million ounces inferred and you arrive at a global resource of 12.75 million ounces. From the Friday evening close of US$0.90, the company sports a market cap of US$91.7 million. Dividing the current market cap by the global resource of 12.75 million ounces, I arrive at a market cap per ounce of only US$7.19.
The company completed a Preliminary Economic Assessment in 2022 and arrived at the following:
- The September 7, 2022, Preliminary Economic Assessment (“PEA”) demonstrated robust economics with C$1,459 million pre-tax Net Present Value of 5% (“NPV”), CA$1,066 million after-tax NPV5%, and a 31.7% after-tax Internal Rate of Return (“IRR”) at US$1,600/oz gold, and an exchange rate of US$0.78.
- The PEA also demonstrated a CA$1,932 million cumulative after-tax cash flow, a mine life of 24 years, with average annual gold production of 261,014 oz in years one to 11 (192,666 oz for Life of Mine (“LOM”)) for 4,581,000 ounces total gold production LOM. Cash costs are estimated at US$910 per ounce, with all-in-sustaining costs (“AISC”) of US$1,073 per ounce of gold.
A Pre-feasibility Study is underway and expected to be completed next year which means ME qualifies as an advanced developer and a true proxy for rising gold prices. I was shocked to see the value-per-ounce come in at nearly US$7/ounce. I knew that gold miners were being thrown under buses these days as “value traps,” but between Getchell Gold at US$9.27/ounce last week and ME’s number, it really is astounding to see how universally detested the miners have become. My premise for owning Moneta Gold is buttressed by its location in the heart of a mining camp that has already produced over 85 million ounces since discoveries were first made in the 1800s.
Moneta is a sure-fire M&A candidate and is being added to the GGM Advisory portfolio as of Monday’s opening.
I Want To See Silver Outperform Gold
With the miners all catching a major league bid last week led by gold space, silver also caught fire.
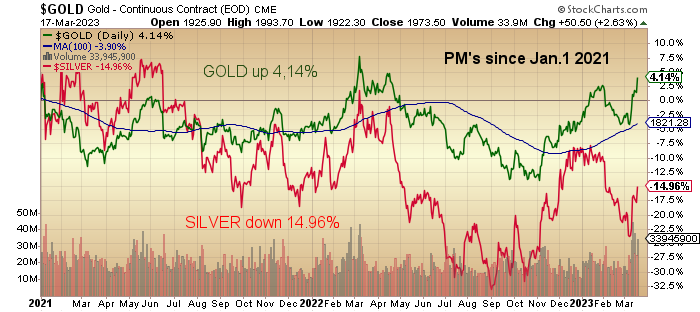
I want to see silver outperform gold right through to month’s end. From the chart of silver above, it is clear just how poorly silver has been relative to gold (and everything else, for that matter) since the beginning of 2021.
I excluded 2020 because of the myriad of stimulus-driven deformities that occurred, leaving us only the recovery period. It is imperative for the health of the entire metals complex that silver assumes “big dog” status and takes over the leadership of the rally.
The problem with making forecasts regarding silver is that I can get all of the bullish inputs to the price behavior correct (as I did back in 2020) and yet recoil in amazement (and horror) that the all-important price variable went south instead of north despite rampaging consumer prices, geopolitical turmoil, and central bank profligacy.
The Electrification Movement
As for the Electrification Movement, there is one very important truism that reigns supreme within the context of even the noblest of undertakings. When stock markets go into panic mode, a carbon-free world takes second place in the preservation of capital. With the banking crisis going global, the battery metals all took it on the chin last week, with copper below US$4/lb. and lithium is now in full correction mode.
Poster child Patriot Battery Metals Inc. (PMET:CA) is still ahead 76.67% YTD while down 34.08% from the top seen in early February.
No changes to my thoughts on Allied Copper Corp. (CPR:TSX.V; CPRRF:OTCQB) / Volt Lithium (CPR:TSXV / CPRRF:US) (which I own), where I await the results of large-scale testing of their DLE Process (“Direct Lithium Extraction”) at Rainbow Lake Alberta. These results, if successful, will be a game-changing thunderbolt for CPR shareholders once markets settle down.
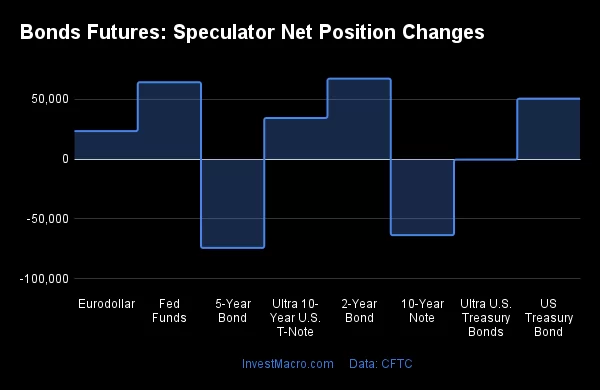
Volatility in US Treasury Market
Speaking of markets “settling down,” this weekend has been a constant bombardment of financial market grave-dancing because there are a great many of those very smart (and Street savvy) people I follow that have issued “crash alerts.” I have issued two via my Email Alert service urging everybody to “get defensive” by way of eliminating margin and raising cash.
Now, markets may not crash at all, but since the conditions out there are so bizarre, with massive volatility in the U.S. treasury market, there is something very untoward happening. Treasury markets are supposed to be safe havens where investors go to hide in relative calm as the equity market tempest passes. Instead, the yield on the U.S. two-year treasury, sitting at 5.07% on March 7th, closed the week at 3.845%, which represents a 25% crash in the 2-year yield. That is unheard of.
In ancient Greek mythology, it was written in The Labours of Heracles that he destroyed the Lernean Hydra, a multi-headed reptilian beast, and to do so, Heracles enlisted the aid of his nephew Iolaus.
As Heracles severed each mortal head, Iolaus was set to the task of cauterizing the fresh wounds so that no new heads would emerge. This story of Heracles evokes images of today’s financial landscape where each time the regulators solve issues of a systemic nature, another one pops up, just like the Hydra’s heads, only in our story, there is no regulator, politician or Keynesian hero able to “cauterize the fresh wounds.”
There are a great many exciting and potentially-enriching stories out there, but the only one that matters at times like these are the ones that have happy endings without us losing all of our wealth because we failed to heed the storm clouds and plunging barometer.
Absent a coordinated rescue mission by central banks the world over, there are few reasons to be bullish on anything out there save gold and silver but need I remind you how those two “ultimate safe havens” acted during the 2008 G.F.C. and the more recent Covid Crash of March 2020.
They outperformed most other asset classes, but outperformance does not pay your electricity bill or college tuition if the price you paid is higher than where it was sold. “Get defensive” means one has cash that they are able to deploy in favor of depressed prices that occur only when liquidity needs supersede valuation metrics.
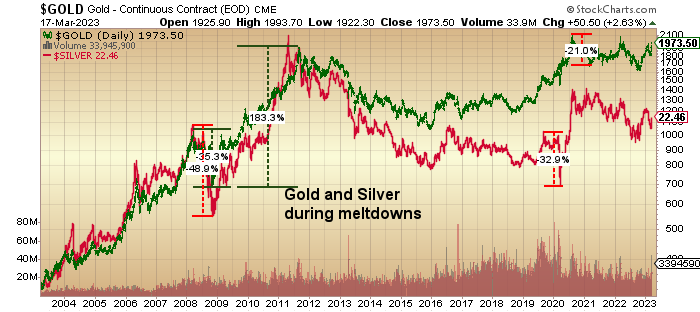
I watched gold plunge 35.3% in 2008 only to advance over 180% to all-time highs after liquidity issues brought about forced selling in the metals just before the central banks bailed out the member banks with a money-printing exercise of orgasmic proportion.
Carpe diem? No. Caveat emptor? Absolutely.
Michael Ballanger Disclaimer:
This letter makes no guarantee or warranty on the accuracy or completeness of the data provided. Nothing contained herein is intended or shall be deemed to be investment advice, implied or otherwise. This letter represents my views and replicates trades that I am making but nothing more than that. Always consult your registered advisor to assist you with your investments. I accept no liability for any loss arising from the use of the data contained on this letter. Options and junior mining stocks contain a high level of risk that may result in the loss of part or all invested capital and therefore are suitable for experienced and professional investors and traders only. One should be familiar with the risks involved in junior mining and options trading and we recommend consulting a financial adviser if you feel you do not understand the risks involved.
Disclosures:
1) Michael J. Ballanger: I, or members of my immediate household or family, own securities of the following companies mentioned in this article: Getchell Gold Corp., Patriot Battery Metals Inc., and Allied Copper Corp. I personally am, or members of my immediate household or family are, paid by the following companies mentioned in this article: My company, Bonaventure Explorations Ltd., has a consulting relationship with: None.
2) The following companies mentioned in this article are billboard sponsors of Streetwise Reports: None. Click here for important disclosures about sponsor fees. As of the date of this article, an affiliate of Streetwise Reports has a consulting relationship with: None. Please click here for more information.
3) Statements and opinions expressed are the opinions of the author and not of Streetwise Reports or its officers. The author is wholly responsible for the validity of the statements. The author was not paid by Streetwise Reports for this article. Streetwise Reports was not paid by the author to publish or syndicate this article. Streetwise Reports requires contributing authors to disclose any shareholdings in, or economic relationships with, companies that they write about. Streetwise Reports relies upon the authors to accurately provide this information and Streetwise Reports has no means of verifying its accuracy.
4) This article does not constitute investment advice. Each reader is encouraged to consult with his or her individual financial professional and any action a reader takes as a result of information presented here is his or her own responsibility. By opening this page, each reader accepts and agrees to Streetwise Reports’ terms of use and full legal disclaimer. This article is not a solicitation for investment. Streetwise Reports does not render general or specific investment advice and the information on Streetwise Reports should not be considered a recommendation to buy or sell any security. Streetwise Reports does not endorse or recommend the business, products, services or securities of any company mentioned on Streetwise Reports.
5) From time to time, Streetwise Reports LLC and its directors, officers, employees or members of their families, as well as persons interviewed for articles and interviews on the site, may have a long or short position in securities mentioned. Directors, officers, employees or members of their immediate families are prohibited from making purchases and/or sales of those securities in the open market or otherwise from the time of the decision to publish an article until three business days after the publication of the article. The foregoing prohibition does not apply to articles that in substance only restate previously published company releases. As of the date of this article, officers and/or employees of Streetwise Reports LLC (including members of their household) own securities of Agnico Eagle Mines Ltd. and Allied Copper Corp., companies mentioned in this article.


