
By InvestMacro

Here are the latest charts and statistics for the Commitment of Traders (COT) data published by the Commodities Futures Trading Commission (CFTC).
The latest COT data is updated through Tuesday July 25th and shows a quick view of how large traders (for-profit speculators and commercial entities) were positioned in the futures markets.
Weekly Speculator Changes led by Copper
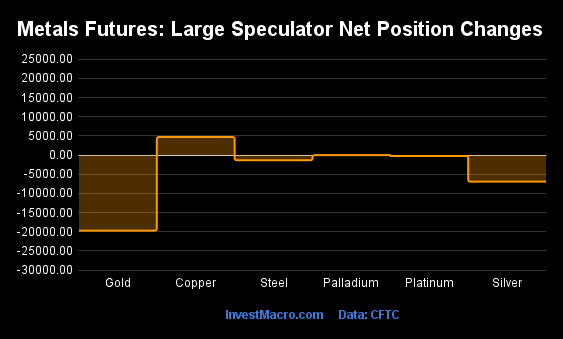
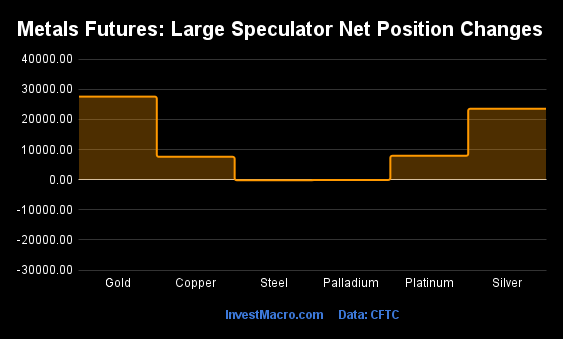
The COT metals markets speculator bets were lower this week as one out of the six metals markets we cover had higher positioning while the other five markets had lower speculator contracts.
Leading the gains for the metals was just Copper with a weekly rise of 4,709 contracts.
The markets with declines in speculator bets for the week were Gold (-19,709 contracts), Silver (-6,937 contracts), Steel (-1,356 contracts), Platinum (-249 contracts) and Palladium (-27 contracts) also registering lower bets on the week.
| Jul-25-2023 | OI | OI-Index | Spec-Net | Spec-Index | Com-Net | COM-Index | Smalls-Net | Smalls-Index |
|---|---|---|---|---|---|---|---|---|
| Gold | 476,176 | 25 | 173,639 | 53 | -198,210 | 47 | 24,571 | 42 |
| Silver | 146,898 | 36 | 36,925 | 71 | -49,718 | 34 | 12,793 | 37 |
| Copper | 234,713 | 70 | 1,159 | 32 | -3,904 | 68 | 2,745 | 36 |
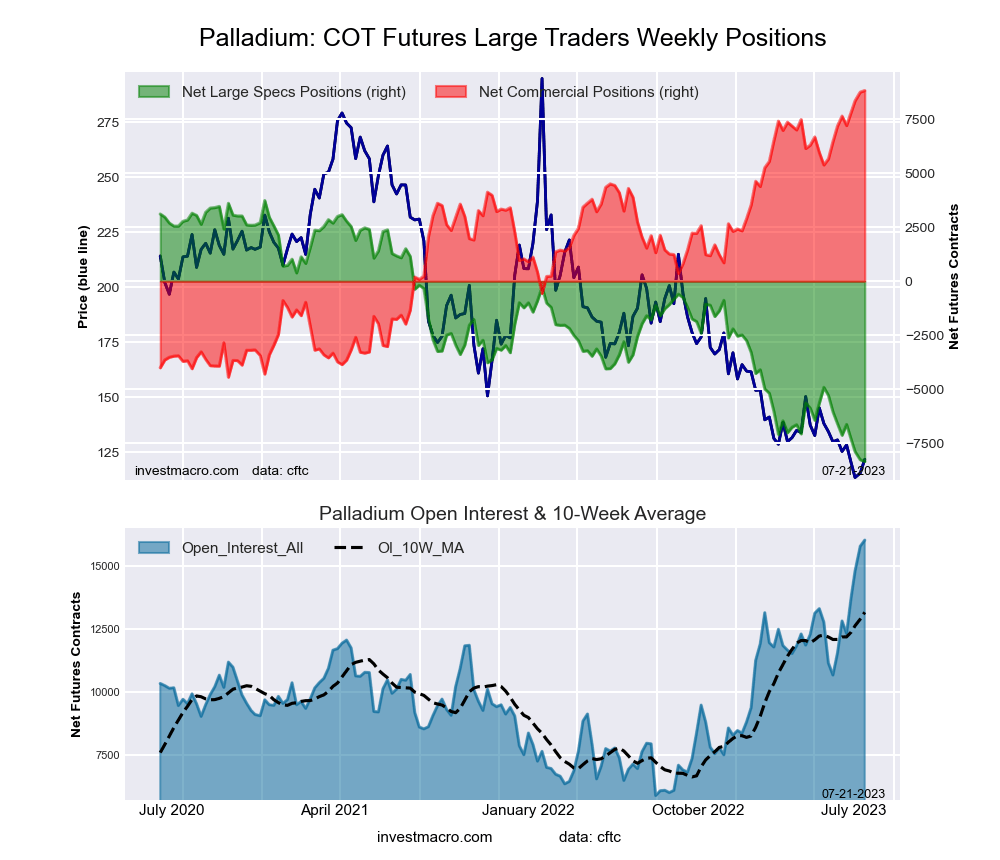
| Palladium | 16,760 | 100 | -8,377 | 0 | 8,899 | 100 | -522 | 10 |
| Platinum | 64,197 | 48 | 15,487 | 51 | -20,441 | 51 | 4,954 | 34 |
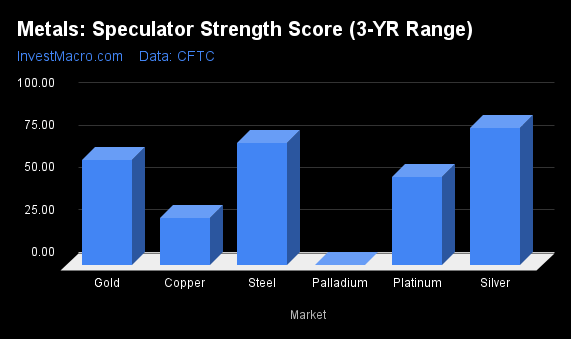
Strength Scores led by Silver & Steel
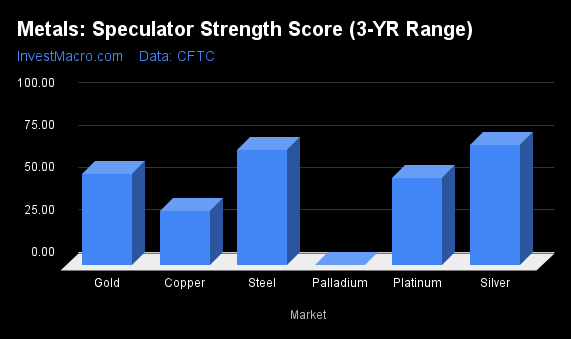
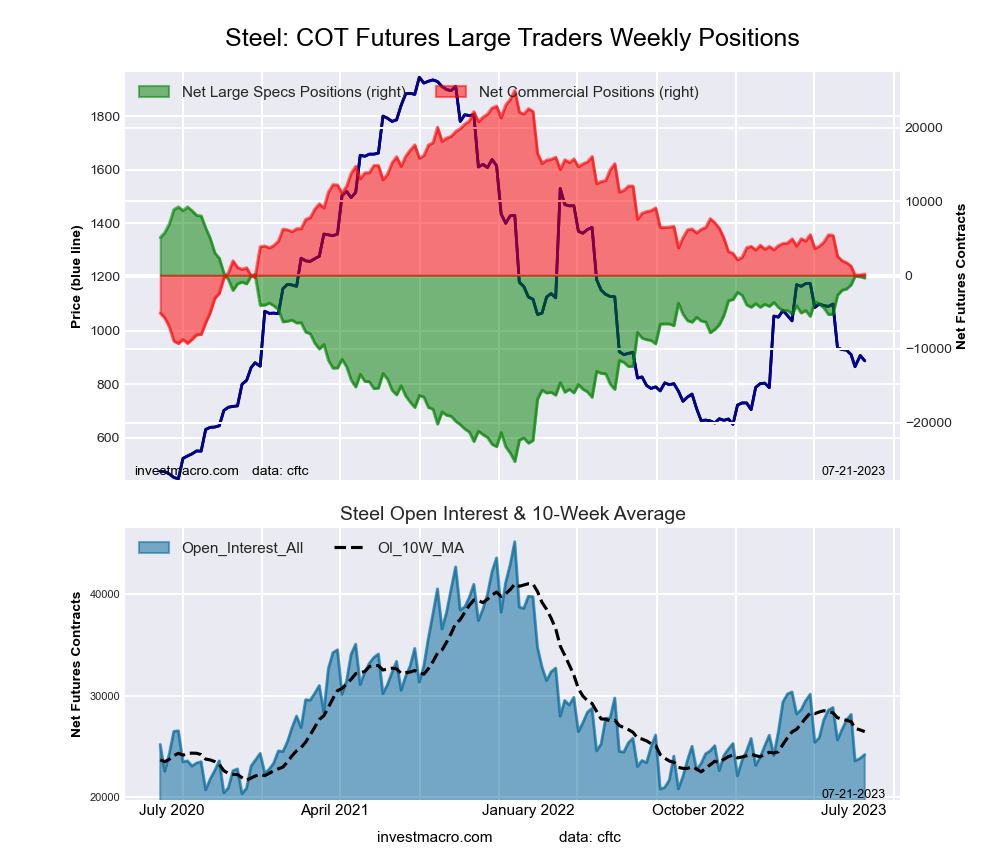
COT Strength Scores (a normalized measure of Speculator positions over a 3-Year range, from 0 to 100 where above 80 is Extreme-Bullish and below 20 is Extreme-Bearish) showed that Silver (71 percent) and Steel (68 percent) lead the metals markets this week.
On the downside, Palladium (0 percent) comes in at the lowest strength level currently and is in Extreme-Bearish territory (below 20 percent).
Strength Statistics:
Gold (53.5 percent) vs Gold previous week (62.2 percent)
Silver (70.9 percent) vs Silver previous week (80.8 percent)
Copper (31.8 percent) vs Copper previous week (27.8 percent)
Platinum (51.3 percent) vs Platinum previous week (51.9 percent)
Palladium (0.0 percent) vs Palladium previous week (0.2 percent)
Steel (68.2 percent) vs Palladium previous week (72.1 percent)
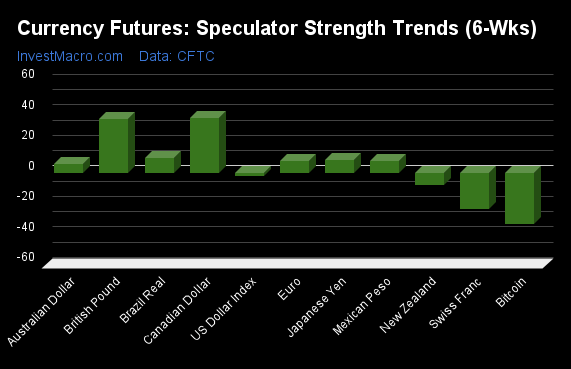
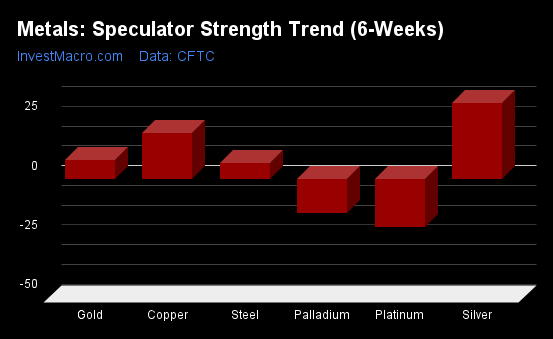
Silver & Copper top the 6-Week Strength Trends
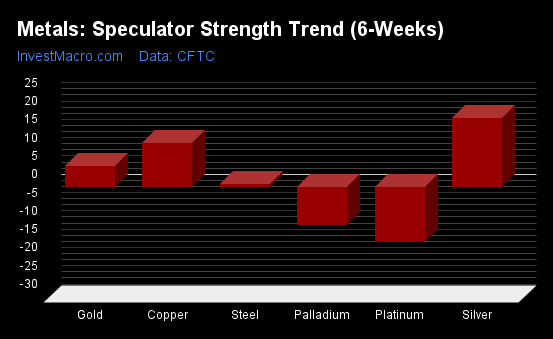
COT Strength Score Trends (or move index, calculates the 6-week changes in strength scores) showed that Silver (19 percent) and Copper (12 percent) lead the past six weeks trends for metals.
Platinum (-15 percent) leads the downside trend scores currently with Palladium (-10 percent) as the next market with lower trend scores.
Move Statistics:
Gold (5.9 percent) vs Gold previous week (7.8 percent)
Silver (18.8 percent) vs Silver previous week (31.9 percent)
Copper (12.2 percent) vs Copper previous week (19.4 percent)
Platinum (-15.0 percent) vs Platinum previous week (-20.5 percent)
Palladium (-10.2 percent) vs Palladium previous week (-14.4 percent)
Steel (0.9 percent) vs Steel previous week (6.8 percent)
Individual Markets:
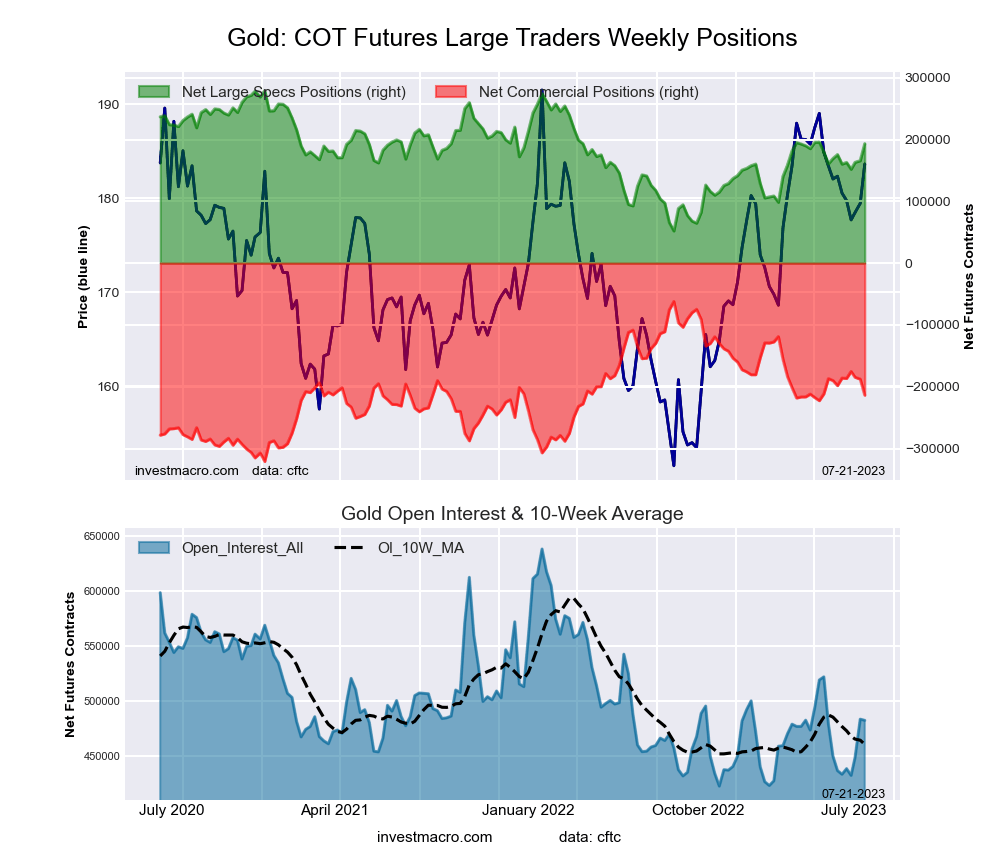
Gold Comex Futures:
 The Gold Comex Futures large speculator standing this week came in at a net position of 173,639 contracts in the data reported through Tuesday. This was a weekly fall of -19,709 contracts from the previous week which had a total of 193,348 net contracts.
This week’s current strength score (the trader positioning range over the past three years, measured from 0 to 100) shows the speculators are currently Bullish with a score of 53.5 percent. The commercials are Bearish with a score of 47.4 percent and the small traders (not shown in chart) are Bearish with a score of 41.5 percent.
Price Trend-Following Model: Weak Downtrend
Our weekly trend-following model classifies the current market price position as: Weak Downtrend. The current action for the model is considered to be: Hold – Maintain Short Position.
| Gold Futures Statistics | SPECULATORS | COMMERCIALS | SMALL TRADERS |
| – Percent of Open Interest Longs: | 52.1 | 26.4 | 9.9 |
| – Percent of Open Interest Shorts: | 15.7 | 68.0 | 4.8 |
| – Net Position: | 173,639 | -198,210 | 24,571 |
| – Gross Longs: | 248,229 | 125,491 | 47,300 |
| – Gross Shorts: | 74,590 | 323,701 | 22,729 |
| – Long to Short Ratio: | 3.3 to 1 | 0.4 to 1 | 2.1 to 1 |
| NET POSITION TREND: | |||
| – Strength Index Score (3 Year Range Pct): | 53.5 | 47.4 | 41.5 |
| – Strength Index Reading (3 Year Range): | Bullish | Bearish | Bearish |
| NET POSITION MOVEMENT INDEX: | |||
| – 6-Week Change in Strength Index: | 5.9 | -4.7 | -3.2 |
Silver Comex Futures:
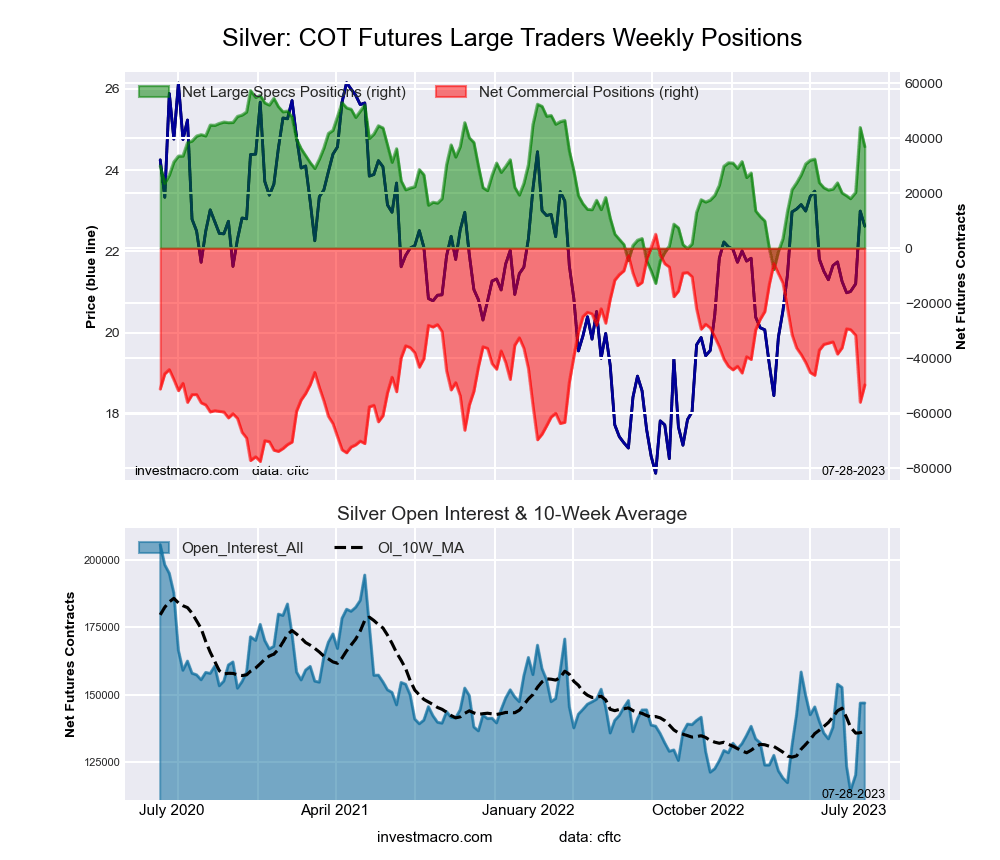 The Silver Comex Futures large speculator standing this week came in at a net position of 36,925 contracts in the data reported through Tuesday. This was a weekly decrease of -6,937 contracts from the previous week which had a total of 43,862 net contracts.
This week’s current strength score (the trader positioning range over the past three years, measured from 0 to 100) shows the speculators are currently Bullish with a score of 70.9 percent. The commercials are Bearish with a score of 33.7 percent and the small traders (not shown in chart) are Bearish with a score of 37.5 percent.
Price Trend-Following Model: Strong Uptrend
Our weekly trend-following model classifies the current market price position as: Strong Uptrend. The current action for the model is considered to be: Hold – Maintain Long Position.
| Silver Futures Statistics | SPECULATORS | COMMERCIALS | SMALL TRADERS |
| – Percent of Open Interest Longs: | 49.5 | 26.7 | 16.7 |
| – Percent of Open Interest Shorts: | 24.4 | 60.5 | 8.0 |
| – Net Position: | 36,925 | -49,718 | 12,793 |
| – Gross Longs: | 72,786 | 39,197 | 24,478 |
| – Gross Shorts: | 35,861 | 88,915 | 11,685 |
| – Long to Short Ratio: | 2.0 to 1 | 0.4 to 1 | 2.1 to 1 |
| NET POSITION TREND: | |||
| – Strength Index Score (3 Year Range Pct): | 70.9 | 33.7 | 37.5 |
| – Strength Index Reading (3 Year Range): | Bullish | Bearish | Bearish |
| NET POSITION MOVEMENT INDEX: | |||
| – 6-Week Change in Strength Index: | 18.8 | -13.6 | -10.9 |
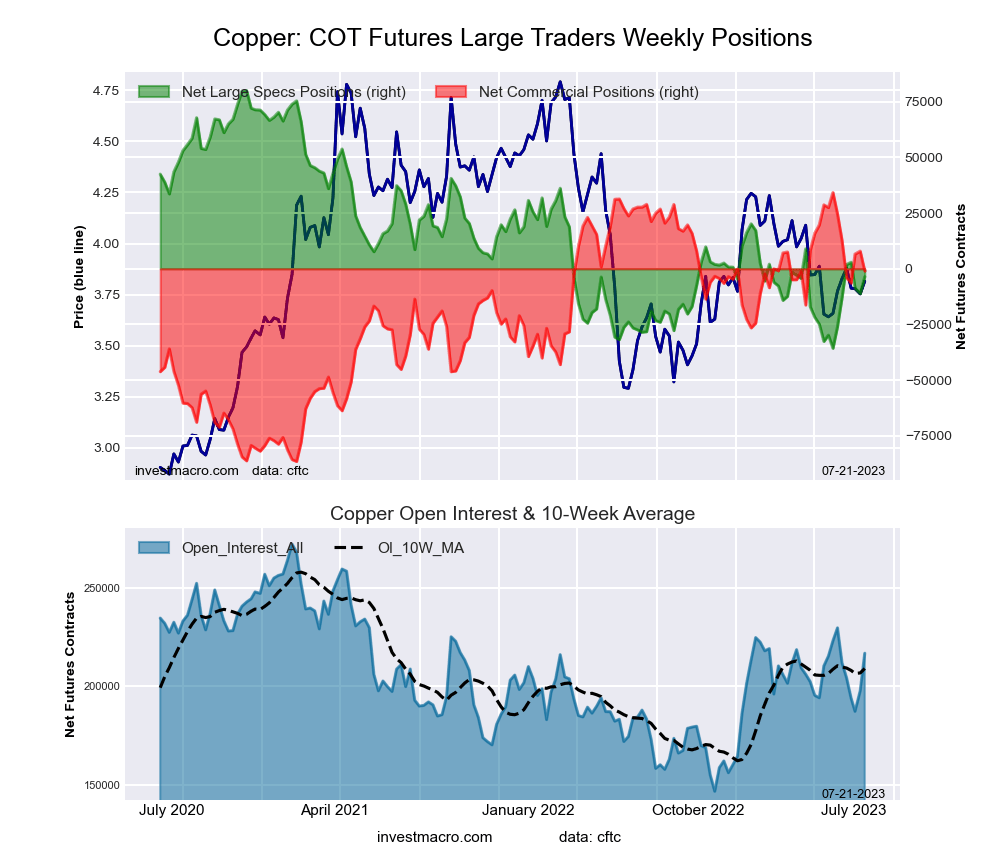
Copper Grade #1 Futures:
 The Copper Grade #1 Futures large speculator standing this week came in at a net position of 1,159 contracts in the data reported through Tuesday. This was a weekly gain of 4,709 contracts from the previous week which had a total of -3,550 net contracts.
This week’s current strength score (the trader positioning range over the past three years, measured from 0 to 100) shows the speculators are currently Bearish with a score of 31.8 percent. The commercials are Bullish with a score of 68.4 percent and the small traders (not shown in chart) are Bearish with a score of 35.8 percent.
Price Trend-Following Model: Weak Downtrend
Our weekly trend-following model classifies the current market price position as: Weak Downtrend. The current action for the model is considered to be: Hold – Maintain Short Position.
| Copper Futures Statistics | SPECULATORS | COMMERCIALS | SMALL TRADERS |
| – Percent of Open Interest Longs: | 31.4 | 40.5 | 6.9 |
| – Percent of Open Interest Shorts: | 30.9 | 42.2 | 5.7 |
| – Net Position: | 1,159 | -3,904 | 2,745 |
| – Gross Longs: | 73,743 | 95,140 | 16,173 |
| – Gross Shorts: | 72,584 | 99,044 | 13,428 |
| – Long to Short Ratio: | 1.0 to 1 | 1.0 to 1 | 1.2 to 1 |
| NET POSITION TREND: | |||
| – Strength Index Score (3 Year Range Pct): | 31.8 | 68.4 | 35.8 |
| – Strength Index Reading (3 Year Range): | Bearish | Bullish | Bearish |
| NET POSITION MOVEMENT INDEX: | |||
| – 6-Week Change in Strength Index: | 12.2 | -13.7 | 15.8 |
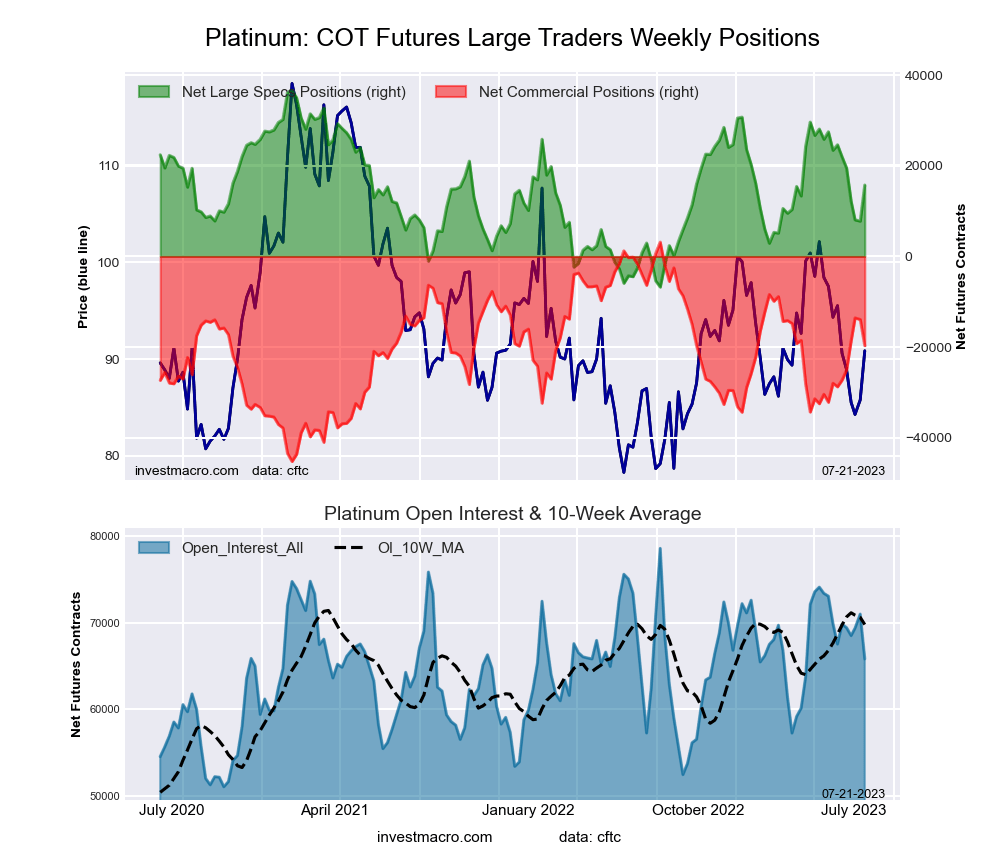
Platinum Futures:
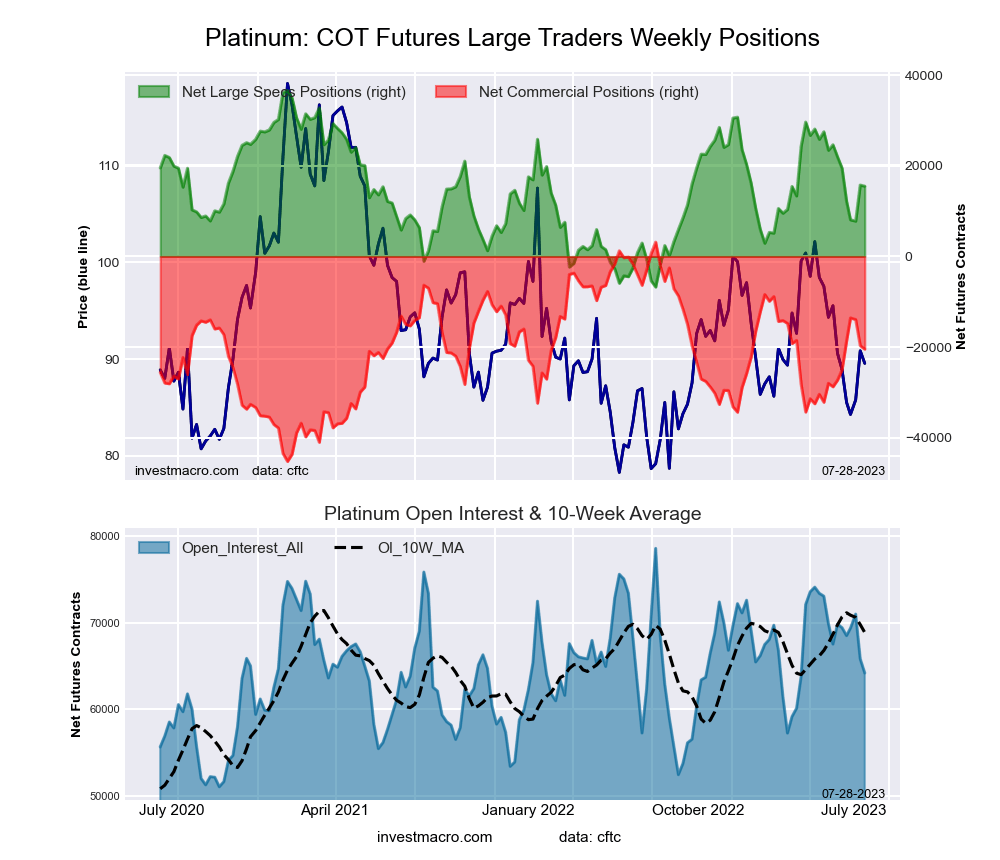 The Platinum Futures large speculator standing this week came in at a net position of 15,487 contracts in the data reported through Tuesday. This was a weekly lowering of -249 contracts from the previous week which had a total of 15,736 net contracts.
This week’s current strength score (the trader positioning range over the past three years, measured from 0 to 100) shows the speculators are currently Bullish with a score of 51.3 percent. The commercials are Bullish with a score of 51.2 percent and the small traders (not shown in chart) are Bearish with a score of 34.5 percent.
Price Trend-Following Model: Downtrend
Our weekly trend-following model classifies the current market price position as: Downtrend. The current action for the model is considered to be: Hold – Maintain Short Position.
| Platinum Futures Statistics | SPECULATORS | COMMERCIALS | SMALL TRADERS |
| – Percent of Open Interest Longs: | 56.8 | 25.7 | 12.1 |
| – Percent of Open Interest Shorts: | 32.7 | 57.6 | 4.3 |
| – Net Position: | 15,487 | -20,441 | 4,954 |
| – Gross Longs: | 36,489 | 16,506 | 7,742 |
| – Gross Shorts: | 21,002 | 36,947 | 2,788 |
| – Long to Short Ratio: | 1.7 to 1 | 0.4 to 1 | 2.8 to 1 |
| NET POSITION TREND: | |||
| – Strength Index Score (3 Year Range Pct): | 51.3 | 51.2 | 34.5 |
| – Strength Index Reading (3 Year Range): | Bullish | Bullish | Bearish |
| NET POSITION MOVEMENT INDEX: | |||
| – 6-Week Change in Strength Index: | -15.0 | 14.2 | -4.8 |
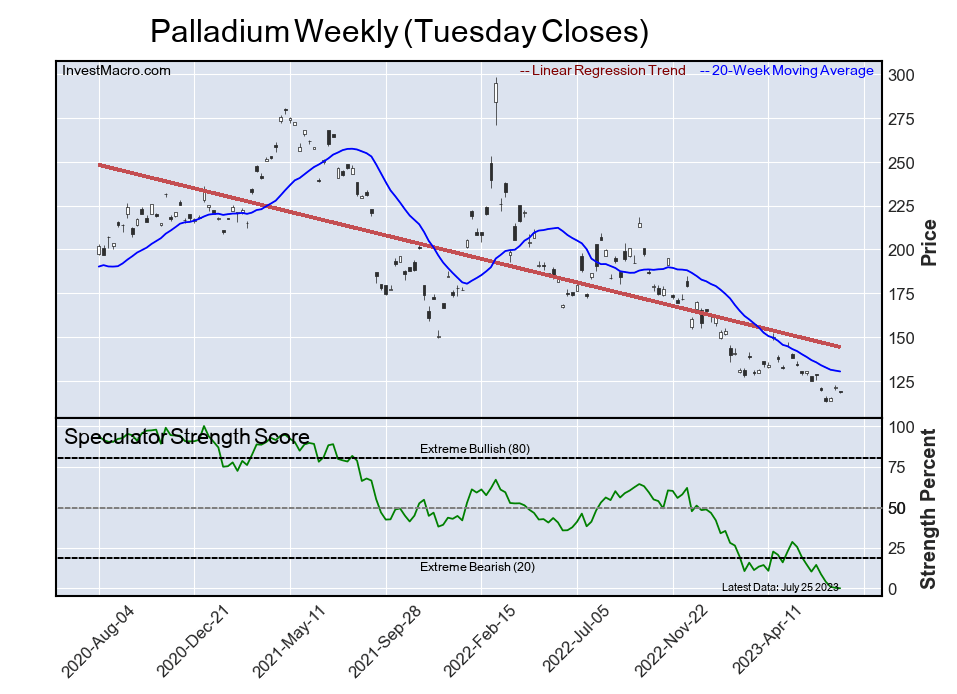
Palladium Futures:
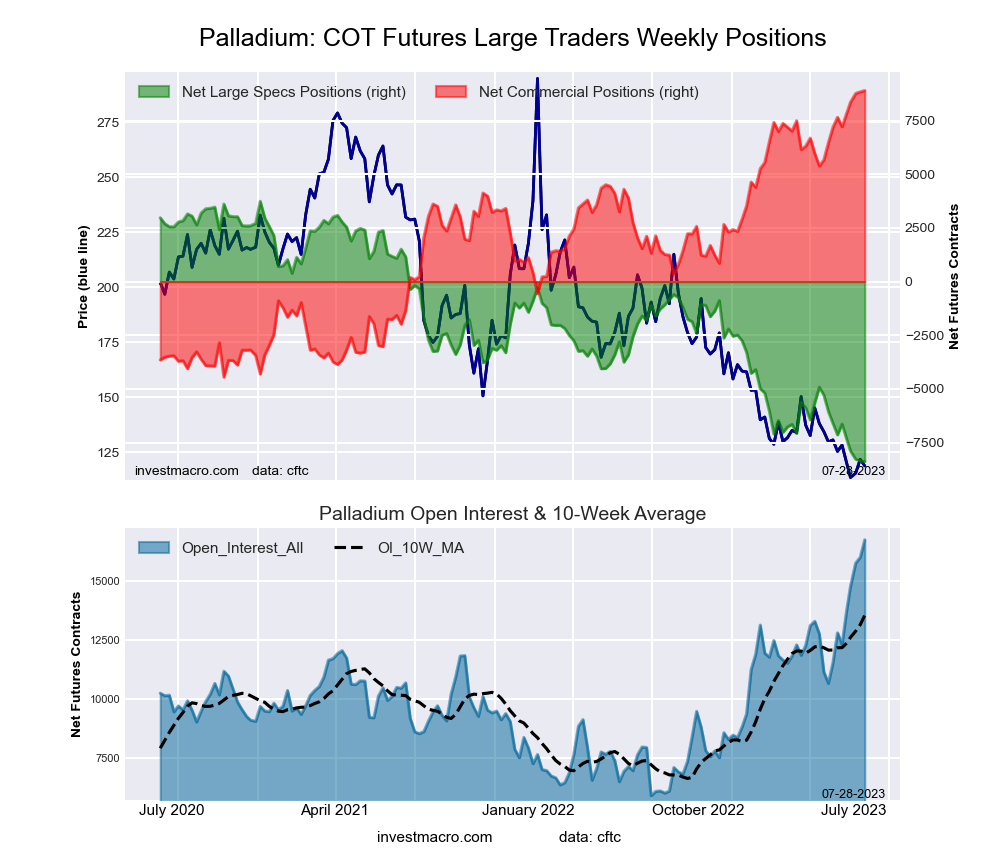 The Palladium Futures large speculator standing this week came in at a net position of -8,377 contracts in the data reported through Tuesday. This was a weekly reduction of -27 contracts from the previous week which had a total of -8,350 net contracts.
This week’s current strength score (the trader positioning range over the past three years, measured from 0 to 100) shows the speculators are currently Bearish-Extreme with a score of 0.0 percent. The commercials are Bullish-Extreme with a score of 100.0 percent and the small traders (not shown in chart) are Bearish-Extreme with a score of 10.3 percent.
Price Trend-Following Model: Strong Downtrend
Our weekly trend-following model classifies the current market price position as: Strong Downtrend. The current action for the model is considered to be: Hold – Maintain Short Position.
| Palladium Futures Statistics | SPECULATORS | COMMERCIALS | SMALL TRADERS |
| – Percent of Open Interest Longs: | 22.4 | 61.7 | 8.5 |
| – Percent of Open Interest Shorts: | 72.4 | 8.6 | 11.6 |
| – Net Position: | -8,377 | 8,899 | -522 |
| – Gross Longs: | 3,752 | 10,346 | 1,417 |
| – Gross Shorts: | 12,129 | 1,447 | 1,939 |
| – Long to Short Ratio: | 0.3 to 1 | 7.1 to 1 | 0.7 to 1 |
| NET POSITION TREND: | |||
| – Strength Index Score (3 Year Range Pct): | 0.0 | 100.0 | 10.3 |
| – Strength Index Reading (3 Year Range): | Bearish-Extreme | Bullish-Extreme | Bearish-Extreme |
| NET POSITION MOVEMENT INDEX: | |||
| – 6-Week Change in Strength Index: | -10.2 | 9.3 | -0.4 |
Steel Futures Futures:
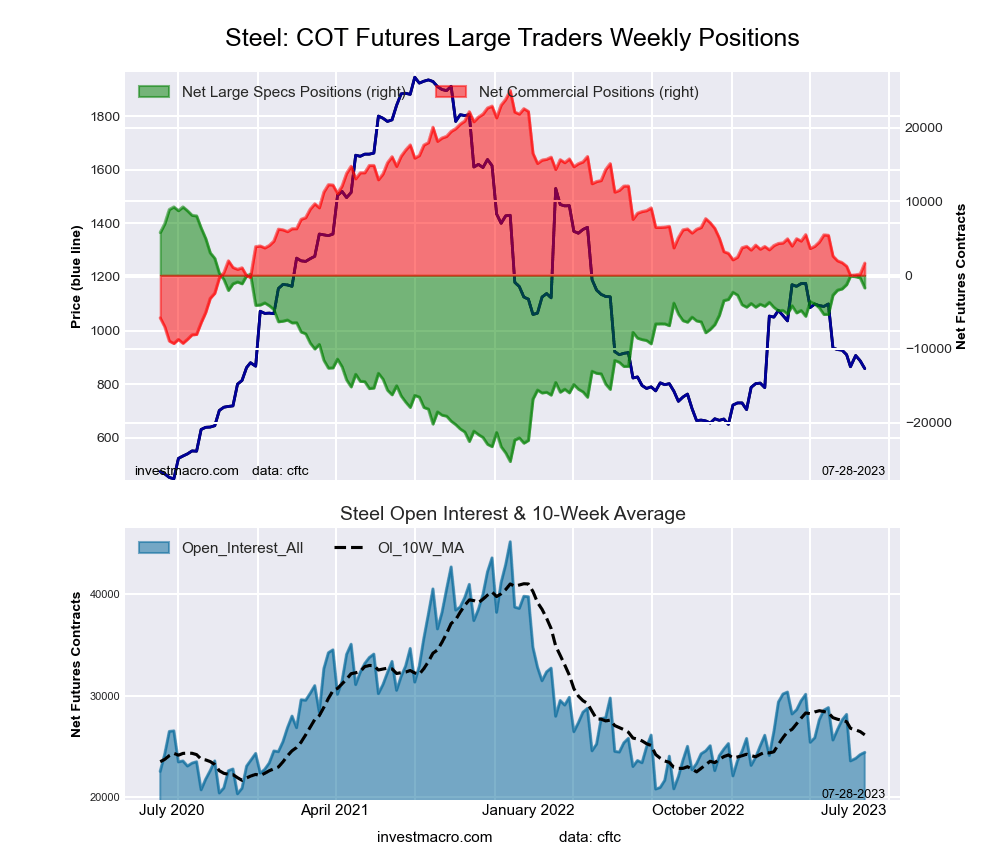 The Steel Futures large speculator standing this week came in at a net position of -1,726 contracts in the data reported through Tuesday. This was a weekly decline of -1,356 contracts from the previous week which had a total of -370 net contracts.
This week’s current strength score (the trader positioning range over the past three years, measured from 0 to 100) shows the speculators are currently Bullish with a score of 68.2 percent. The commercials are Bearish with a score of 31.8 percent and the small traders (not shown in chart) are Bearish with a score of 31.1 percent.
Price Trend-Following Model: Strong Downtrend
Our weekly trend-following model classifies the current market price position as: Strong Downtrend. The current action for the model is considered to be: Hold – Maintain Short Position.
| Steel Futures Statistics | SPECULATORS | COMMERCIALS | SMALL TRADERS |
| – Percent of Open Interest Longs: | 13.3 | 79.2 | 1.1 |
| – Percent of Open Interest Shorts: | 20.3 | 72.5 | 0.8 |
| – Net Position: | -1,726 | 1,641 | 85 |
| – Gross Longs: | 3,242 | 19,348 | 276 |
| – Gross Shorts: | 4,968 | 17,707 | 191 |
| – Long to Short Ratio: | 0.7 to 1 | 1.1 to 1 | 1.4 to 1 |
| NET POSITION TREND: | |||
| – Strength Index Score (3 Year Range Pct): | 68.2 | 31.8 | 31.1 |
| – Strength Index Reading (3 Year Range): | Bullish | Bearish | Bearish |
| NET POSITION MOVEMENT INDEX: | |||
| – 6-Week Change in Strength Index: | 0.9 | -0.9 | 1.4 |
Article By InvestMacro – Receive our weekly COT Newsletter
*COT Report: The COT data, released weekly to the public each Friday, is updated through the most recent Tuesday (data is 3 days old) and shows a quick view of how large speculators or non-commercials (for-profit traders) were positioned in the futures markets.
The CFTC categorizes trader positions according to commercial hedgers (traders who use futures contracts for hedging as part of the business), non-commercials (large traders who speculate to realize trading profits) and nonreportable traders (usually small traders/speculators) as well as their open interest (contracts open in the market at time of reporting). See CFTC criteria here.


