
By InvestMacro
Here are the latest charts and statistics for the Commitment of Traders (COT) data published by the Commodities Futures Trading Commission (CFTC).
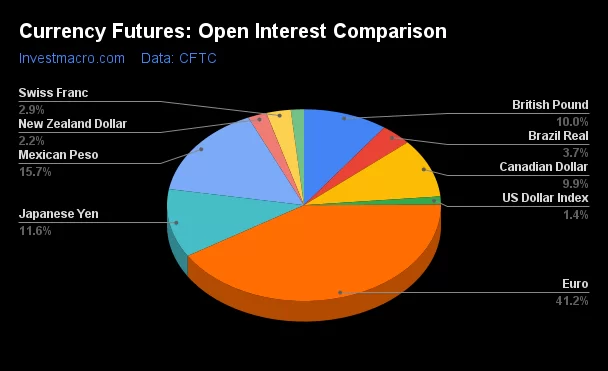
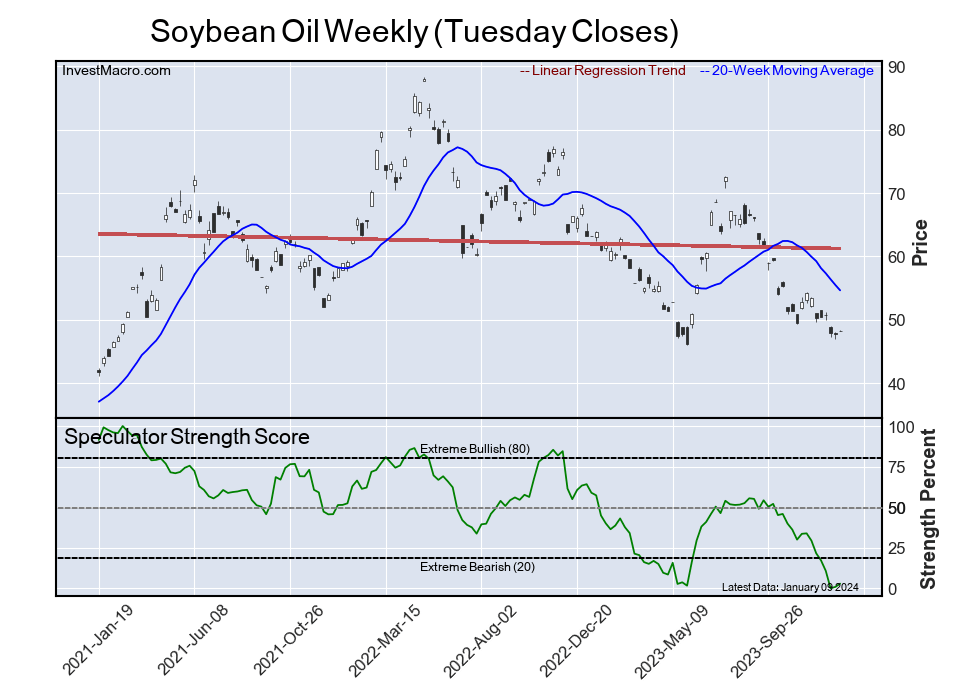
The latest COT data is updated through Tuesday January 9th and shows a quick view of how large market participants (for-profit speculators and commercial traders) were positioned in the futures markets. All currency positions are in direct relation to the US dollar where, for example, a bet for the euro is a bet that the euro will rise versus the dollar while a bet against the euro will be a bet that the euro will decline versus the dollar.
Weekly Speculator Changes led by Swiss Franc & Bitcoin
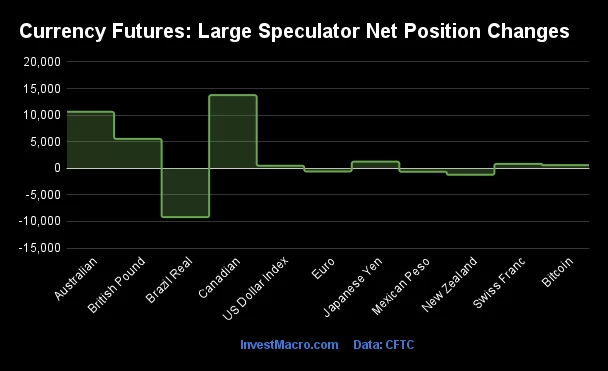
The COT currency market speculator bets were higher this week as seven out of the eleven currency markets we cover had higher positioning while the other four markets had lower speculator contracts.
Leading the gains for the currency markets was the Canadian Dollar (13,751 contracts) with the Australian Dollar (10,619 contracts), the British Pound (5,529 contracts), the Japanese Yen (1,246 contracts), the Swiss Franc (823 contracts), Bitcoin (603 contracts) and the US Dollar Index (487 contracts) also showing positive weeks.
The currencies seeing declines in speculator bets on the week were the Brazilian Real (-9,193 contracts), the New Zealand Dollar (-1,221 contracts), the EuroFX (-599 contracts) and the Mexican Peso (-659 contracts) also having lower bets.
Currency Speculators continue to raise their British Pound bets to highest since September
Highlighting the COT currency’s data is the recent gains in the speculator positioning for the British Pound Sterling. The Pound Sterling speculative positioning increased this week for a second straight week and for the seventh time over the past ten weeks.
The GBP speculator position has now been in an overall bullish position for the past six weeks following a run of nine weeks in bearish territory from the beginning of October to the end of November.
This renewed bullishness has brought the net speculator standing (currently at +20,734 contracts) to the highest level in the past sixteen weeks, dating back to September 19th.
The British Pound Sterling’s exchange rate with the US Dollar has been on the move higher as well after finding a major support level at 1.2100 for a period of weeks in October and November. Since then, the GBPUSD currency pair has trended up with gains in seven out of the past nine weeks to a close this week at the 1.2753 threshold and just below the 200-week moving average at 1.2844.
Major Currencies – Speculators Leaderboard

Legend: Weekly Speculators Change | Speculators Current Net Position | Speculators Strength Score compared to last 3-Years (0-100 range)
Strength Scores led by Mexican Peso & EuroFX
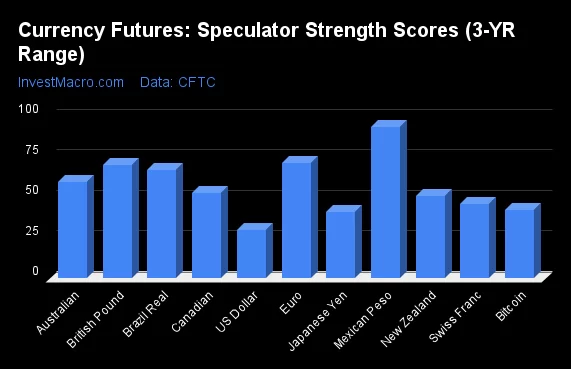
COT Strength Scores (a normalized measure of Speculator positions over a 3-Year range, from 0 to 100 where above 80 is Extreme-Bullish and below 20 is Extreme-Bearish) showed that the Mexican Peso (93 percent) and the EuroFX (71 percent) lead the currency markets this week. The British Pound (70 percent), Brazilian Real (67 percent) and the Australian Dollar (59 percent) come in as the next highest in the weekly strength scores.
On the downside, the US Dollar Index (30 percent) and the Japanese Yen (41 percent) come in at the lowest strength levels currently. The next lowest strength scores are the Bitcoin (42 percent) and the Swiss Franc (46 percent).
Strength Statistics:
US Dollar Index (29.6 percent) vs US Dollar Index previous week (28.8 percent)
EuroFX (70.9 percent) vs EuroFX previous week (71.2 percent)
British Pound Sterling (70.2 percent) vs British Pound Sterling previous week (66.3 percent)
Japanese Yen (41.2 percent) vs Japanese Yen previous week (40.5 percent)
Swiss Franc (46.1 percent) vs Swiss Franc previous week (43.7 percent)
Canadian Dollar (52.9 percent) vs Canadian Dollar previous week (41.3 percent)
Australian Dollar (59.2 percent) vs Australian Dollar previous week (49.5 percent)
New Zealand Dollar (50.8 percent) vs New Zealand Dollar previous week (54.0 percent)
Mexican Peso (93.1 percent) vs Mexican Peso previous week (93.5 percent)
Brazilian Real (67.1 percent) vs Brazilian Real previous week (79.0 percent)
Bitcoin (42.1 percent) vs Bitcoin previous week (33.0 percent)
Canadian Dollar & New Zealand Dollar top the 6-Week Strength Trends
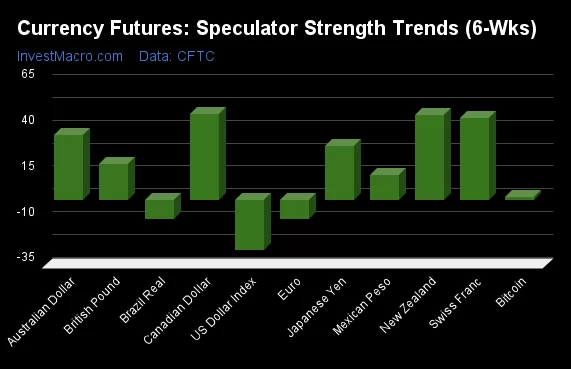
COT Strength Score Trends (or move index, calculates the 6-week changes in strength scores) showed that the Canadian Dollar (47 percent) and the New Zealand Dollar (46 percent) lead the past six weeks trends for the currencies. The Swiss Franc (45 percent), the Australian Dollar (36 percent) and the Japanese Yen (30 percent) are the next highest positive movers in the latest trends data.
The US Dollar Index (-27 percent) leads the downside trend scores currently with the EuroFX (-10 percent) and the Brazilian Real (-10 percent) following next with lower trend scores.
Strength Trend Statistics:
US Dollar Index (-27.0 percent) vs US Dollar Index previous week (-30.5 percent)
EuroFX (-10.3 percent) vs EuroFX previous week (-4.3 percent)
British Pound Sterling (19.9 percent) vs British Pound Sterling previous week (28.7 percent)
Japanese Yen (29.6 percent) vs Japanese Yen previous week (26.8 percent)
Swiss Franc (45.0 percent) vs Swiss Franc previous week (39.0 percent)
Canadian Dollar (46.9 percent) vs Canadian Dollar previous week (37.2 percent)
Australian Dollar (35.7 percent) vs Australian Dollar previous week (32.1 percent)
New Zealand Dollar (46.5 percent) vs New Zealand Dollar previous week (42.5 percent)
Mexican Peso (14.0 percent) vs Mexican Peso previous week (18.4 percent)
Brazilian Real (-10.1 percent) vs Brazilian Real previous week (0.6 percent)
Bitcoin (1.9 percent) vs Bitcoin previous week (-20.2 percent)
Individual COT Forex Markets:
US Dollar Index Futures:
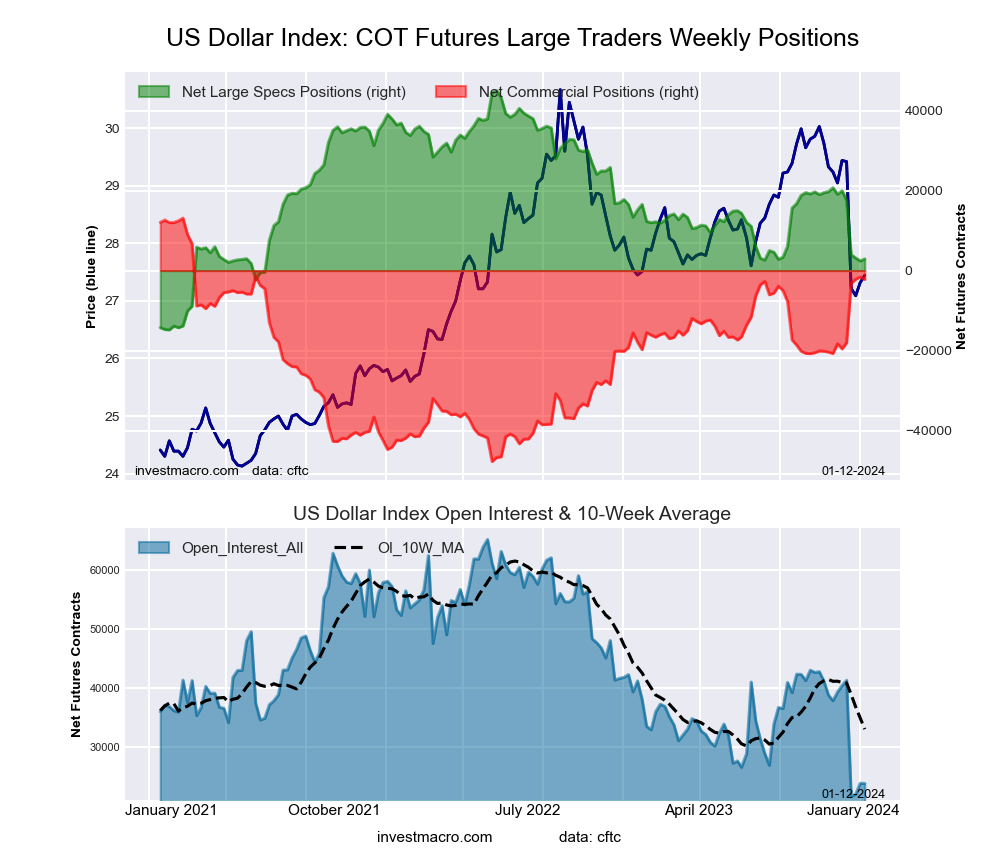 The US Dollar Index large speculator standing this week equaled a net position of 2,910 contracts in the data reported through Tuesday. This was a weekly gain of 487 contracts from the previous week which had a total of 2,423 net contracts.
This week’s current strength score (the trader positioning range over the past three years, measured from 0 to 100) shows the speculators are currently Bearish with a score of 29.6 percent. The commercials are Bullish with a score of 74.8 percent and the small traders (not shown in chart) are Bearish-Extreme with a score of 3.0 percent.
Price Trend-Following Model: Strong Downtrend
Our weekly trend-following model classifies the current market price position as: Strong Downtrend. The current action for the model is considered to be: Hold – Maintain Short Position.
| US DOLLAR INDEX Statistics | SPECULATORS | COMMERCIALS | SMALL TRADERS |
| – Percent of Open Interest Longs: | 67.2 | 15.1 | 10.3 |
| – Percent of Open Interest Shorts: | 55.0 | 24.3 | 13.2 |
| – Net Position: | 2,910 | -2,210 | -700 |
| – Gross Longs: | 16,041 | 3,598 | 2,450 |
| – Gross Shorts: | 13,131 | 5,808 | 3,150 |
| – Long to Short Ratio: | 1.2 to 1 | 0.6 to 1 | 0.8 to 1 |
| NET POSITION TREND: | |||
| – Strength Index Score (3 Year Range Pct): | 29.6 | 74.8 | 3.0 |
| – Strength Index Reading (3 Year Range): | Bearish | Bullish | Bearish-Extreme |
| NET POSITION MOVEMENT INDEX: | |||
| – 6-Week Change in Strength Index: | -27.0 | 26.4 | 1.1 |
Euro Currency Futures:
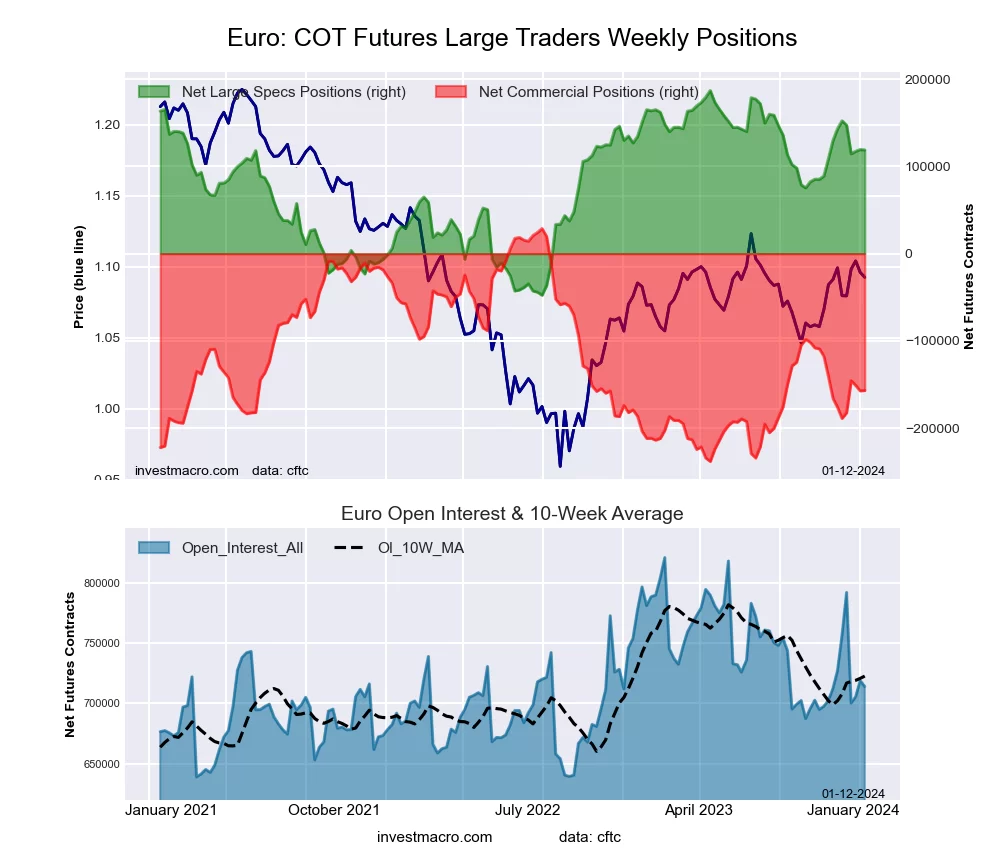 The Euro Currency large speculator standing this week equaled a net position of 118,877 contracts in the data reported through Tuesday. This was a weekly decrease of -599 contracts from the previous week which had a total of 119,476 net contracts.
This week’s current strength score (the trader positioning range over the past three years, measured from 0 to 100) shows the speculators are currently Bullish with a score of 70.9 percent. The commercials are Bearish with a score of 30.5 percent and the small traders (not shown in chart) are Bearish with a score of 39.6 percent.
Price Trend-Following Model: Strong Uptrend
Our weekly trend-following model classifies the current market price position as: Strong Uptrend. The current action for the model is considered to be: Hold – Maintain Long Position.
| EURO Currency Statistics | SPECULATORS | COMMERCIALS | SMALL TRADERS |
| – Percent of Open Interest Longs: | 29.2 | 57.4 | 11.5 |
| – Percent of Open Interest Shorts: | 12.5 | 79.4 | 6.2 |
| – Net Position: | 118,877 | -156,887 | 38,010 |
| – Gross Longs: | 208,473 | 409,738 | 82,429 |
| – Gross Shorts: | 89,596 | 566,625 | 44,419 |
| – Long to Short Ratio: | 2.3 to 1 | 0.7 to 1 | 1.9 to 1 |
| NET POSITION TREND: | |||
| – Strength Index Score (3 Year Range Pct): | 70.9 | 30.5 | 39.6 |
| – Strength Index Reading (3 Year Range): | Bullish | Bearish | Bearish |
| NET POSITION MOVEMENT INDEX: | |||
| – 6-Week Change in Strength Index: | -10.3 | 7.3 | 7.8 |
British Pound Sterling Futures:
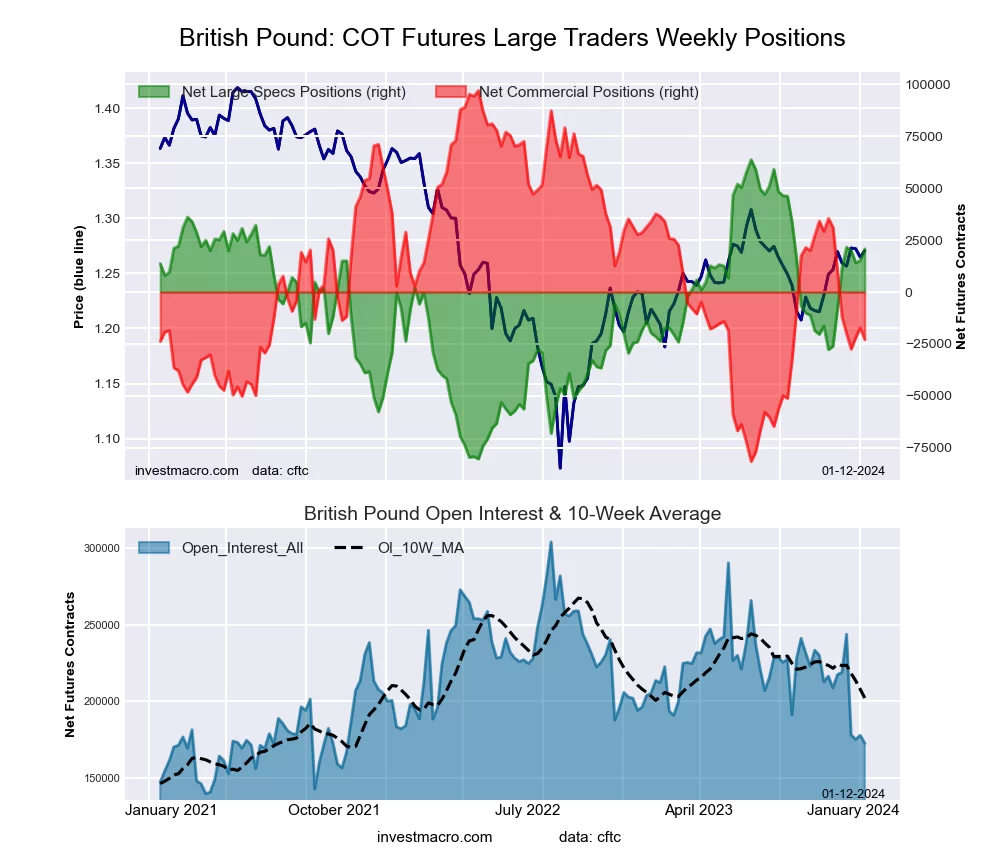 The British Pound Sterling large speculator standing this week equaled a net position of 20,734 contracts in the data reported through Tuesday. This was a weekly boost of 5,529 contracts from the previous week which had a total of 15,205 net contracts.
This week’s current strength score (the trader positioning range over the past three years, measured from 0 to 100) shows the speculators are currently Bullish with a score of 70.2 percent. The commercials are Bearish with a score of 32.9 percent and the small traders (not shown in chart) are Bullish with a score of 62.2 percent.
Price Trend-Following Model: Strong Uptrend
Our weekly trend-following model classifies the current market price position as: Strong Uptrend. The current action for the model is considered to be: Hold – Maintain Long Position.
| BRITISH POUND Statistics | SPECULATORS | COMMERCIALS | SMALL TRADERS |
| – Percent of Open Interest Longs: | 35.2 | 44.0 | 16.2 |
| – Percent of Open Interest Shorts: | 23.1 | 57.3 | 15.0 |
| – Net Position: | 20,734 | -22,875 | 2,141 |
| – Gross Longs: | 60,684 | 75,972 | 27,973 |
| – Gross Shorts: | 39,950 | 98,847 | 25,832 |
| – Long to Short Ratio: | 1.5 to 1 | 0.8 to 1 | 1.1 to 1 |
| NET POSITION TREND: | |||
| – Strength Index Score (3 Year Range Pct): | 70.2 | 32.9 | 62.2 |
| – Strength Index Reading (3 Year Range): | Bullish | Bearish | Bullish |
| NET POSITION MOVEMENT INDEX: | |||
| – 6-Week Change in Strength Index: | 19.9 | -18.4 | 8.5 |
Japanese Yen Futures:
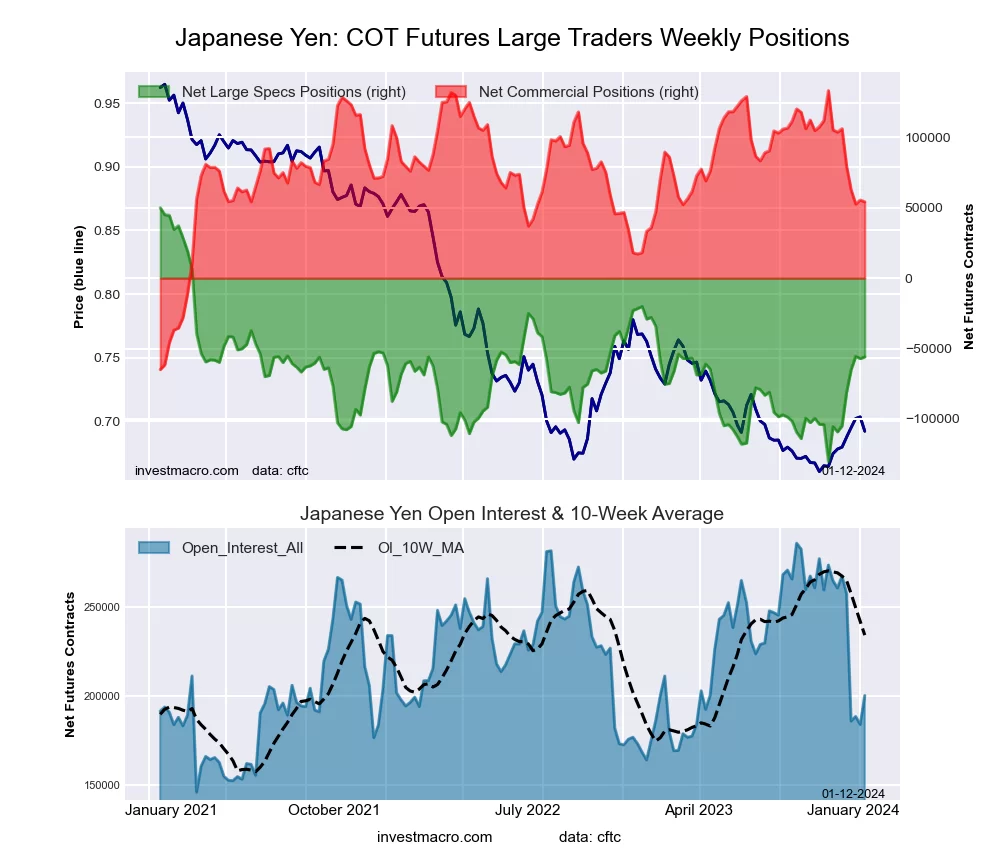 The Japanese Yen large speculator standing this week equaled a net position of -55,949 contracts in the data reported through Tuesday. This was a weekly boost of 1,246 contracts from the previous week which had a total of -57,195 net contracts.
This week’s current strength score (the trader positioning range over the past three years, measured from 0 to 100) shows the speculators are currently Bearish with a score of 41.2 percent. The commercials are Bullish with a score of 60.1 percent and the small traders (not shown in chart) are Bullish with a score of 65.5 percent.
Price Trend-Following Model: Uptrend
Our weekly trend-following model classifies the current market price position as: Uptrend. The current action for the model is considered to be: Hold – Maintain Long Position.
| JAPANESE YEN Statistics | SPECULATORS | COMMERCIALS | SMALL TRADERS |
| – Percent of Open Interest Longs: | 20.7 | 56.9 | 20.4 |
| – Percent of Open Interest Shorts: | 48.6 | 29.8 | 19.6 |
| – Net Position: | -55,949 | 54,191 | 1,758 |
| – Gross Longs: | 41,364 | 113,876 | 40,937 |
| – Gross Shorts: | 97,313 | 59,685 | 39,179 |
| – Long to Short Ratio: | 0.4 to 1 | 1.9 to 1 | 1.0 to 1 |
| NET POSITION TREND: | |||
| – Strength Index Score (3 Year Range Pct): | 41.2 | 60.1 | 65.5 |
| – Strength Index Reading (3 Year Range): | Bearish | Bullish | Bullish |
| NET POSITION MOVEMENT INDEX: | |||
| – 6-Week Change in Strength Index: | 29.6 | -25.0 | -8.8 |
Swiss Franc Futures:
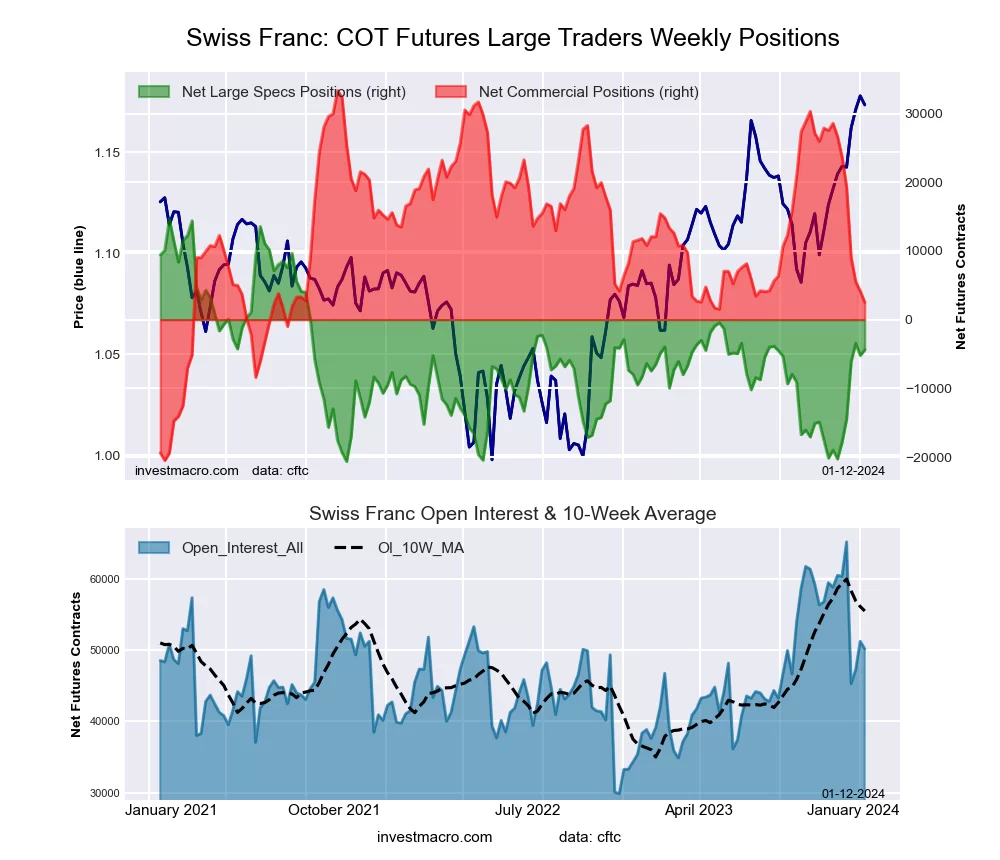 The Swiss Franc large speculator standing this week equaled a net position of -4,392 contracts in the data reported through Tuesday. This was a weekly gain of 823 contracts from the previous week which had a total of -5,215 net contracts.
This week’s current strength score (the trader positioning range over the past three years, measured from 0 to 100) shows the speculators are currently Bearish with a score of 46.1 percent. The commercials are Bearish with a score of 42.8 percent and the small traders (not shown in chart) are Bullish with a score of 68.8 percent.
Price Trend-Following Model: Strong Uptrend
Our weekly trend-following model classifies the current market price position as: Strong Uptrend. The current action for the model is considered to be: Hold – Maintain Long Position.
| SWISS FRANC Statistics | SPECULATORS | COMMERCIALS | SMALL TRADERS |
| – Percent of Open Interest Longs: | 22.0 | 46.1 | 31.5 |
| – Percent of Open Interest Shorts: | 30.8 | 41.1 | 27.8 |
| – Net Position: | -4,392 | 2,524 | 1,868 |
| – Gross Longs: | 11,044 | 23,140 | 15,792 |
| – Gross Shorts: | 15,436 | 20,616 | 13,924 |
| – Long to Short Ratio: | 0.7 to 1 | 1.1 to 1 | 1.1 to 1 |
| NET POSITION TREND: | |||
| – Strength Index Score (3 Year Range Pct): | 46.1 | 42.8 | 68.8 |
| – Strength Index Reading (3 Year Range): | Bearish | Bearish | Bullish |
| NET POSITION MOVEMENT INDEX: | |||
| – 6-Week Change in Strength Index: | 45.0 | -44.9 | 30.2 |
Canadian Dollar Futures:
 The Canadian Dollar large speculator standing this week equaled a net position of -7,380 contracts in the data reported through Tuesday. This was a weekly boost of 13,751 contracts from the previous week which had a total of -21,131 net contracts.
This week’s current strength score (the trader positioning range over the past three years, measured from 0 to 100) shows the speculators are currently Bullish with a score of 52.9 percent. The commercials are Bullish with a score of 50.4 percent and the small traders (not shown in chart) are Bearish with a score of 43.2 percent.
Price Trend-Following Model: Strong Uptrend
Our weekly trend-following model classifies the current market price position as: Strong Uptrend. The current action for the model is considered to be: Hold – Maintain Long Position.
| CANADIAN DOLLAR Statistics | SPECULATORS | COMMERCIALS | SMALL TRADERS |
| – Percent of Open Interest Longs: | 24.6 | 54.7 | 19.4 |
| – Percent of Open Interest Shorts: | 29.0 | 55.7 | 14.1 |
| – Net Position: | -7,380 | -1,787 | 9,167 |
| – Gross Longs: | 42,286 | 93,842 | 33,353 |
| – Gross Shorts: | 49,666 | 95,629 | 24,186 |
| – Long to Short Ratio: | 0.9 to 1 | 1.0 to 1 | 1.4 to 1 |
| NET POSITION TREND: | |||
| – Strength Index Score (3 Year Range Pct): | 52.9 | 50.4 | 43.2 |
| – Strength Index Reading (3 Year Range): | Bullish | Bullish | Bearish |
| NET POSITION MOVEMENT INDEX: | |||
| – 6-Week Change in Strength Index: | 46.9 | -43.3 | 29.9 |
Australian Dollar Futures:
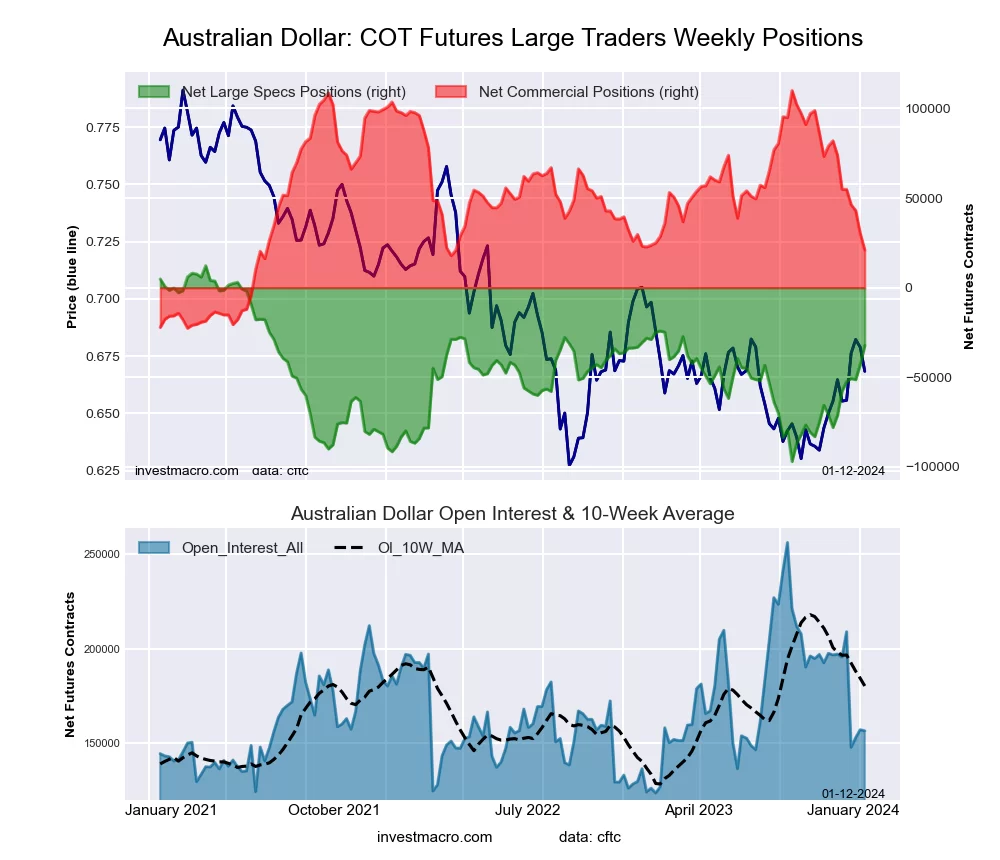 The Australian Dollar large speculator standing this week equaled a net position of -32,274 contracts in the data reported through Tuesday. This was a weekly boost of 10,619 contracts from the previous week which had a total of -42,893 net contracts.
This week’s current strength score (the trader positioning range over the past three years, measured from 0 to 100) shows the speculators are currently Bullish with a score of 59.2 percent. The commercials are Bearish with a score of 32.9 percent and the small traders (not shown in chart) are Bullish with a score of 79.8 percent.
Price Trend-Following Model: Uptrend
Our weekly trend-following model classifies the current market price position as: Uptrend. The current action for the model is considered to be: Hold – Maintain Long Position.
| AUSTRALIAN DOLLAR Statistics | SPECULATORS | COMMERCIALS | SMALL TRADERS |
| – Percent of Open Interest Longs: | 30.3 | 49.5 | 18.0 |
| – Percent of Open Interest Shorts: | 50.9 | 36.0 | 10.9 |
| – Net Position: | -32,274 | 21,070 | 11,204 |
| – Gross Longs: | 47,326 | 77,374 | 28,218 |
| – Gross Shorts: | 79,600 | 56,304 | 17,014 |
| – Long to Short Ratio: | 0.6 to 1 | 1.4 to 1 | 1.7 to 1 |
| NET POSITION TREND: | |||
| – Strength Index Score (3 Year Range Pct): | 59.2 | 32.9 | 79.8 |
| – Strength Index Reading (3 Year Range): | Bullish | Bearish | Bullish |
| NET POSITION MOVEMENT INDEX: | |||
| – 6-Week Change in Strength Index: | 35.7 | -39.8 | 33.6 |
New Zealand Dollar Futures:
 The New Zealand Dollar large speculator standing this week equaled a net position of -1,767 contracts in the data reported through Tuesday. This was a weekly reduction of -1,221 contracts from the previous week which had a total of -546 net contracts.
This week’s current strength score (the trader positioning range over the past three years, measured from 0 to 100) shows the speculators are currently Bullish with a score of 50.8 percent. The commercials are Bearish with a score of 44.3 percent and the small traders (not shown in chart) are Bullish with a score of 74.1 percent.
Price Trend-Following Model: Uptrend
Our weekly trend-following model classifies the current market price position as: Uptrend. The current action for the model is considered to be: Hold – Maintain Long Position.
| NEW ZEALAND DOLLAR Statistics | SPECULATORS | COMMERCIALS | SMALL TRADERS |
| – Percent of Open Interest Longs: | 42.1 | 41.0 | 13.4 |
| – Percent of Open Interest Shorts: | 46.7 | 41.5 | 8.3 |
| – Net Position: | -1,767 | -202 | 1,969 |
| – Gross Longs: | 16,221 | 15,791 | 5,164 |
| – Gross Shorts: | 17,988 | 15,993 | 3,195 |
| – Long to Short Ratio: | 0.9 to 1 | 1.0 to 1 | 1.6 to 1 |
| NET POSITION TREND: | |||
| – Strength Index Score (3 Year Range Pct): | 50.8 | 44.3 | 74.1 |
| – Strength Index Reading (3 Year Range): | Bullish | Bearish | Bullish |
| NET POSITION MOVEMENT INDEX: | |||
| – 6-Week Change in Strength Index: | 46.5 | -46.4 | 30.8 |
Mexican Peso Futures:
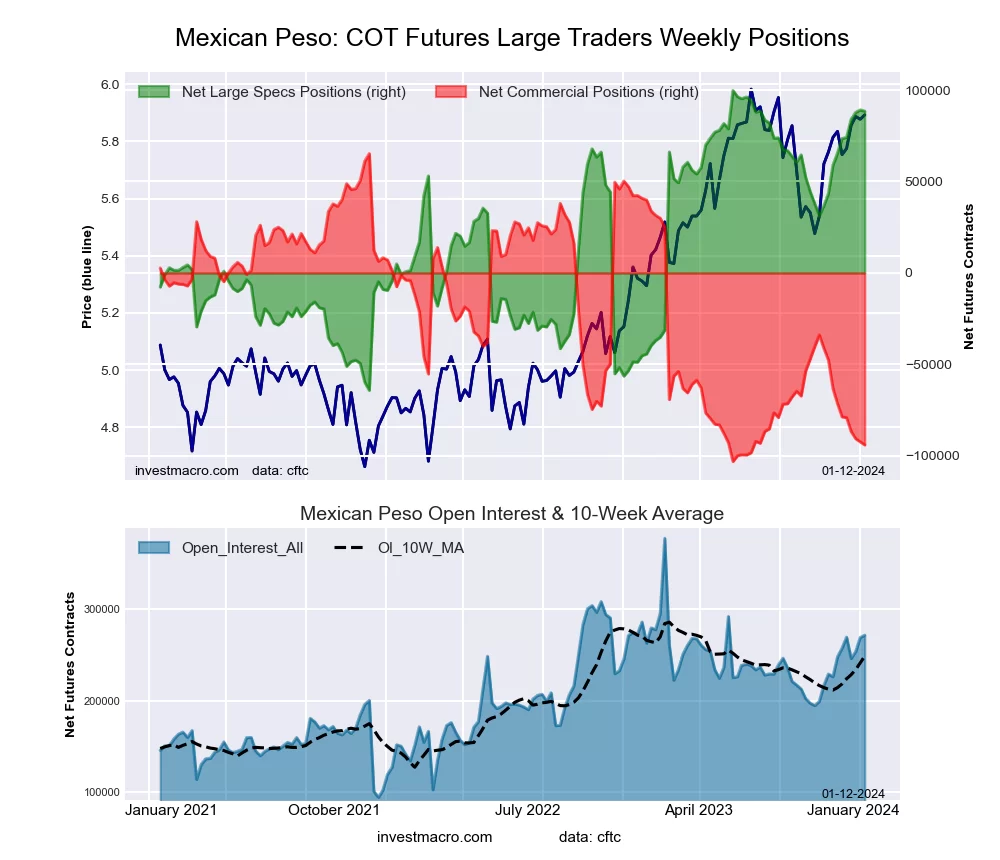 The Mexican Peso large speculator standing this week equaled a net position of 88,439 contracts in the data reported through Tuesday. This was a weekly decrease of -659 contracts from the previous week which had a total of 89,098 net contracts.
This week’s current strength score (the trader positioning range over the past three years, measured from 0 to 100) shows the speculators are currently Bullish-Extreme with a score of 93.1 percent. The commercials are Bearish-Extreme with a score of 5.4 percent and the small traders (not shown in chart) are Bearish with a score of 46.7 percent.
Price Trend-Following Model: Strong Uptrend
Our weekly trend-following model classifies the current market price position as: Strong Uptrend. The current action for the model is considered to be: Hold – Maintain Long Position.
| MEXICAN PESO Statistics | SPECULATORS | COMMERCIALS | SMALL TRADERS |
| – Percent of Open Interest Longs: | 52.9 | 42.7 | 3.0 |
| – Percent of Open Interest Shorts: | 20.3 | 77.4 | 1.0 |
| – Net Position: | 88,439 | -94,006 | 5,567 |
| – Gross Longs: | 143,436 | 115,940 | 8,184 |
| – Gross Shorts: | 54,997 | 209,946 | 2,617 |
| – Long to Short Ratio: | 2.6 to 1 | 0.6 to 1 | 3.1 to 1 |
| NET POSITION TREND: | |||
| – Strength Index Score (3 Year Range Pct): | 93.1 | 5.4 | 46.7 |
| – Strength Index Reading (3 Year Range): | Bullish-Extreme | Bearish-Extreme | Bearish |
| NET POSITION MOVEMENT INDEX: | |||
| – 6-Week Change in Strength Index: | 14.0 | -13.4 | -2.5 |
Brazilian Real Futures:
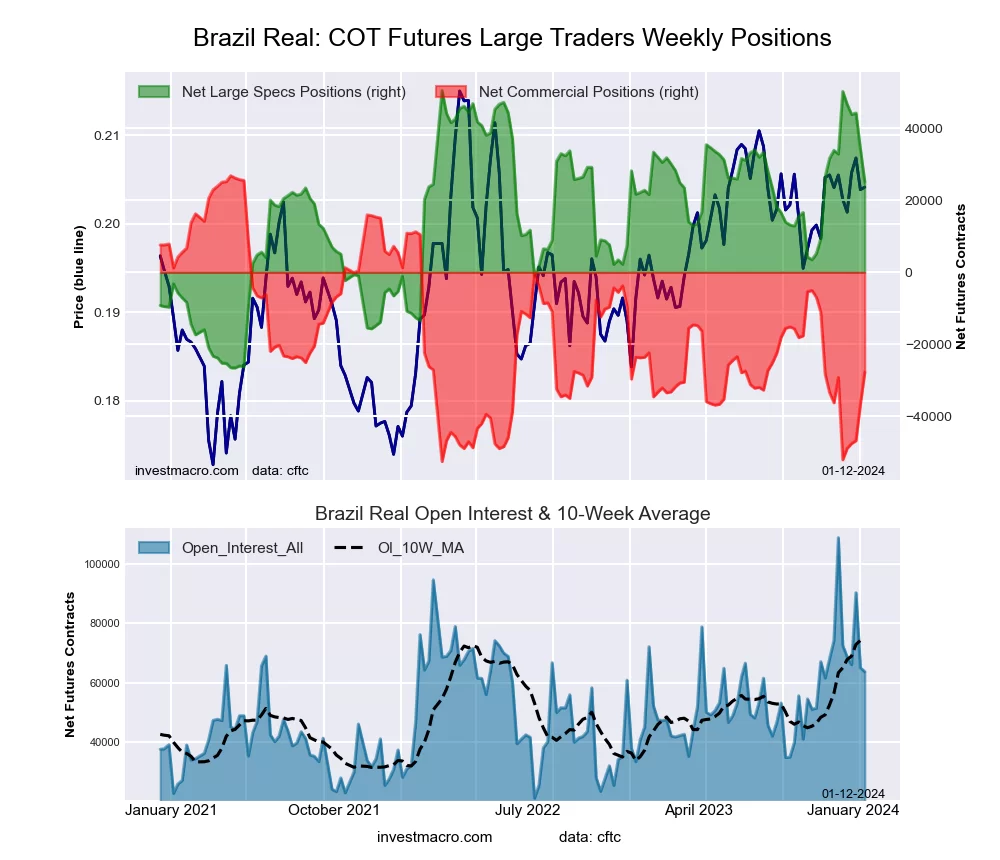 The Brazilian Real large speculator standing this week equaled a net position of 25,114 contracts in the data reported through Tuesday. This was a weekly lowering of -9,193 contracts from the previous week which had a total of 34,307 net contracts.
This week’s current strength score (the trader positioning range over the past three years, measured from 0 to 100) shows the speculators are currently Bullish with a score of 67.1 percent. The commercials are Bearish with a score of 31.3 percent and the small traders (not shown in chart) are Bullish with a score of 59.0 percent.
Price Trend-Following Model: Strong Uptrend
Our weekly trend-following model classifies the current market price position as: Strong Uptrend. The current action for the model is considered to be: Hold – Maintain Long Position.
| BRAZIL REAL Statistics | SPECULATORS | COMMERCIALS | SMALL TRADERS |
| – Percent of Open Interest Longs: | 69.2 | 24.3 | 6.1 |
| – Percent of Open Interest Shorts: | 29.8 | 67.9 | 2.0 |
| – Net Position: | 25,114 | -27,756 | 2,642 |
| – Gross Longs: | 44,100 | 15,478 | 3,888 |
| – Gross Shorts: | 18,986 | 43,234 | 1,246 |
| – Long to Short Ratio: | 2.3 to 1 | 0.4 to 1 | 3.1 to 1 |
| NET POSITION TREND: | |||
| – Strength Index Score (3 Year Range Pct): | 67.1 | 31.3 | 59.0 |
| – Strength Index Reading (3 Year Range): | Bullish | Bearish | Bullish |
| NET POSITION MOVEMENT INDEX: | |||
| – 6-Week Change in Strength Index: | -10.1 | 1.9 | 58.6 |
Bitcoin Futures:
 The Bitcoin large speculator standing this week equaled a net position of -1,618 contracts in the data reported through Tuesday. This was a weekly increase of 603 contracts from the previous week which had a total of -2,221 net contracts.
This week’s current strength score (the trader positioning range over the past three years, measured from 0 to 100) shows the speculators are currently Bearish with a score of 42.1 percent. The commercials are Bullish-Extreme with a score of 84.5 percent and the small traders (not shown in chart) are Bearish with a score of 32.0 percent.
Price Trend-Following Model: Uptrend
Our weekly trend-following model classifies the current market price position as: Uptrend. The current action for the model is considered to be: Hold – Maintain Long Position.
| BITCOIN Statistics | SPECULATORS | COMMERCIALS | SMALL TRADERS |
| – Percent of Open Interest Longs: | 76.9 | 6.2 | 5.8 |
| – Percent of Open Interest Shorts: | 83.0 | 3.3 | 2.7 |
| – Net Position: | -1,618 | 779 | 839 |
| – Gross Longs: | 20,654 | 1,654 | 1,561 |
| – Gross Shorts: | 22,272 | 875 | 722 |
| – Long to Short Ratio: | 0.9 to 1 | 1.9 to 1 | 2.2 to 1 |
| NET POSITION TREND: | |||
| – Strength Index Score (3 Year Range Pct): | 42.1 | 84.5 | 32.0 |
| – Strength Index Reading (3 Year Range): | Bearish | Bullish-Extreme | Bearish |
| NET POSITION MOVEMENT INDEX: | |||
| – 6-Week Change in Strength Index: | 1.9 | -0.3 | -2.6 |
Article By InvestMacro – Receive our weekly COT Newsletter
*COT Report: The COT data, released weekly to the public each Friday, is updated through the most recent Tuesday (data is 3 days old) and shows a quick view of how large speculators or non-commercials (for-profit traders) were positioned in the futures markets.
The CFTC categorizes trader positions according to commercial hedgers (traders who use futures contracts for hedging as part of the business), non-commercials (large traders who speculate to realize trading profits) and nonreportable traders (usually small traders/speculators) as well as their open interest (contracts open in the market at time of reporting). See CFTC criteria here.


