The excitement of auto racing comes from split-second decisions and daring passes by fearless drivers. Imagine that scene, but without the driver – the car alone, guided by the invisible hand of artificial intelligence. Can the rush of racing unfold without a driver steering the course? It turns out that it can.
Enter autonomous racing, a field that’s not just about high-speed competition but also pushing the boundaries of what autonomous vehicles can achieve and improving their safety.
Over a century ago, at the dawn of automobiles, as society shifted from horse-drawn to motor-powered vehicles, there was public doubt about the safety and reliability of the new technology. Motorsport racing was organized to showcase the technological performance and safety of these horseless carriages. Similarly, autonomous racing is the modern arena to prove the reliability of autonomous vehicle technology as driverless cars begin to hit the streets.
Autonomous racing’s high-speed trials mirror the real-world challenges that autonomous vehicles face on streets: adjusting to unexpected changes and reacting in fractions of a second. Mastering these challenges on the track, where speeds are higher and reaction times shorter, leads to safer autonomous vehicles on the road.
Autonomous race cars pass, or ‘overtake,’ others on the Las Vegas Motor Speedway track.
I am a computer science professor who studies artificial intelligence, robotics and autonomous vehicles, and I lead the Cavalier Autonomous Racing team at the University of Virginia. The team competes in the Indy Autonomous Challenge, a global contest where universities pit fully autonomous Indy race cars against each other. Since its 2021 inception, the event has drawn top international teams to prestigious circuits like the Indianapolis Motor Speedway. The field, marked by both rivalry and teamwork, shows that collective problem-solving drives advances in autonomous vehicle safety.
At the Indy Autonomous Challenge passing competition held at the 2024 Consumer Electronics Show in Las Vegas in January 2024, our Cavalier team clinched second place and hit speeds of 143 mph (230 kilometers per hour) while autonomously overtaking another race car, affirming its status as a leading American team. TUM Autonomous Motorsport from the Technical University of Munich won the event.
An autonomous race car built by the Technical University of Munich prepares to pass the University of Virginia’s entrant. Cavalier Autonomous Racing, University of Virginia, CC BY-ND
Pint-size beginnings
The field of autonomous racing didn’t begin with race cars on professional race tracks but with miniature cars at robotics conferences. In 2015, my colleagues and I engineered a 1/10 scale autonomous race car. We transformed a remote-controlled car into a small but powerful research and educational tool, which I named F1tenth, playing on the name of the traditional Formula One, or F1, race car. The F1tenth platform is now used by over 70 institutions worldwide to construct their miniaturized autonomous racers.
The F1tenth Autonomous Racing Grand Prix is now a marquee event at robotics conferences where teams from across the planet gather, each wielding vehicles that are identical in hardware and sensors, to engage in what is essentially an intense “battle of algorithms.” Victory on the track is claimed not by raw power but by the advanced AI algorithms’ control of the cars.
These race cars are small, but the challenges to autonomous driving are sizable.
F1tenth has also emerged as an engaging and accessible gateway for students to delve into robotics research. Over the years, I’ve reached thousands of students via my courses and online lecture series, which explains the process of how to build, drive and autonomously race these vehicles.
Getting real
Today, the scope of our research has expanded significantly, advancing from small-scale models to actual autonomous Indy cars that compete at speeds of upward of 150 mph (241 kph), executing complex overtaking maneuvers with other autonomous vehicles on the racetrack. The cars are built on a modified version of the Indy NXT chassis and are outfitted with sensors and controllers to allow autonomous driving. Indy NXT race cars are used in professional racing and are slightly smaller versions of the Indy cars made famous by the Indianapolis 500.
The Cavalier Autonomous Racing team stands behind their driverless race car. Cavalier Autonomous Racing, University of Virginia, CC BY-ND
The gritty reality of racing these advanced machines on real racetracks pushes the boundaries of what autonomous vehicles can do. Autonomous racing takes the challenges of robotics and AI to new levels, requiring researchers to refine our understanding of how machines perceive their environment, make safe decisions and control complex maneuvers at a high speed where traditional methods begin to falter.
Precision is critical, and the margin for error in steering and acceleration is razor-thin, requiring a sophisticated grasp and exact mathematical description of the car’s movement, aerodynamics and drivetrain system. In addition, autonomous racing researchers create algorithms that use data from cameras, radar and lidar, which is like radar but with lasers instead of radio waves, to steer around competitors and safely navigate the high-speed and unpredictable racing environment.
My team has shared the world’s first open dataset for autonomous racing, inviting researchers everywhere to join in refining the algorithms that could help define the future of autonomous vehicles.
The data from the competitions is available for other researchers to use.
Crucible for autonomous vehicles
More than just a technological showcase, autonomous racing is a critical research frontier. When autonomous systems can reliably function in these extreme conditions, they inherently possess a buffer when operating in the ordinary conditions of street traffic.
Autonomous racing is a testbed where competition spurs innovation, collaboration fosters growth, and AI-controlled cars racing to the finish line chart a course toward safer autonomous vehicles.
Michael Ballanger of GGM Advisory Inc. shares his thoughts on current movements in the stock market as well as one gold stock he believes is a Buy.
If Nvidia (NVDA:NASDAQ) is the poster child for “irrational exuberance version-2024,” then the clarion call for “irrational revulsion” must be Newmont Corp. (NEM:NYSE), the largest gold producer in the world that just decided to dump six bottom-tier projects that cost them an arm and a leg over the past decade in an expansion plan that has resulted in the following result:
The reported net loss of $2.5 billion was driven by $1.9 billion in impairment charges, $1.5 billion in reclamation charges, and $464 million in Newcrest transaction and integration costs; these items are excluded from adjusted earnings results.
Their AISC has risen from $1,233/oz. in 2023 to $1,444/oz. while Net Free Cash Flow for a company generating $2.8 billion in revenue was a paltry $88 million. The decision to dump those bottom-tier projects is simple: their institutional shareholders are totally disgusted with the way the company is being run. They say that the brokerage industry is notorious for its “Hire at the top; Fire at the bottom” approach to recruiting.
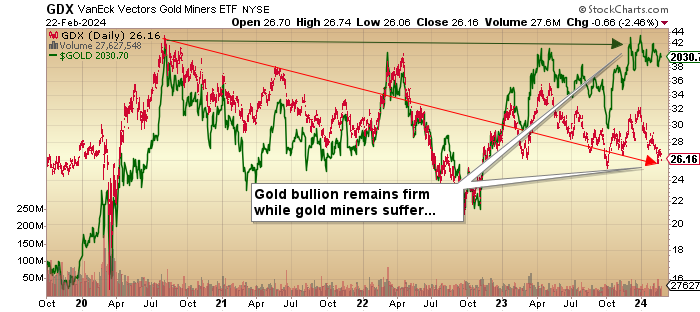
In the gold mining business, every major producer has streamlined operations to reflect better cash management except Newmont. So, with only a pittance of free cash” being generated from that mountain of processed rock, they decide to bring to perfection the “Buy high; Sell low” expansion strategy. It is no wonder that the Senior Gold Miner ETF (GDX:US) is sitting here at within $0.54 of a 52-week low.
Thank you, Newmont.
After over 45 years in the capital markets, most of which were focused on the precious metals exploration and development names, I am constantly amazed that any young person looking to build a portfolio of winners would ever be drawn to the mining industry. Forget the fact that technology is sexier, trendier, and more socially acceptable than climate-threatening resource extraction. Instead, focus on one simple reality: gold miners are lousy investments.
GDX:US topped out in August 2020 along with a gold price that broke the $2,000/oz. barrier for the first time. Since then, gold has been able to stay elevated as central banks and Asian buyers inhale the physical product. However, thanks largely to the overweighted position held in Newmont by the GDX:US ETF, investors seeking the leverage of shares over physical have lost money. You could have bought shares in Tesla Inc. (TSLA:NASDAQ) rather than the GDX:US in August 2020 at $100 and still have a double despite TSLA’s horrid operating performance and 53.7% decline from its 2022 top.
The gold bugs have been talking about the looming upside explosion in gold for years, and they are even more adamant about silver. Eric Sprott was recently saying that “the silver bull will only start at $50!” while Peter Schiff continues to tell Bitcoin holders that they had better dump their crypto and reallocate to gold immediately lest they lose all their money.
In August 2020, when GDX traded at $42, BTC could have been bought at $11,000 per coin. Today, it is over $50,000, with GDX at $26.16. Is it any wonder that the youngsters who run all the money these days avoid the gold miners?
Now, I am a fervent bull on the outlook for gold bullion prices and think that, eventually, silver will follow along. However, in the cold, hard light of day, gold mining companies are not gold bullion. Back before the turn of the century, they were beautiful leverage plays to the gold price, but since the GFC in 2008 and the creation of all forms of surrogate welfare-state programs aimed at protecting the U.S. equity markets, the Pavlovian dinner bell prompted the new wave of youthful stock investors to own anything but the gold miners.
Fed rate cuts coming?
Buy NVidia.
Unemployment figures rising?
Buy Super Micro Computer Inc.
Inflation running “hot”?
Buy Bitcoin and avoid currency debasement.
High-traffic podcast celebrities love to use the old horse chestnut that “I love to buy that which is hated” but investors that have followed that steaming pile of dogma since 2020 and bought into the most-hated asset class — silver stocks followed closely by gold stocks — have been taught a valuable lesson that may have been neglected by these rockstar resource gurus and that is you might want to wait until the “hate meter” goes total “red line” before you let your contrarian investment strategy take you kicking and screaming into the poor house.
Having been a firm believer back in 2020 that soaring debt levels and deficits the world over would send investors piling into gold first and then the miners with the biggest leverage plays being the junior gold developers, I look into the mirror and ask what set of circumstances could be more gold-bullish than where we are today. Fiscal and monetary mayhem, geopolitical unrest, pandemics, shutdowns, and raging inflation have failed to send the kiddies into the gold and silver space.
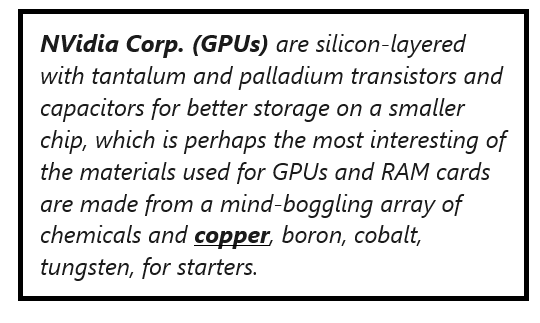
Copper
Time has proven that tech stocks are a better inflation hedge than anything, and that is not going to change until the markets make it change. Until then, I will focus on the one metal that the kiddies can understand — copper. They understood and bought into the lithium narrative until it no longer worked, but not before taking enormous profits out of the battery metals mania.
Next, they fully grasped the notion that the cleanest replacement for fossil fuels in the expansion of the electrification movement was nuclear power, and the metal driving that mania was (and is) uranium. They have been taking enormous profits out of that frenzy as well. While fundamentals for lithium and uranium are diametrically opposite, uranium demand is going to go vertical as newly constructed reactors go online. The kiddies get that.
However, they have learned that when a sector stops treating them nicely, they bolt. Since the arrival of 2024, the uranium stocks have been correcting, with Cameco Corp. (CCO:TSX; CCJ:NYSE) now closing in on bear market territory. That leaves the one metal so critical to the electrification movement — copper — and it is my opinion that this new wave of money managers looking to build upon the massive profits bestowed upon them by avoiding the gold and silver space is going to see the demand-supply dynamic that is estimated by every analyst on the planet to take copper to $6-8/lb. by the end of the decade. Just as the move in lithium from 35,000 CNY/mt to 600,000 CNY/mt made billionaires in 2022, the move in uranium from $20/lb. to $106/lb. made billionaires in 2023. A move in copper from $3.80 to $6-8 will have the same effect on the junior copper stories that similar moves had on the junior lithium and uranium stories.
That is why I am loading the portfolio cannon with copper names, and that will continue until I see fifty tweets an hour talking about $10/lb. copper. Right now, nobody is even glimpsing at copper, and that is why I want to own it.
I do not know whether to melt down in a fit of envy or simply to resign myself to the inconvenient truth that today’s emerging legions of stock investors prefer the finished product to the raw materials when it comes to a microchip that sells for $10,000 that allows a robot to have a semi-lucid conversation with you.
The fact remains that copper remains a critical component of the technology sector whether found in motherboards, the power cords, or the microchips described in the graphic posted to the left.
GLD:US
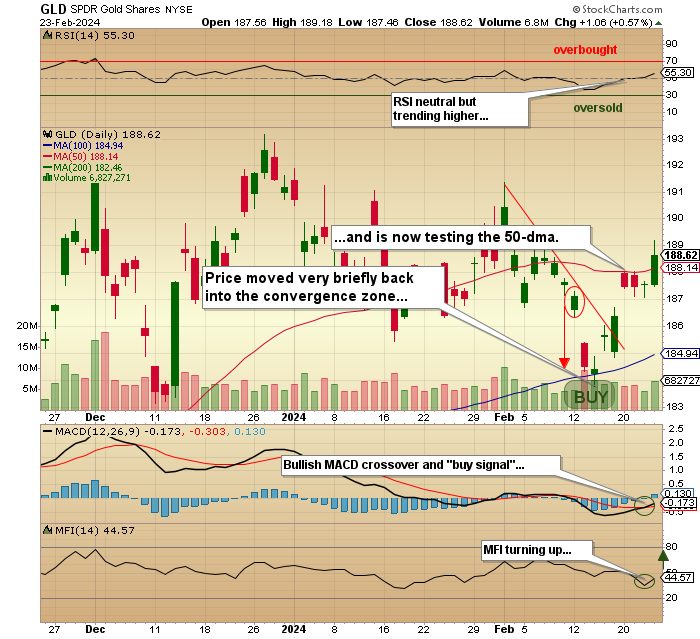
For the past three weeks, I had been drawing reference to those two rising moving averages (100 and 200-dma lines) and how my entry level was going to be in the mid-range of that convergence zone. Well, I got that move on Valentine’s Day, but I was so busy dealing with overpriced “wilty” long stems for my sweetheart that I missed the move.
GLD:US traded beautifully down through the upper boundary of the convergence zone to $183.78 (100-dma was at $184.33) and promptly reversed upward, triggering a textbook MACD “buy signal” and an upturn in the Money Flow Indicator as well. I could have sworn it was waving “bye-bye” at me (while thumbing its nose) as it rocketed northward, closing higher last week and again this week to go out at $188.62 after trading as high as $189.18.
They say that a man has to “pay the price” for love, so I guess I will have to grin and bear it, but I waited for nearly a month to re-establish that position and to have it elude me in favor of domestic harmony is somewhat maddening. Based on my revised entry point for the GLD call options, I figure that a dozen roses cost U.S. $2,300, and while my significant other most certainly is worth the consideration, I may need to learn how to set price alarms on my cell phone to avoid costly mistakes like that in the future.
I wound up taking a 60% position in the GLD June $185 calls under $8 but refrained from adding on Friday as prices took a sizeable leap northward as the Chinese buyers returned to the market after their New Year celebrations. As exasperated as I am with the gold miners, there is nothing wrong whatsoever in the technical set-up for gold bullion. I am adamant that new, all-time, sustainable highs will be seen by the end of Spring and that once the shackles of suppression are broken, the move in gold will drag the miners (and silver) higher. If mean reversion is to be normalized, the amplitude of the move in gold mining stocks will turn more than a few heads.
Cameco Corp.
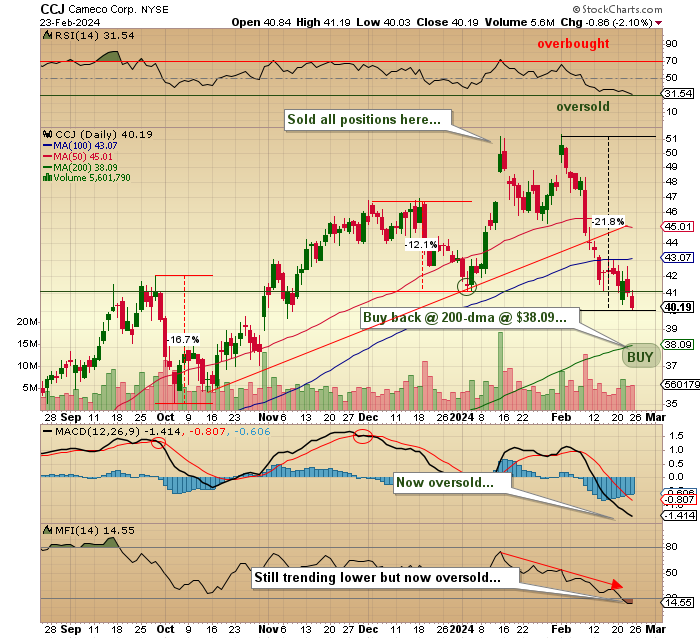
It was on January 12 that I told subscribers that I was liquidating all Cameco Corp. (CCO:TSX; CCJ:NYSE)stock and option holdings as well as a long-term position in Western Uranium & Vanadium Corp. (WUC:CSE; WSTRF:OTCQX)with the former trading above $51 and the later on its way to its 52-week high at CA$2.60.
Hard to imagine but the first purchase I made of WUC shares was in 2017 at $1.70 so it took seven years to finally muster up the courage to exit. Within a few hours of the blogosphere and Twitterverse learning of my decision to exit, my email and Twitter inboxes were inundated with accusatory messages, with the common theme being that I did not “get it,” as in the correct interpretation of the uranium story and why I was going to regret my decision “for the rest of my life.”
One email exchange had the sender reciting the ten reasons that uranium was going to $300/lb. and why CCJ was going to $100. It reminded me of the lithium narrative a year ago going into PDAC 2023 with lithium deals the talk of the town.
Cabbies shuttling conference attendees back and forth between Yorkville and the Metro Convention Centre were reciting the ten reasons why lithium was headed to $1 million per pound and why anyone selling was “an idiot.”
I tried to explain that every single one of those ten reasons contained in the uranium narrative perfectly rationalized the move from under $20 in 2017 to over $100 in 2024. If the average investor is able to recite the reasons why any particular narrative justifies a move, the move is usually over. That is just the reality of how the discounting mechanism works in capital markets.
Now, despite the outrage in the retail community over this much-needed correction, I am no longer a seller of the uranium or lithium names; in fact, I am looking to buy back my position in Cameco Corp. at around the 200-dma at $38.09. since my sell above $51, it has shed over 21% from the all-time high at $51.33, so while it is technically now in bear market territory, I urge the angry young men out there to revisit the ten reasons why uranium trades 400% higher than where it was in 2020.
The CCJ exit was based 100% on sentiment and had nothing to do with the demand-supply equilibrium that is as bullish as I have ever encountered in forty-five years of carving up capital markets. I remain a bear on the lithium space because EV demand is quickly waning, and that spells “glut” in the lithium-ion battery world.
If that structural deficit fails to return before 2028, a great many hard-rock projects are going to be mothballed, and if there is any three-word combination that is universally hated by mining investors, it is “care and maintenance.”
Getchell Gold
One of the biggest challenges of my career was completed successfully last month thanks to the contributions made by Getchell Gold Corp. (GTCH:CSE; GGLDF:OTCQB) shareholders in raising over CA$3.5mm in an extremely difficult funding environment.
When I was in the investment banking world in my past life, I recall some difficult raises that involved actually earning one’s fees, but nothing will ever compare to the difficulty in winning over new investors to a project (Fondaway Canyon, Nevada) that has an inferred and indicated resource of over 2 million ounces of gold, wide open along strike in all directions and to depth.
Map from 2022
This successful financing allowed GTCH to make the final payment of US$1.6 million to Canagold Resources Ltd. and secure 100% ownership of the Fondaway Canyon project. During the last quarter of 2023, in discussions with various investor groups, it became apparent that Getchell was suffering from an image problem.
Having been a shareholder since 2018 and during the acquisition of the project, I could never understand why the prior owners sold it to Getchell because some of the high-grade intercepts (like 25m of 10.4 g/t Au in 2022) were simply spectacular.
However, I found that many of the prospective investors were getting negative feedback from bankers and brokers that Fondaway has either metallurgical issues that prompted many of the prior owners to walk away.
Yesterday, I learned that the actual reason that prior operators declined to advance the project had nothing to do with the drilling results or the metallurgy. Up until last year, there was a zone called the Stillwater “Wilderness Survey Area” (“WSA”) that was actually infringing upon the boundaries of the proposed open pit. In fact, former operators Canagold Resource Corp. completed a 43101-compliant report in April 2017 that makes reference to “possible pit constraints” related to the WSA boundary.
Well, in 2023, the state ruled on the boundary, and it was pushed back by over a kilometer from the proposed pit locations. In other words, the presence of the WSA is no longer an issue. In the past, operators felt that any exploration along strike would infringe upon the WSA so not only did they refrain from engaging in further exploration efforts, they felt that the issue was far too sensitive to engage the legislators. Getchell management did engage, and after the ruling opened up the ground, they moved with laser-like speed to stake the ground required to protect them and thus ensure that it remained wide open along strike and able to model a starter pit on 100%-owned ground.
If one follows the chain of events in the history of Fondaway Canyon dating back to the 1980s, it was never about the geology or the prospective nature of the deposit; it was always about the implications of the WSA on long-term planning. Each operator that owned it engaged in exploration and in limited open-pit mining, but they could never advance it. As for why I missed it is beyond me but if you drill down into the timeline, each prior operator got stymied by the WSA and Getchell was reluctant to broadcast the pending ruling because they did not want to alert competitors to the land being opened up because Getchell wanted to stake it.
Getchell is in the process of completing a metallurgical survey on Fondaway that will be needed in advance of the upcoming PEA and revised resource estimate. The deposit is classified as a “Tier Three Asset,” but at 3 million ounces, it moves to a “Tier Two Asset,” and while majors are inclined to stick with only a “Tier One Asset” (5 million ounces or more), a “Tier Two Asset” could easily attract the interest of a mid-tier suitor. It is estimated that a $5 million budget could move the needle to “Tier Two,” and if that happens with an improved funding environment in 2024, I can see a value-per-ounce threshold of at least $50/ounce.
If gold prices catch the bid that I expect by year-end and see a major break-out above $2,500/oz., that value-per-ounce number will be closer to $100/oz. A “Tier Two Asset” in that environment would be worth $300 million in M&A verbiage. If one assumes that there will be 200 million shares issued by the time the drilling funds are raised and if one further assumes that President Mike Sieb can duplicate the uncanny “hit ratio” demonstrated from 2020 to 2022, the valuation for Getchell will grow to around $1.50 per share. (Last trade was $0.1015.)
Now, the junior gold developers are still mired in the muck of dour sentiment that emanates from the top and resonates right down the gold miner food chain, starting with the NEM fiasco impacting everyone. However, this too shall pass, and when sentiment shifts with the resolution of the gold price revaluation, the leverage contained in the junior developer space will be compelling. It has been a long grind with GTCH, but I see the light at the end of what has been a very long tunnel it is indeed daylight and not the twinkle of quartz halogens barrelling towards us. Getchell Gold is a “Buy.”
Important Disclosures:
As of the date of this article, officers and/or employees of Streetwise Reports LLC (including members of their household) own securities of Cameco Corp., Western Uranium and Vanadium Corp., Getchell Gold Corp.
Michael Ballanger: I, or members of my immediate household or family, own securities of: Nvidia Corp. and Getchell Gold. I determined which companies would be included in this article based on my research and understanding of the sector.
Statements and opinions expressed are the opinions of the author and not of Streetwise Reports, Street Smart, or their officers. The author is wholly responsible for the accuracy of the statements. Streetwise Reports was not paid by the author to publish or syndicate this article. Streetwise Reports requires contributing authors to disclose any shareholdings in, or economic relationships with, companies that they write about. Any disclosures from the author can be found below. Streetwise Reports relies upon the authors to accurately provide this information and Streetwise Reports has no means of verifying its accuracy.
This article does not constitute investment advice and is not a solicitation for any investment. Streetwise Reports does not render general or specific investment advice, and the information on Streetwise Reports should not be considered a recommendation to buy or sell any security. Each reader is encouraged to consult with his or her personal financial adviser and perform their own comprehensive investment research. By opening this page, each reader accepts and agrees to Streetwise Reports’ terms of use and full legal disclaimer. Streetwise Reports does not endorse or recommend the business, products, services, or securities of any company.
This letter makes no guarantee or warranty on the accuracy or completeness of the data provided. Nothing contained herein is intended or shall be deemed to be investment advice, implied or otherwise. This letter represents my views and replicates trades that I am making but nothing more than that. Always consult your registered advisor to assist you with your investments. I accept no liability for any loss arising from the use of the data contained on this letter. Options and junior mining stocks contain a high level of risk that may result in the loss of part or all invested capital and therefore are suitable for experienced and professional investors and traders only. One should be familiar with the risks involved in junior mining and options trading and we recommend consulting a financial adviser if you feel you do not understand the risks involved.
Some stock market enthusiasts claim to be able to predict financial market trends with fantastic accuracy.
Despite the complexity of international finance, they assure us that substantial profits are within our reach if we follow their recommendations and imitate their behaviour.
But is it really possible to accurately predict the behaviour of financial markets?
As an expert in the psychology of decision-making who specializes in complexity research, I have had the opportunity to deepen my understanding of human cognition and its capacity to control real-world complex environments. For now, my conclusions are sobering and not simple.
It’s a mistake to assume that financial enthusiasts can predict the uncertain behaviour of markets.
Complex decisions
According to many researchers in decision-making science, understanding and managing complexity is the greatest challenge of the digital age. Complexity refers to the uncertain nature of the environments in which we make decisions every day.
While some of our financial choices may seem simple and self-evident (saving a portion of our income, setting a budget, repaying a debt), the environment in which these choices are made is unpredictable.
The strategies we adopt are certainly not infallible; our knowledge does not guarantee our success, and the effects of each of our decisions are uncertain and unique. This explains why the environments in which we make everyday decisions are actually highly complex. They include many interrelated factors that are constantly changing, with or without our intervention. Not to mention that the objectives we cherish are often themselves contradictory.
For example, how can we maximize investment returns while minimizing exposure to market fluctuations?
Facing financial complexity
Faced with financial complexity, human cognition tends to favour a reductionist approach to information processing, sometimes called “tunneling.” Faced with the overload of information generated by complexity, we tend to concentrate on one or a few specific aspects of a situation rather than all available information because too much information kills information. In other words, we take shortcuts. And guess what? These simplistic ways of thinking can lead to biased decisions.
We often make the mistake of attributing poor performance of our equity portfolio to a single event that stands out in our minds. We mistakenly believe that our investments will grow linearly when, in fact, they are vulnerable to exponential fluctuations caused by crises and unexpected events. We react poorly to unsuccessful investments by focusing on the consequences that could explain our financial difficulties, rather than by deepening our understanding of why the company in which we had blind faith (or the sector in which it operates) is experiencing difficulties.
Finally — and this is human nature — we tend to attribute responsibility for our failures to external factors beyond our control. For example, we might be tempted to blame losses incurred by certain businesses in the tourism sector on poor summer weather conditions. But in doing so, we overlook the importance of the quality of the products and services the businesses offer, or how hospitable their staff are.
And market enthusiasts in all this?
My most recent work supports the literature on complex problem-solving: whether we are experts or novices, understanding and mastering complexity is a daunting challenge.
Many market enthusiasts will demonstrate greater skill in devising an investment strategy, managing a portfolio or accessing certain investments.
However, it is a mistake to assume that they can predict the uncertain behaviour of the markets. The issue is not necessarily financial knowledge, but the natural limitations of human cognition when faced with complexity.
Faced with international finance, there is a “wall of complexity” beyond which it is particularly difficult to progress, and we are all subject to bias and errors.
So, how do we navigate through this?
Despite the many challenges of financial complexity, there is light at the end of the tunnel, provided we know what to do. While there are many studies to be conducted, researchers remain optimistic about specific methods that can already help us make more informed decisions.
1. Learn to think in systems
Systems thinking is a way of perceiving reality that helps us to better understand and work with real-world complex environments.
Whether you want to learn how to manage your budget better or invest wisely in the stock market, get into the habit of drawing visual representations of the financial challenges you want to tackle.
Cause-and-effect diagrams, which use simple symbols (a + sign to show a change in the same direction between two factors, and a – sign to show opposite changes), allow you to quickly illustrate the extent and scope of a problem by representing the relationships between the parts of the same system.
But make no mistake, some factors are difficult to predict.
In short, learn to think about the “consequences of the consequences” of your choices before making any decision.
2. Be bold, tolerate uncertainty
Learn to tolerate situations that, at first sight, have no clear solutions and leave you in doubt.
Financial markets are unpredictable and poorly structured, which creates “wicked problems.”
In these environments, ambiguity is the norm. Embracing uncertainty allows us to translate problems into opportunities, rather than making hasty decisions or locking ourselves into inaction.
There is no single “right solution” to a complex financial problem. Take a moment to evaluate your options.
3. Test your beliefs and biases
Don’t try to research and interpret financial information based on an assumption you hold dear. Confront your preconceived ideas using sources you would not normally consult because they take the opposite position.
What would a friend or colleague whom you like, but who fundamentally disagrees with you, say?
4. Don’t trust what comes easily to mind
Attending an inspiring conference on the sustainable economy or listening attentively to a TV report on financial ethics does not guarantee that the information that comes out of it will be helpful in the decision you have to make.
Although this information may be easier to retrieve from memory, it is not necessarily relevant. Don’t overestimate the likelihood of an event just because you can imagine it in great detail.
Get information from several sources and verify their reliability.
Now what?
One cannot become proficient in any area without putting in the necessary practice. Therefore, it is important for you to personally delve into the world of finance.
Through experience, you will develop your skills to better appreciate complexity. To help you do this, it’s a good idea to seek the assistance of a competent professional to guide you through this highly sophisticated process.
But remember this: when it comes to complexity, you are human, as are those who claim to be able to read the future.
The world’s second-largest cryptocurrency is on a tear!
Ethereum jumped to a fresh 22-month high on Wednesday thanks to the growing bullish market sentiment in the crypto space.
With prices trading above $3300 as of writing, further gains could be on the horizon due to anticipation over the ‘Dencun’ upgrade and potential approval of spot Ethereum Exchange-Traded Funds (ETFs).
Note: The ‘Dencun’ upgrade for Ethereum is expected to go live on March 13. It aims to improve the cryptocurrency’s scalability and efficiency. Should this result in increased demand, this may push prices higher.
Focusing on the technical picture…
Ethereum broke through a weekly resistance level yesterday. This is the result of a strong uptrend that started on 25 January and has been running with little interference from the bearish side.
A weekly resistance turned support level at 2877.42 did cause a short pause but the bulls quickly overcame that and showed their strength again. The same thing seems to be in store with the weekly resistance turned support level at 3216.64 and this produces opportunities in the lower time frame.
On the 4-hour chart, a strong uptrend can also clearly be seen with a potential new impulse wave in action. The short cycle Stochastics Oscillators as well as the longer price cycle Moving Average Convergence Divergence (MACD) Oscillators confirm the upward run and the target for any long positions taken by traders can be the next weekly resistance level at 3572.61.
After a long battle, Paris’s beloved bouquinistes will be staying put this summer. The decision, announced on 13 February by the French government, came after considerable public backlash to the police prefecture’s original plan to move part of the iconic Seine booksellers elsewhere for the inauguration of the Olympics Games on 26 July.
Meanwhile, less than six months away from the event, Parisians continue to grumble over a lack of consultations with locals, warnings of gridlocked traffic, closed metro stations, extensive video surveillance and other grievances. So for host countries, what was the point of the Olympics, again?
In academia, the debate about the potential positive and negative effects of large-scale sporting events is ongoing. Although these events are often associated with substantial economic losses, the long-term benefits are the main argument in favour of hosting them. These include the development of material and soft infrastructure such as hotels, restaurants or parks. Big games can also help put the host region on the map as an attractive place for sports and cultural events, and inspire a better entrepreneurial climate.
The pros and the cons of big sporting events?
The cost of these benefits, as the Parisians have realised, is steep. Host countries appear to suffer from increased tax burdens, low returns on public investments, high construction costs, and onerous running cost of facilities after the event. Communities can also be blighted by noise, pollution, and damage to the environment, while increased criminal activity and potential conflicts between locals and visitors can take a toll on their quality of life. As a result, in the recent past several major cities, including Rome and Hamburg, withdrew their bids to host the games.
A common feature of the economics of large-scale sporting events is that our expectations of them are more optimistic than what we make of them once they have taken place. Typically, expenditure tends to tip over the original budget, while the revenue-side indicators (such as the number of visitors) are rarely achieved.
Host regions typically have to jump through many hoops before they can begin to enjoy the benefits from large-scale sporting events such as the Olympics. Peter Skitterians/Pixabay, CC BY
When analysing the effect of hosting large-scale sporting events on tourist visits, it is important to take into consideration both the positive and negative components of the overall effect. While positive effects may be associated with visitors, negative effects may arise when “regular” tourists refuse to visit the location due to the event. This might be because of overloaded infrastructure, sharp increases in accommodation costs, and inconveniences associated with overcrowding or raucous or/and violent visitors. On top of that, reports of poverty or crime in the global media can actually undermine the location’s attractiveness.
When big sporting events crowd out regular tourists
In an article published in the Journal of Sports Economics with Igor Drapkin and Ilya Zverev, I assess the effects of hosting large-scale sporting events, such as Winter and Summer Olympics plus FIFA World Cups, on international tourist visits. We utilise a comprehensive dataset on flow of tourists covering the world’s largest destination and origin countries between 1995 and 2019. As a first step, we built an econometric model that effectively predicts the flow of tourists between any pair of countries in our data. Subsequently we compared the predicted tourist inflow in a hypothetical scenario where no large-scale sporting event would have taken place with the actual figures. If the actual figures exceed the predicted ones, we consider the event to have a net positive impact. Otherwise, we consider that it had a “crowding out” effect on “regular” tourists. While conducting this analysis, we distinguished between short-term (i.e., focusing just on the year of the event) and mid-term (year of the event plus three subsequent years).
Our results show that the effects of large-scale sporting events vary a lot across host countries: The World Cup in Japan and South Korea 2002 and South Africa 2010 were associated with a distinct increase in tourist arrivals, whereas all other World Cups were either neutral or negative. Among the Summer Olympics, China in 2008 is the only case with a significant positive effect on tourist inflows. The effects of the other four events (Australia 2000, Greece 2004, Great Britain 2012, and Brazil 2016) were found to be negative in the short- and medium-term. As for the Winter Olympics, the only positive case is Russia in 2014. The remaining five events had a negative impact except the one-year neutral effect for Japan 1998.
Following large-scale sporting events, host countries are therefore typically less visited by tourists. Out of the 18 hosting countries studied, 11 saw tourist numbers decline over four years, and three did not experience a significant change.
The case for cautious optimism
Our research indicates that the positive effect of hosting large-scale sporting events on tourist inflows is, at best, moderate. While many tourists are attracted by FIFA World Cups and Olympic games, the crowding-out effect of “regular” tourists is strong and often underestimated. This implies that tourists visiting for an event like the Olympics typically dissuade those who would have come for other reasons. Thus, efforts to attract new visitors should be accompanied by efforts to retain the already existing ones.
Large-scale sporting events should be considered as part of a long-term policy for promoting a territory to tourists rather than a standalone solution. Revealingly, our results indicate that it is easier to get a net increase in tourist inflows in countries that are less frequent destinations for tourists – for example, those in Asia or Africa. By contrast, the United States and Europe, both of which are traditionally popular with tourists, have no single case of a net positive effect. Put differently, the large-scale sporting events in Asia and Africa helped promote their host countries as tourist destinations, making the case for the initial investment. In the US and Europe, however, those in the last few decades brought little return, at least in terms of tourist inflow.
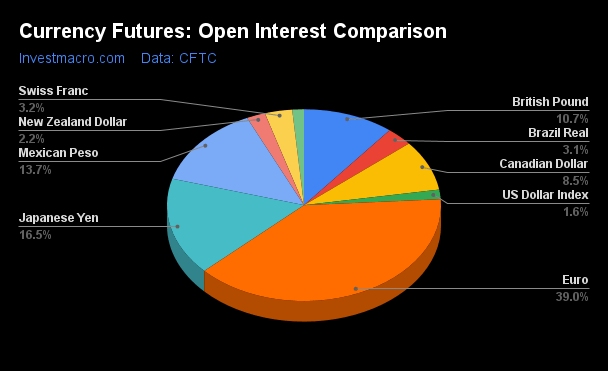
Here are the latest charts and statistics for the Commitment of Traders (COT) data published by the Commodities Futures Trading Commission (CFTC).
The latest COT data is updated through Tuesday February 20th and shows a quick view of how large market participants (for-profit speculators and commercial traders) were positioned in the futures markets. All currency positions are in direct relation to the US dollar where, for example, a bet for the euro is a bet that the euro will rise versus the dollar while a bet against the euro will be a bet that the euro will decline versus the dollar.
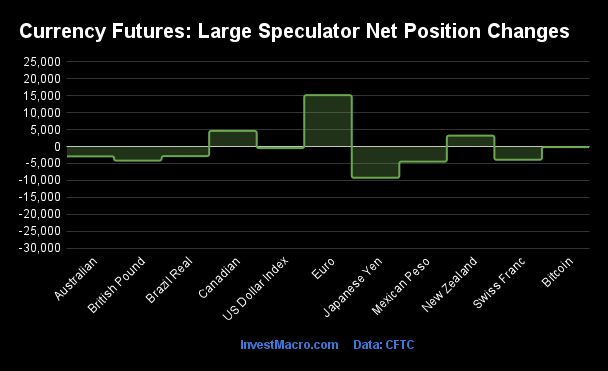
Weekly Speculator Changes led by Euro, Canadian Dollar & New Zealand Dollar
The COT currency market speculator bets were overall lower this week as three out of the eleven currency markets we cover had higher positioning while the other eight markets had lower speculator contracts.
Leading the gains for the currency markets was the EuroFX (15,178 contracts) with the Canadian Dollar (4,619 contracts) and the New Zealand Dollar (3,219 contracts) also having positive weeks.
The currencies seeing declines in speculator bets on the week were the Japanese Yen (-9,242 contracts), the Mexican Peso (-4,449 contracts), the British Pound (-4,160 contracts), the Swiss Franc (-3,909 contracts), the Australian Dollar (-2,899 contracts), the Brazilian Real (-2,826 contracts), the US Dollar Index (-456 contracts) and Bitcoin (-177 contracts) also seeing lower bets on the week.
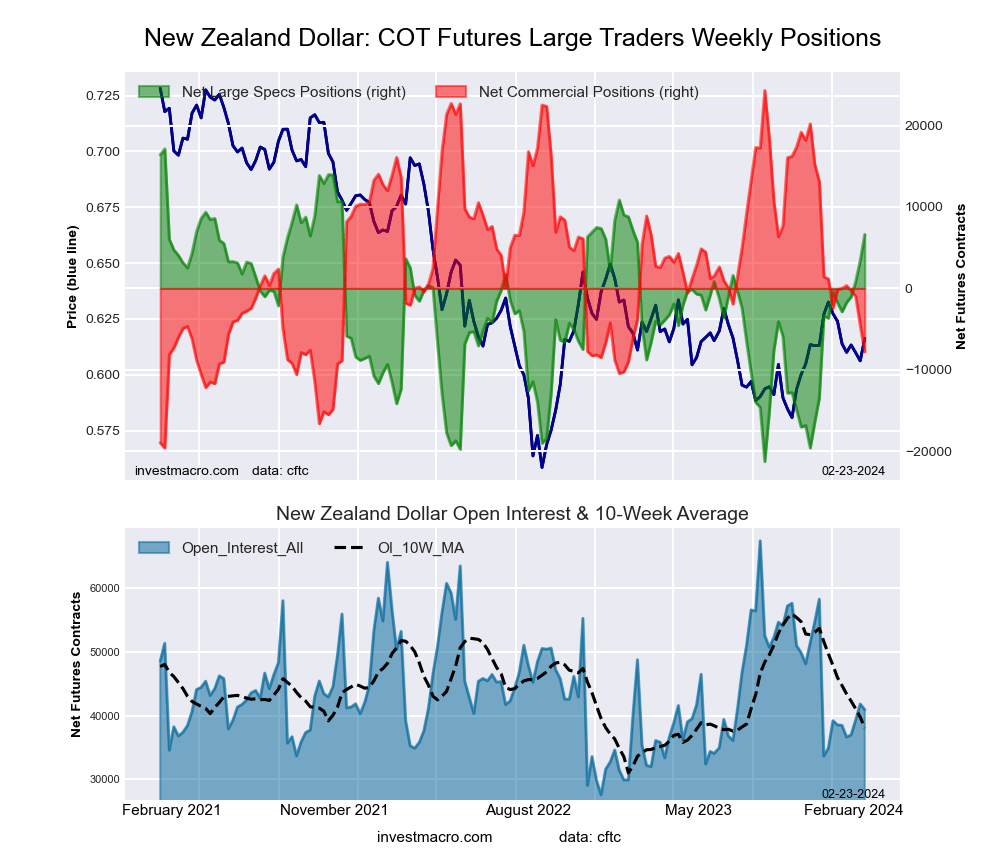
Speculators push New Zealand Dollar bets to highest in just about a year
Highlighting the COT currency’s data this week is the recent increase in the speculator’s positioning for the New Zealand Dollar. The large speculative New Zealand Dollar (NZD) currency positions gained this week by over +3,000 net contracts and have now climbed for six consecutive weeks. The NZD bets have also risen in nine out of the past twelve weeks, going from a total net position of -16,450 contracts on December 5th to a total of +6,626 contracts this week.
This improvement has taken the NZD to it’s most bullish level in the past fifty-one weeks, dating back to February 28th of 2023.
Helping the NZD speculator sentiment is the possibility that the Reserve Bank of New Zealand (RBNZ) may increase the bank’s interest rate at the next policy meeting. The RBNZ is on schedule to hold its next meeting on February 27th with the official cash rate residing at 5.5 percent. Investment services such as ANZ Bank and TD Bank are anticipating the RBNZ to increase the cash rate by 25 basis points because of high inflation. The New Zealand consumer price index (most recently at 4.7 percent for December) continues to be higher than the bank’s target range of between 1-3 percent annually. However, weak economic growth that unexpectedly contracted by -0.60 percent (annual) in the third quarter of 2023 may help to persuade the RBNZ to hold the rate steady.
The NZD exchange rate versus the US Dollar has been on the rise recently with a weekly close just below 0.6200 level. The NZDUSD hit a multi-year low of 0.5558 in October of 2022 and more recently hit a low of 0.5809 in October of 2023. Since then, the currency pair has been able to rise and break through the 0.6000 major resistance and bounce off the 200-day moving average. The currency has ridden an eight-day win-streak to rise into this week’s close near 0.6200.
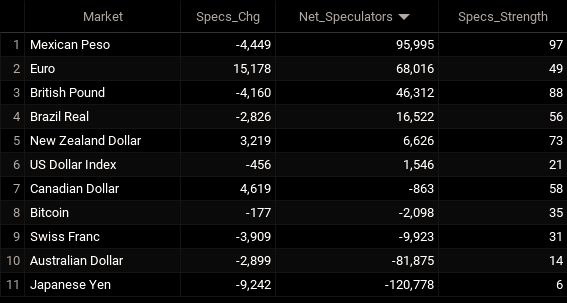
Currencies Net Speculators Leaderboard
Legend: Weekly Speculators Change | Speculators Current Net Position | Speculators Strength Score compared to last 3-Years (0-100 range)
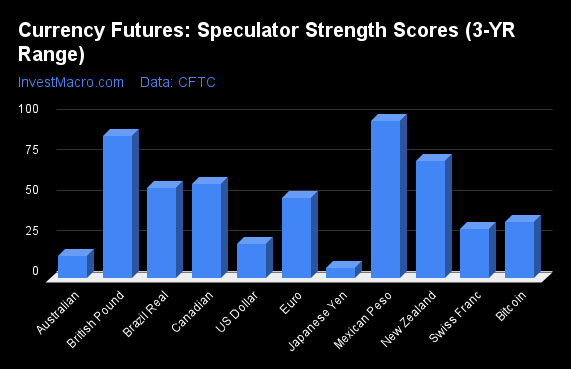
Strength Scores led by Mexican Peso & British Pound
COT Strength Scores (a normalized measure of Speculator positions over a 3-Year range, from 0 to 100 where above 80 is Extreme-Bullish and below 20 is Extreme-Bearish) showed that the Mexican Peso (97 percent) and the British Pound (88 percent) lead the currency markets this week. The New Zealand Dollar (73 percent), Canadian Dollar (58 percent) and the Brazilian Real (56 percent) come in as the next highest in the weekly strength scores.
On the downside, the Japanese Yen (6 percent) and the Australian Dollar (14 percent) come in at the lowest strength levels currently and are in Extreme-Bearish territory (below 20 percent). The next lowest strength scores are the US Dollar Index (21 percent) and the Swiss Franc (31 percent).
Strength Statistics: US Dollar Index (21.1 percent) vs US Dollar Index previous week (22.0 percent) EuroFX (49.3 percent) vs EuroFX previous week (42.8 percent) British Pound Sterling (87.9 percent) vs British Pound Sterling previous week (90.8 percent) Japanese Yen (6.3 percent) vs Japanese Yen previous week (12.5 percent) Swiss Franc (30.6 percent) vs Swiss Franc previous week (41.8 percent) Canadian Dollar (58.4 percent) vs Canadian Dollar previous week (54.5 percent) Australian Dollar (13.8 percent) vs Australian Dollar previous week (16.5 percent) New Zealand Dollar (72.7 percent) vs New Zealand Dollar previous week (64.3 percent) Mexican Peso (97.3 percent) vs Mexican Peso previous week (100.0 percent) Brazilian Real (55.9 percent) vs Brazilian Real previous week (59.6 percent) Bitcoin (34.8 percent) vs Bitcoin previous week (37.5 percent)
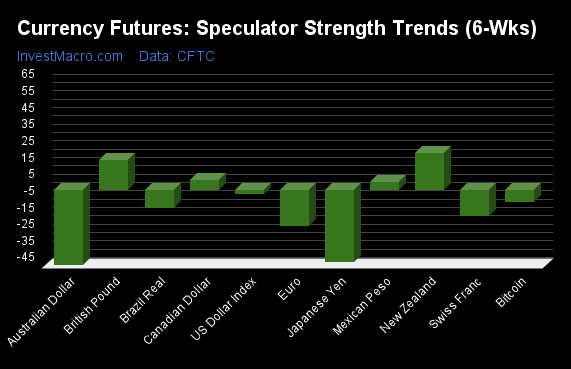
New Zealand Dollar & British Pound top the 6-Week Strength Trends
COT Strength Score Trends (or move index, calculates the 6-week changes in strength scores) showed that the New Zealand Dollar (22 percent) and the British Pound (18 percent) lead the past six weeks trends for the currencies. The Canadian Dollar (5 percent) and the Mexican Peso (5 percent) are the next highest positive movers in the latest trends data.
The Australian Dollar (-45 percent) leads the downside trend scores currently with the Japanese Yen (-43 percent), the EuroFX (-22 percent) and the Swiss Franc (-16 percent) following next with lower trend scores.
Strength Trend Statistics: US Dollar Index (-2.5 percent) vs US Dollar Index previous week (-0.8 percent) EuroFX (-21.7 percent) vs EuroFX previous week (-28.4 percent) British Pound Sterling (17.8 percent) vs British Pound Sterling previous week (24.5 percent) Japanese Yen (-43.4 percent) vs Japanese Yen previous week (-36.3 percent) Swiss Franc (-15.8 percent) vs Swiss Franc previous week (-2.3 percent) Canadian Dollar (5.5 percent) vs Canadian Dollar previous week (13.1 percent) Australian Dollar (-45.4 percent) vs Australian Dollar previous week (-33.0 percent) New Zealand Dollar (21.9 percent) vs New Zealand Dollar previous week (10.3 percent) Mexican Peso (4.6 percent) vs Mexican Peso previous week (6.9 percent) Brazilian Real (-11.1 percent) vs Brazilian Real previous week (-19.4 percent) Bitcoin (-7.2 percent) vs Bitcoin previous week (4.5 percent)
Individual COT Forex Markets:
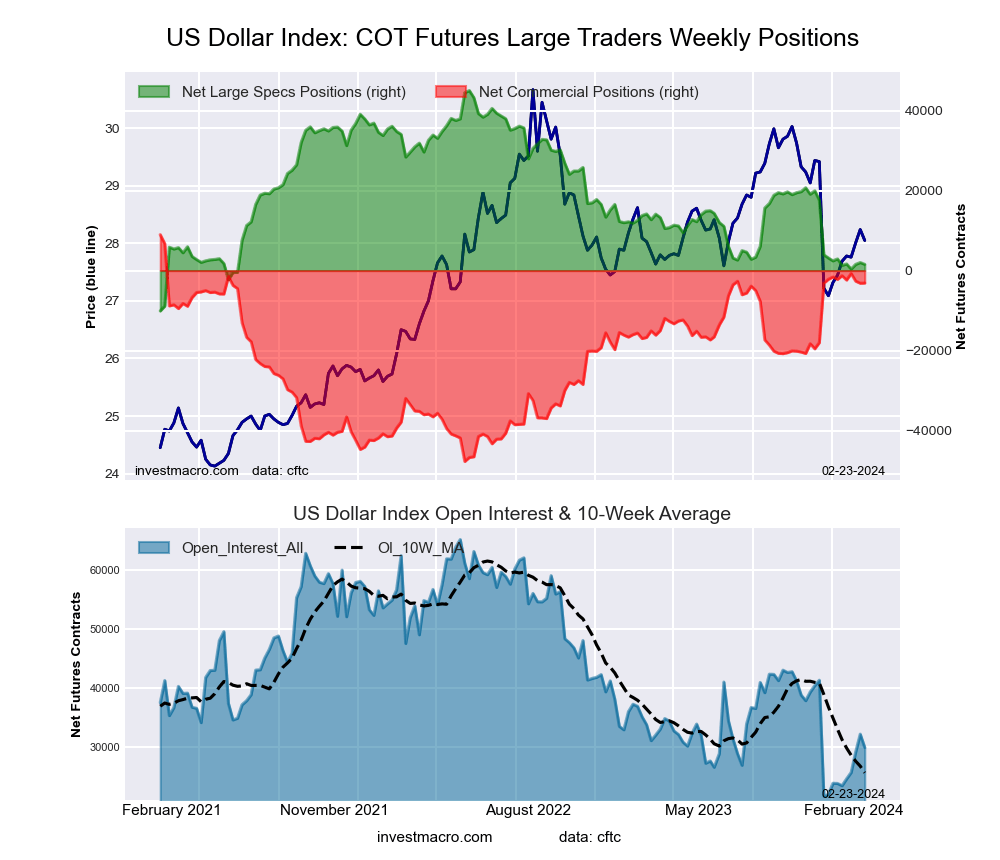
US Dollar Index Futures:
The US Dollar Index large speculator standing this week totaled a net position of 1,546 contracts in the data reported through Tuesday. This was a weekly decrease of -456 contracts from the previous week which had a total of 2,002 net contracts.
This week’s current strength score (the trader positioning range over the past three years, measured from 0 to 100) shows the speculators are currently Bearish with a score of 21.1 percent. The commercials are Bullish with a score of 78.6 percent and the small traders (not shown in chart) are Bearish with a score of 29.6 percent.
Price Trend-Following Model: Downtrend
Our weekly trend-following model classifies the current market price position as: Downtrend. The current action for the model is considered to be: Hold – Maintain Short Position.
US DOLLAR INDEX Statistics
SPECULATORS
COMMERCIALS
SMALL TRADERS
– Percent of Open Interest Longs:
62.5
18.8
13.1
– Percent of Open Interest Shorts:
57.4
29.2
7.8
– Net Position:
1,546
-3,126
1,580
– Gross Longs:
18,732
5,625
3,916
– Gross Shorts:
17,186
8,751
2,336
– Long to Short Ratio:
1.1 to 1
0.6 to 1
1.7 to 1
NET POSITION TREND:
– Strength Index Score (3 Year Range Pct):
21.1
78.6
29.6
– Strength Index Reading (3 Year Range):
Bearish
Bullish
Bearish
NET POSITION MOVEMENT INDEX:
– 6-Week Change in Strength Index:
-2.5
-1.6
26.5
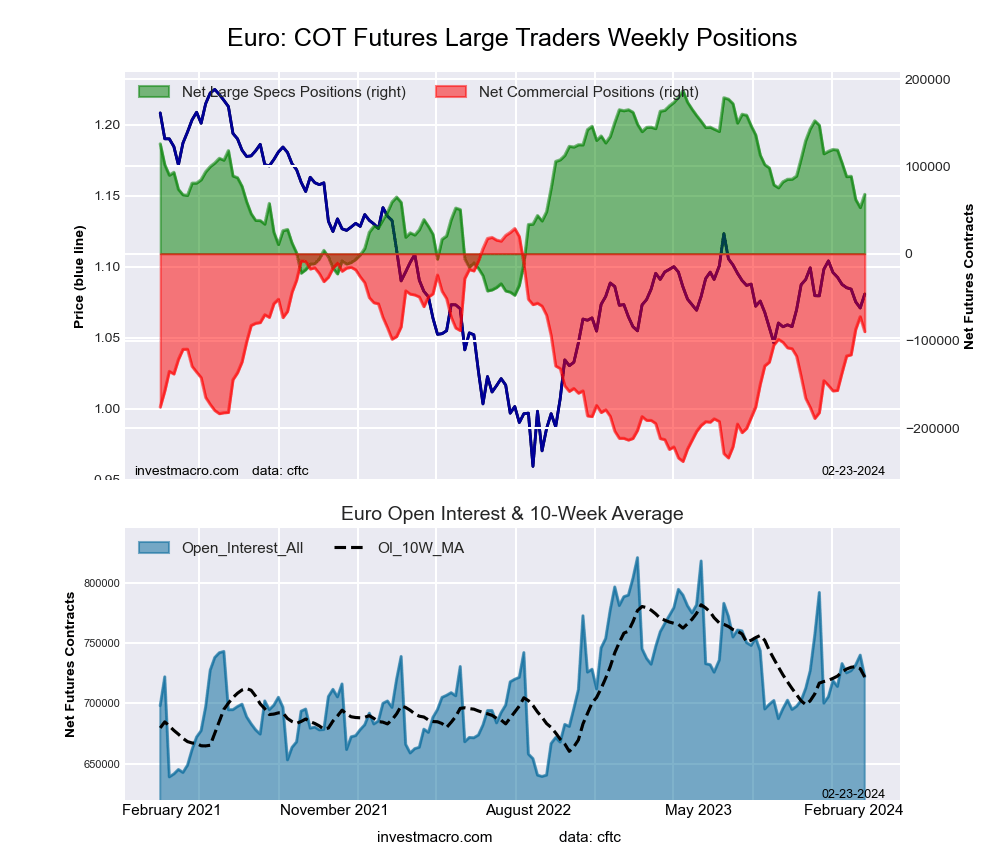
Euro Currency Futures:
The Euro Currency large speculator standing this week totaled a net position of 68,016 contracts in the data reported through Tuesday. This was a weekly rise of 15,178 contracts from the previous week which had a total of 52,838 net contracts.
This week’s current strength score (the trader positioning range over the past three years, measured from 0 to 100) shows the speculators are currently Bearish with a score of 49.3 percent. The commercials are Bullish with a score of 55.7 percent and the small traders (not shown in chart) are Bearish-Extreme with a score of 13.2 percent.
Price Trend-Following Model: Uptrend
Our weekly trend-following model classifies the current market price position as: Uptrend. The current action for the model is considered to be: Hold – Maintain Long Position.
EURO Currency Statistics
SPECULATORS
COMMERCIALS
SMALL TRADERS
– Percent of Open Interest Longs:
29.5
57.6
10.8
– Percent of Open Interest Shorts:
20.1
70.0
7.8
– Net Position:
68,016
-89,451
21,435
– Gross Longs:
213,194
416,183
77,957
– Gross Shorts:
145,178
505,634
56,522
– Long to Short Ratio:
1.5 to 1
0.8 to 1
1.4 to 1
NET POSITION TREND:
– Strength Index Score (3 Year Range Pct):
49.3
55.7
13.2
– Strength Index Reading (3 Year Range):
Bearish
Bullish
Bearish-Extreme
NET POSITION MOVEMENT INDEX:
– 6-Week Change in Strength Index:
-21.7
25.2
-26.4
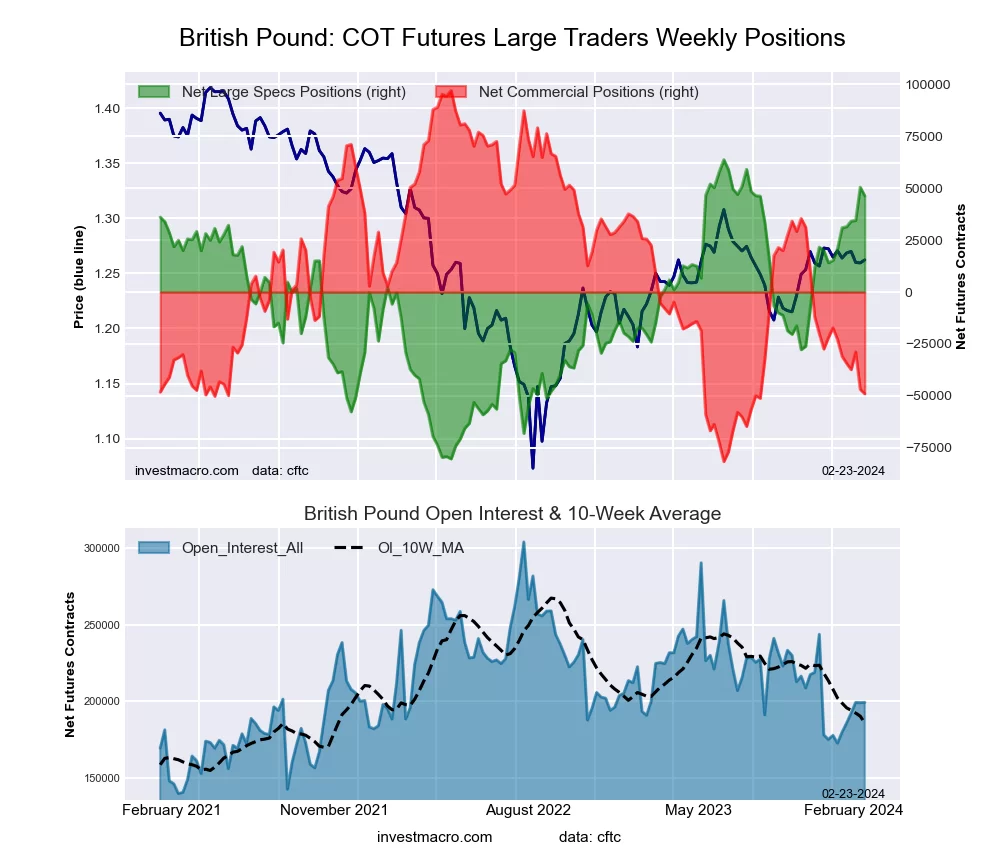
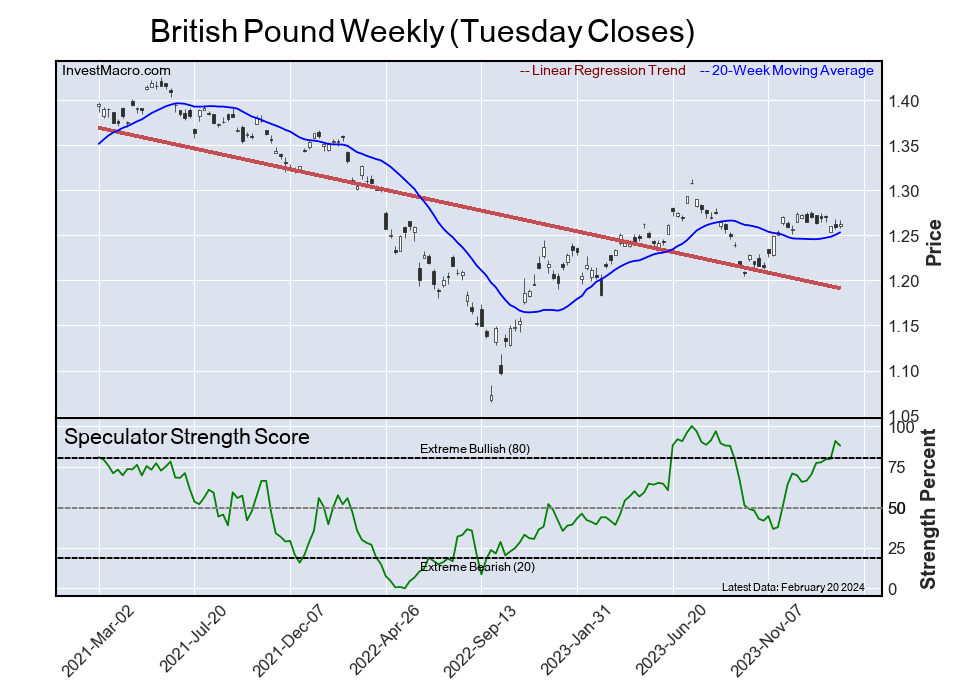
British Pound Sterling Futures:
The British Pound Sterling large speculator standing this week totaled a net position of 46,312 contracts in the data reported through Tuesday. This was a weekly reduction of -4,160 contracts from the previous week which had a total of 50,472 net contracts.
This week’s current strength score (the trader positioning range over the past three years, measured from 0 to 100) shows the speculators are currently Bullish-Extreme with a score of 87.9 percent. The commercials are Bearish-Extreme with a score of 18.2 percent and the small traders (not shown in chart) are Bullish with a score of 63.3 percent.
Price Trend-Following Model: Uptrend
Our weekly trend-following model classifies the current market price position as: Uptrend. The current action for the model is considered to be: Hold – Maintain Long Position.
BRITISH POUND Statistics
SPECULATORS
COMMERCIALS
SMALL TRADERS
– Percent of Open Interest Longs:
44.0
36.6
15.1
– Percent of Open Interest Shorts:
20.7
61.2
13.7
– Net Position:
46,312
-49,006
2,694
– Gross Longs:
87,602
72,901
30,014
– Gross Shorts:
41,290
121,907
27,320
– Long to Short Ratio:
2.1 to 1
0.6 to 1
1.1 to 1
NET POSITION TREND:
– Strength Index Score (3 Year Range Pct):
87.9
18.2
63.3
– Strength Index Reading (3 Year Range):
Bullish-Extreme
Bearish-Extreme
Bullish
NET POSITION MOVEMENT INDEX:
– 6-Week Change in Strength Index:
17.8
-14.6
1.1
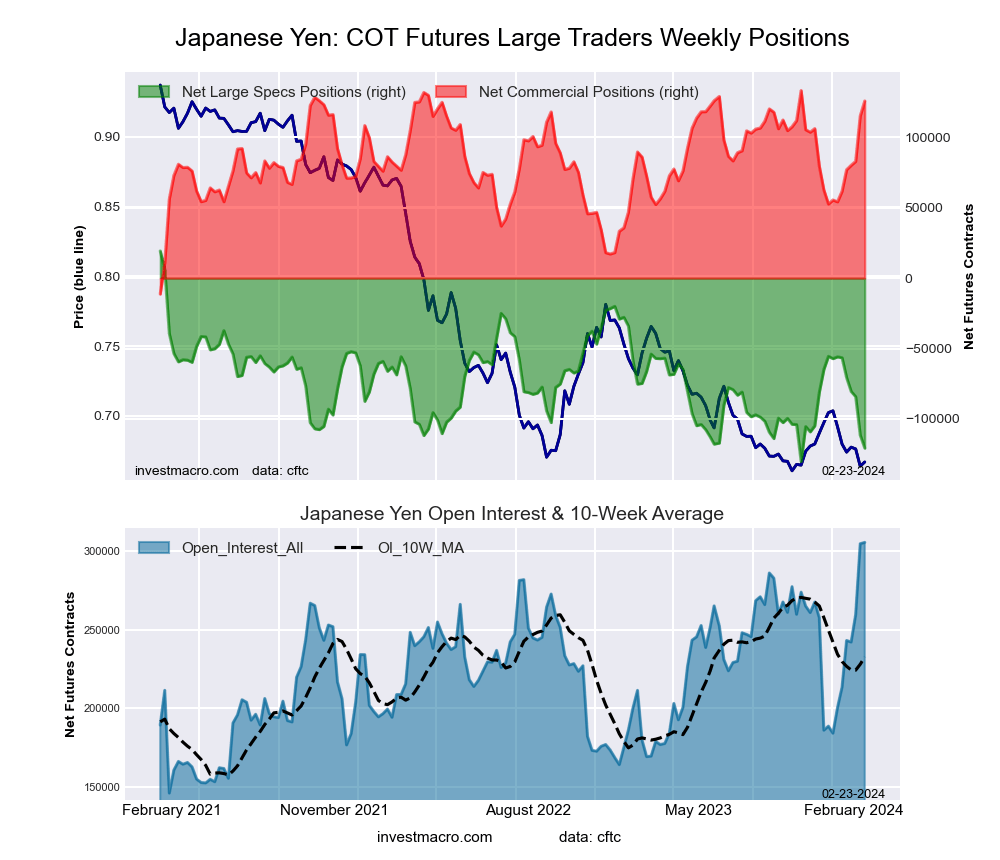
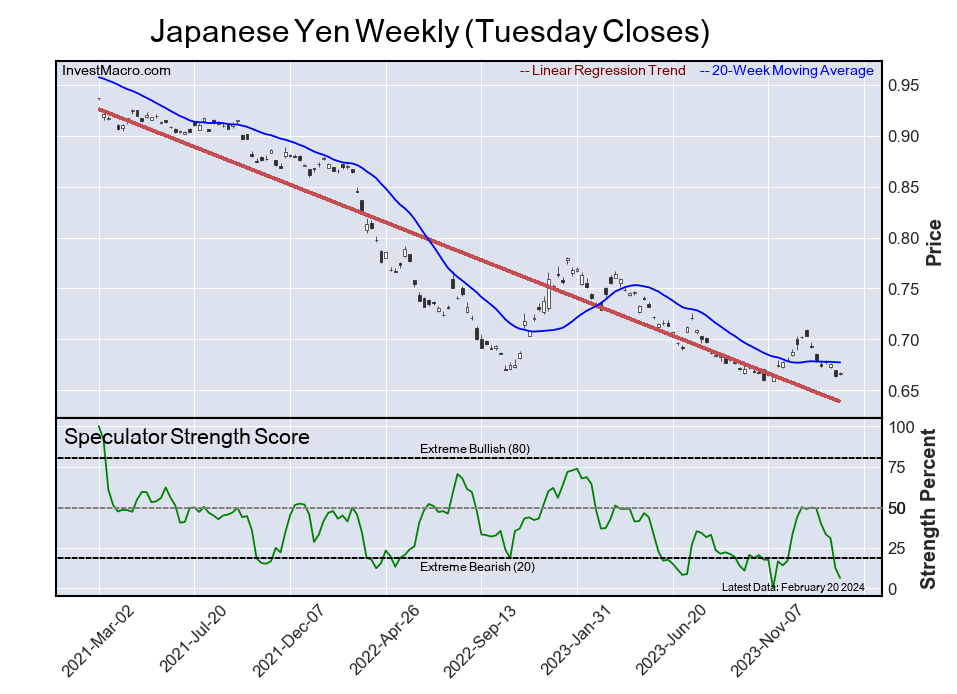
Japanese Yen Futures:
The Japanese Yen large speculator standing this week totaled a net position of -120,778 contracts in the data reported through Tuesday. This was a weekly decrease of -9,242 contracts from the previous week which had a total of -111,536 net contracts.
This week’s current strength score (the trader positioning range over the past three years, measured from 0 to 100) shows the speculators are currently Bearish-Extreme with a score of 6.3 percent. The commercials are Bullish-Extreme with a score of 94.9 percent and the small traders (not shown in chart) are Bullish with a score of 66.7 percent.
Price Trend-Following Model: Weak Uptrend
Our weekly trend-following model classifies the current market price position as: Weak Uptrend. The current action for the model is considered to be: Hold – Maintain Long Position.
JAPANESE YEN Statistics
SPECULATORS
COMMERCIALS
SMALL TRADERS
– Percent of Open Interest Longs:
17.6
65.2
13.6
– Percent of Open Interest Shorts:
57.2
24.0
15.3
– Net Position:
-120,778
125,854
-5,076
– Gross Longs:
53,862
199,061
41,618
– Gross Shorts:
174,640
73,207
46,694
– Long to Short Ratio:
0.3 to 1
2.7 to 1
0.9 to 1
NET POSITION TREND:
– Strength Index Score (3 Year Range Pct):
6.3
94.9
66.7
– Strength Index Reading (3 Year Range):
Bearish-Extreme
Bullish-Extreme
Bullish
NET POSITION MOVEMENT INDEX:
– 6-Week Change in Strength Index:
-43.4
49.6
-21.5
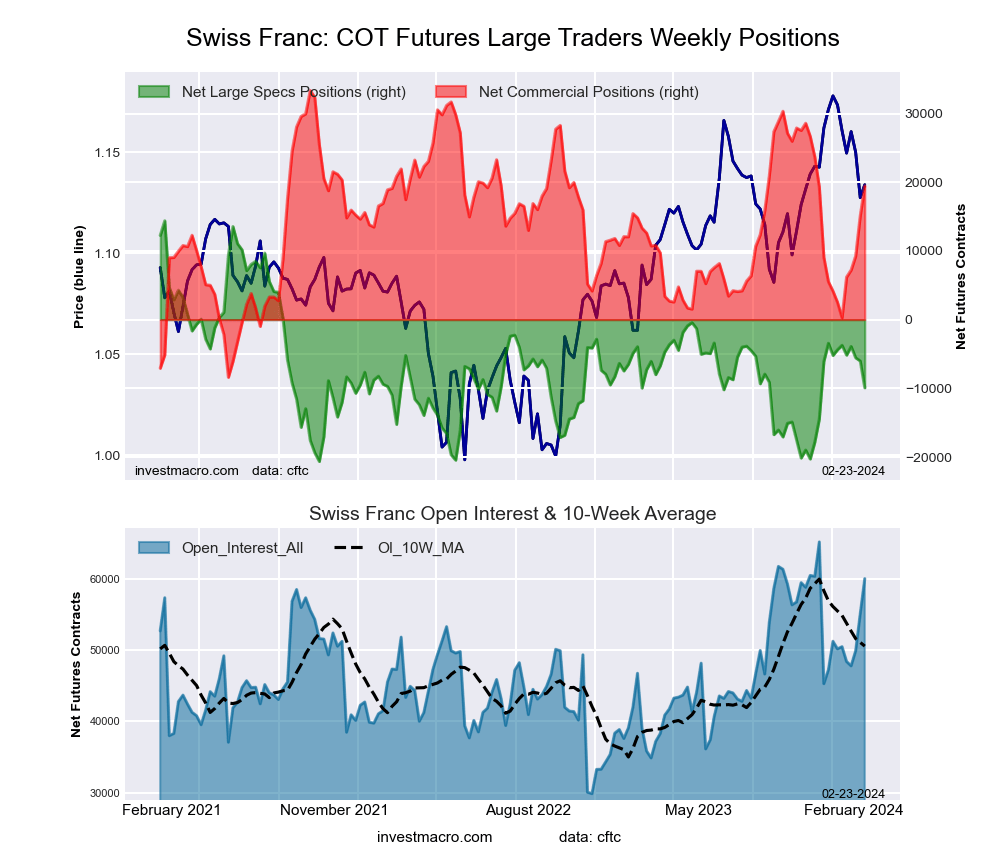
Swiss Franc Futures:
The Swiss Franc large speculator standing this week totaled a net position of -9,923 contracts in the data reported through Tuesday. This was a weekly reduction of -3,909 contracts from the previous week which had a total of -6,014 net contracts.
This week’s current strength score (the trader positioning range over the past three years, measured from 0 to 100) shows the speculators are currently Bearish with a score of 30.6 percent. The commercials are Bullish with a score of 66.8 percent and the small traders (not shown in chart) are Bearish with a score of 33.8 percent.
Price Trend-Following Model: Weak Uptrend
Our weekly trend-following model classifies the current market price position as: Weak Uptrend. The current action for the model is considered to be: Hold – Maintain Long Position.
SWISS FRANC Statistics
SPECULATORS
COMMERCIALS
SMALL TRADERS
– Percent of Open Interest Longs:
21.7
62.4
15.7
– Percent of Open Interest Shorts:
38.2
29.9
31.6
– Net Position:
-9,923
19,476
-9,553
– Gross Longs:
13,036
37,455
9,413
– Gross Shorts:
22,959
17,979
18,966
– Long to Short Ratio:
0.6 to 1
2.1 to 1
0.5 to 1
NET POSITION TREND:
– Strength Index Score (3 Year Range Pct):
30.6
66.8
33.8
– Strength Index Reading (3 Year Range):
Bearish
Bullish
Bearish
NET POSITION MOVEMENT INDEX:
– 6-Week Change in Strength Index:
-15.8
40.6
-51.9
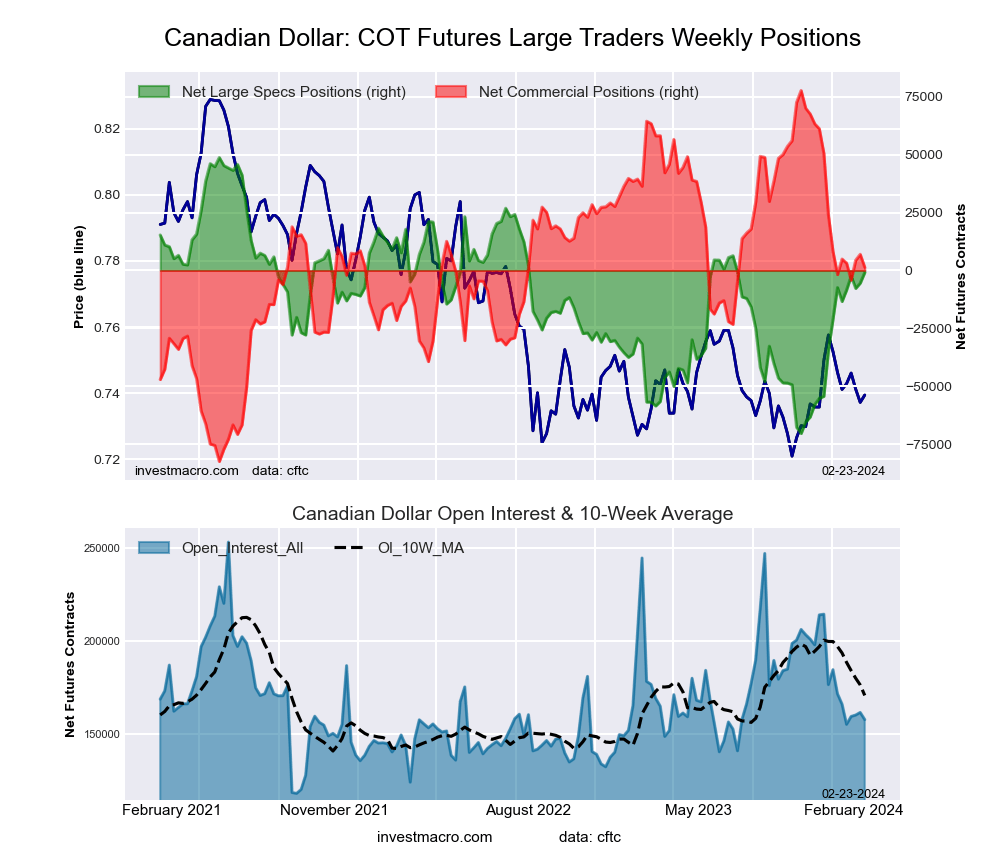
Canadian Dollar Futures:
The Canadian Dollar large speculator standing this week totaled a net position of -863 contracts in the data reported through Tuesday. This was a weekly boost of 4,619 contracts from the previous week which had a total of -5,482 net contracts.
This week’s current strength score (the trader positioning range over the past three years, measured from 0 to 100) shows the speculators are currently Bullish with a score of 58.4 percent. The commercials are Bullish with a score of 52.3 percent and the small traders (not shown in chart) are Bearish with a score of 21.7 percent.
Price Trend-Following Model: Uptrend
Our weekly trend-following model classifies the current market price position as: Uptrend. The current action for the model is considered to be: Hold – Maintain Long Position.
CANADIAN DOLLAR Statistics
SPECULATORS
COMMERCIALS
SMALL TRADERS
– Percent of Open Interest Longs:
23.5
55.9
18.5
– Percent of Open Interest Shorts:
24.1
55.1
18.8
– Net Position:
-863
1,345
-482
– Gross Longs:
37,108
88,205
29,192
– Gross Shorts:
37,971
86,860
29,674
– Long to Short Ratio:
1.0 to 1
1.0 to 1
1.0 to 1
NET POSITION TREND:
– Strength Index Score (3 Year Range Pct):
58.4
52.3
21.7
– Strength Index Reading (3 Year Range):
Bullish
Bullish
Bearish
NET POSITION MOVEMENT INDEX:
– 6-Week Change in Strength Index:
5.5
2.0
-21.4
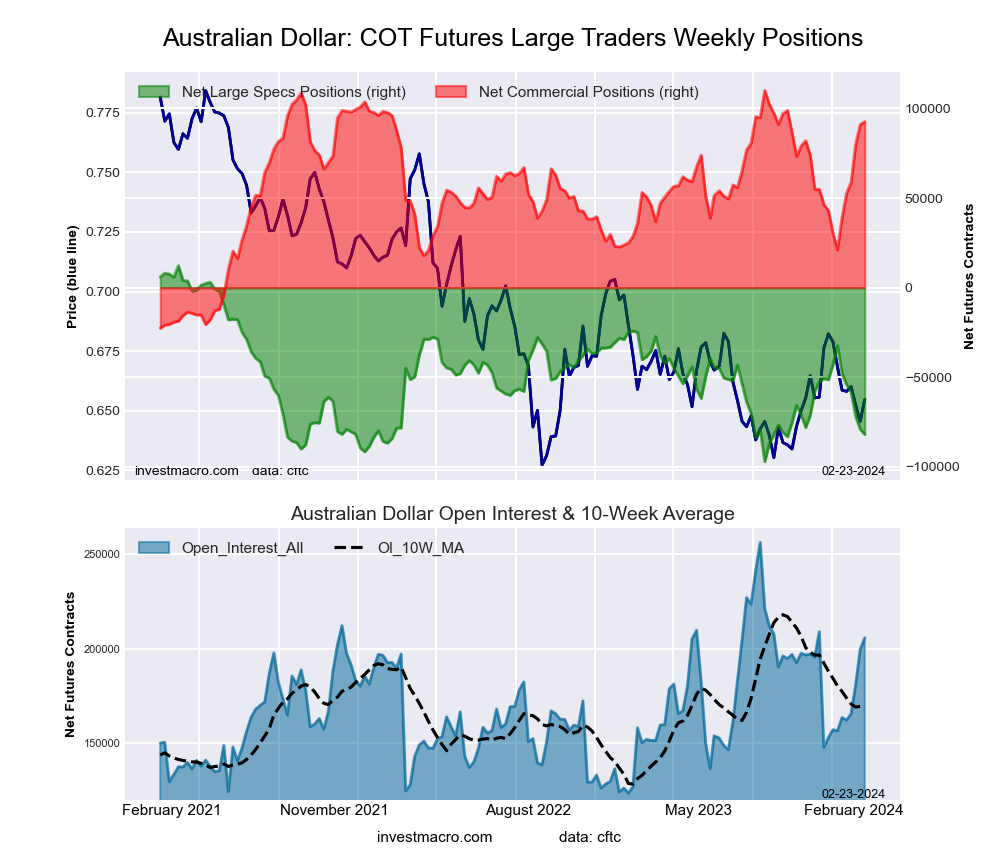
Australian Dollar Futures:
The Australian Dollar large speculator standing this week totaled a net position of -81,875 contracts in the data reported through Tuesday. This was a weekly fall of -2,899 contracts from the previous week which had a total of -78,976 net contracts.
This week’s current strength score (the trader positioning range over the past three years, measured from 0 to 100) shows the speculators are currently Bearish-Extreme with a score of 13.8 percent. The commercials are Bullish-Extreme with a score of 86.9 percent and the small traders (not shown in chart) are Bearish with a score of 27.2 percent.
Price Trend-Following Model: Uptrend
Our weekly trend-following model classifies the current market price position as: Uptrend. The current action for the model is considered to be: Hold – Maintain Long Position.
AUSTRALIAN DOLLAR Statistics
SPECULATORS
COMMERCIALS
SMALL TRADERS
– Percent of Open Interest Longs:
23.9
64.0
9.4
– Percent of Open Interest Shorts:
63.7
19.0
14.6
– Net Position:
-81,875
92,611
-10,736
– Gross Longs:
49,100
131,694
19,375
– Gross Shorts:
130,975
39,083
30,111
– Long to Short Ratio:
0.4 to 1
3.4 to 1
0.6 to 1
NET POSITION TREND:
– Strength Index Score (3 Year Range Pct):
13.8
86.9
27.2
– Strength Index Reading (3 Year Range):
Bearish-Extreme
Bullish-Extreme
Bearish
NET POSITION MOVEMENT INDEX:
– 6-Week Change in Strength Index:
-45.4
53.9
-55.3
New Zealand Dollar Futures:
The New Zealand Dollar large speculator standing this week totaled a net position of 6,626 contracts in the data reported through Tuesday. This was a weekly rise of 3,219 contracts from the previous week which had a total of 3,407 net contracts.
This week’s current strength score (the trader positioning range over the past three years, measured from 0 to 100) shows the speculators are currently Bullish with a score of 72.7 percent. The commercials are Bearish with a score of 26.9 percent and the small traders (not shown in chart) are Bullish with a score of 69.3 percent.
Price Trend-Following Model: Uptrend
Our weekly trend-following model classifies the current market price position as: Uptrend. The current action for the model is considered to be: Hold – Maintain Long Position.
NEW ZEALAND DOLLAR Statistics
SPECULATORS
COMMERCIALS
SMALL TRADERS
– Percent of Open Interest Longs:
48.2
35.0
11.2
– Percent of Open Interest Shorts:
32.1
54.1
8.3
– Net Position:
6,626
-7,799
1,173
– Gross Longs:
19,758
14,341
4,580
– Gross Shorts:
13,132
22,140
3,407
– Long to Short Ratio:
1.5 to 1
0.6 to 1
1.3 to 1
NET POSITION TREND:
– Strength Index Score (3 Year Range Pct):
72.7
26.9
69.3
– Strength Index Reading (3 Year Range):
Bullish
Bearish
Bullish
NET POSITION MOVEMENT INDEX:
– 6-Week Change in Strength Index:
21.9
-17.3
-10.3
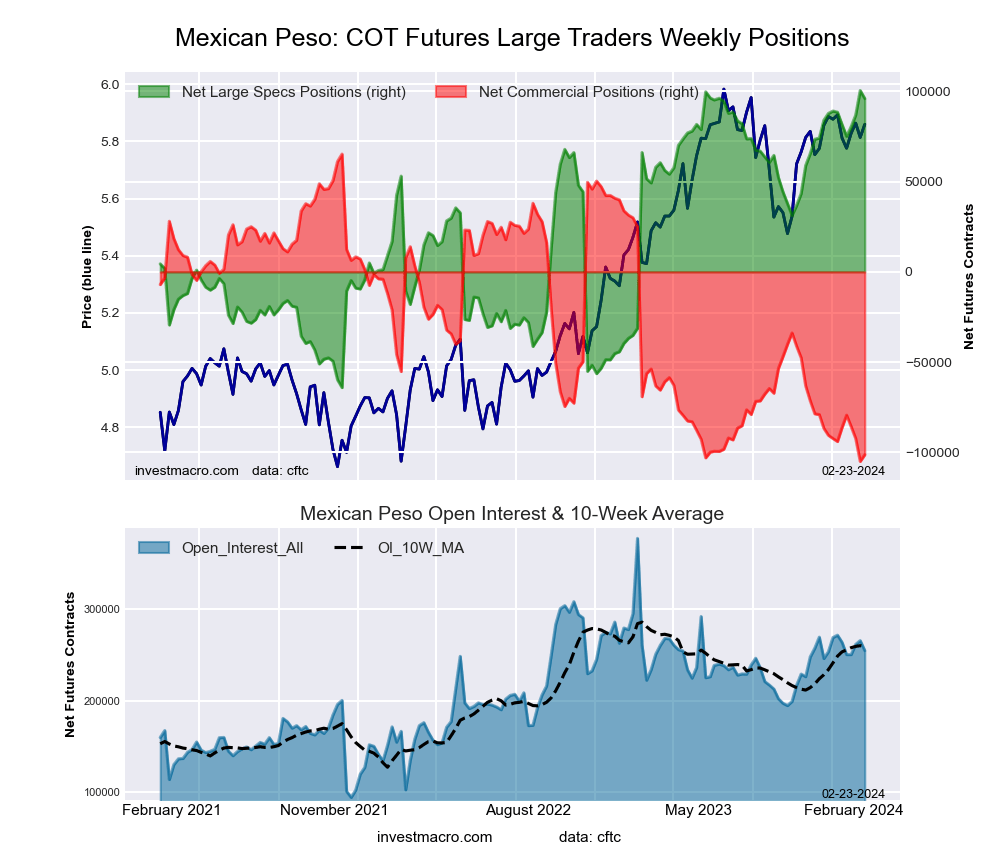
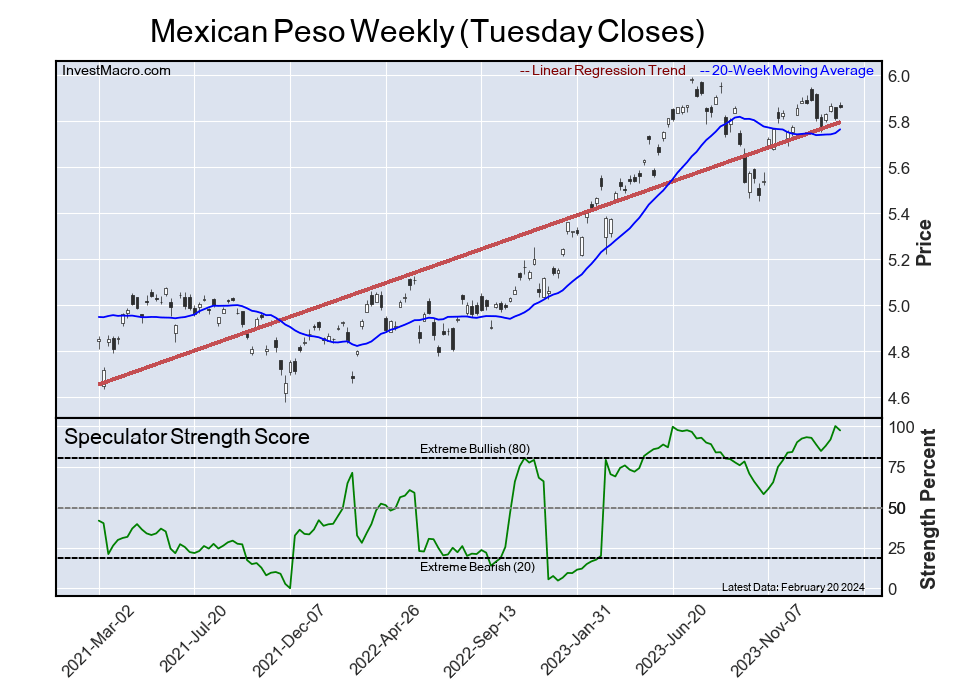
Mexican Peso Futures:
The Mexican Peso large speculator standing this week totaled a net position of 95,995 contracts in the data reported through Tuesday. This was a weekly decline of -4,449 contracts from the previous week which had a total of 100,444 net contracts.
This week’s current strength score (the trader positioning range over the past three years, measured from 0 to 100) shows the speculators are currently Bullish-Extreme with a score of 97.3 percent. The commercials are Bearish-Extreme with a score of 2.2 percent and the small traders (not shown in chart) are Bearish with a score of 45.2 percent.
Price Trend-Following Model: Uptrend
Our weekly trend-following model classifies the current market price position as: Uptrend. The current action for the model is considered to be: Hold – Maintain Long Position.
MEXICAN PESO Statistics
SPECULATORS
COMMERCIALS
SMALL TRADERS
– Percent of Open Interest Longs:
55.6
40.1
3.2
– Percent of Open Interest Shorts:
17.9
79.9
1.1
– Net Position:
95,995
-101,330
5,335
– Gross Longs:
141,528
102,096
8,061
– Gross Shorts:
45,533
203,426
2,726
– Long to Short Ratio:
3.1 to 1
0.5 to 1
3.0 to 1
NET POSITION TREND:
– Strength Index Score (3 Year Range Pct):
97.3
2.2
45.2
– Strength Index Reading (3 Year Range):
Bullish-Extreme
Bearish-Extreme
Bearish
NET POSITION MOVEMENT INDEX:
– 6-Week Change in Strength Index:
4.6
-4.3
-1.5
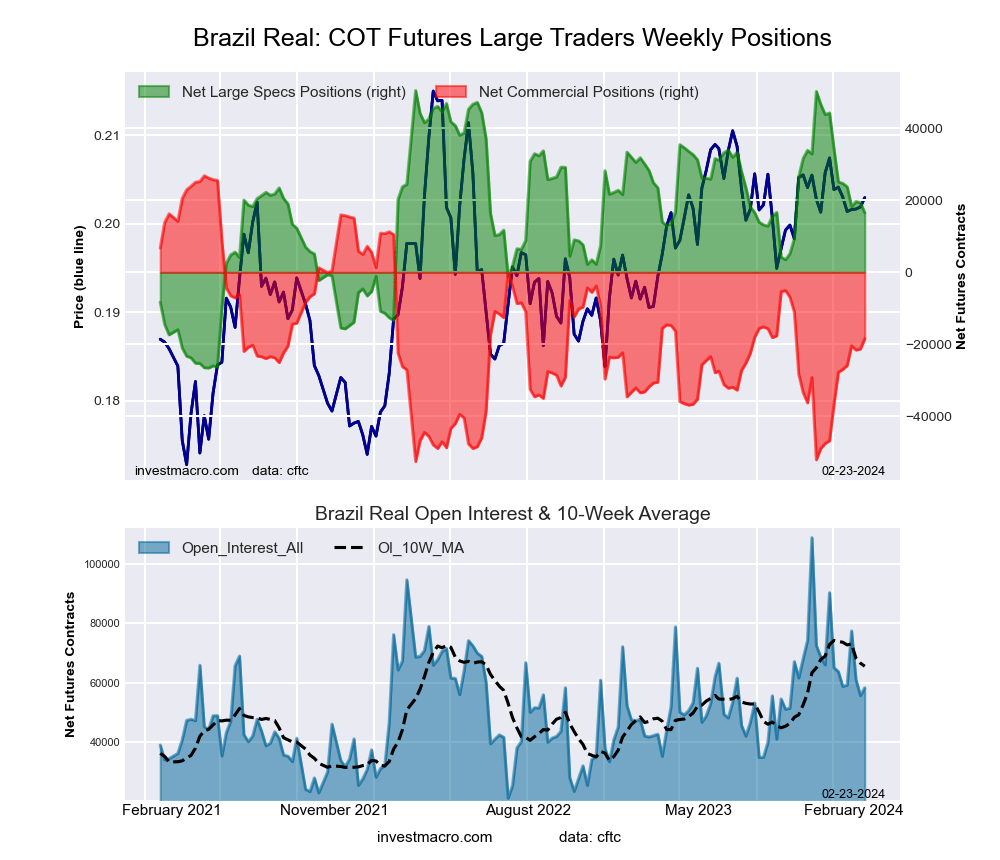
Brazilian Real Futures:
The Brazilian Real large speculator standing this week totaled a net position of 16,522 contracts in the data reported through Tuesday. This was a weekly fall of -2,826 contracts from the previous week which had a total of 19,348 net contracts.
This week’s current strength score (the trader positioning range over the past three years, measured from 0 to 100) shows the speculators are currently Bullish with a score of 55.9 percent. The commercials are Bearish with a score of 43.0 percent and the small traders (not shown in chart) are Bullish with a score of 52.4 percent.
Price Trend-Following Model: Weak Uptrend
Our weekly trend-following model classifies the current market price position as: Weak Uptrend. The current action for the model is considered to be: Hold – Maintain Long Position.
BRAZIL REAL Statistics
SPECULATORS
COMMERCIALS
SMALL TRADERS
– Percent of Open Interest Longs:
55.7
38.8
5.2
– Percent of Open Interest Shorts:
27.3
70.5
1.9
– Net Position:
16,522
-18,453
1,931
– Gross Longs:
32,457
22,619
3,031
– Gross Shorts:
15,935
41,072
1,100
– Long to Short Ratio:
2.0 to 1
0.6 to 1
2.8 to 1
NET POSITION TREND:
– Strength Index Score (3 Year Range Pct):
55.9
43.0
52.4
– Strength Index Reading (3 Year Range):
Bullish
Bearish
Bullish
NET POSITION MOVEMENT INDEX:
– 6-Week Change in Strength Index:
-11.1
11.7
-6.6
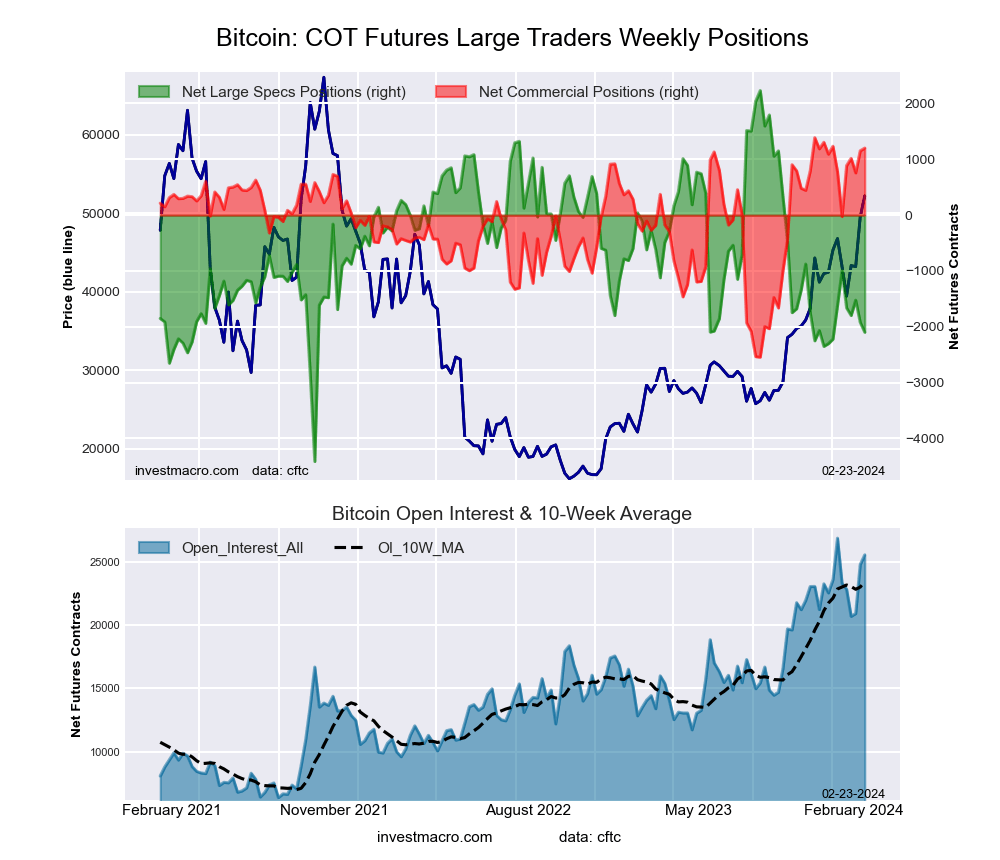
Bitcoin Futures:
The Bitcoin large speculator standing this week totaled a net position of -2,098 contracts in the data reported through Tuesday. This was a weekly decline of -177 contracts from the previous week which had a total of -1,921 net contracts.
This week’s current strength score (the trader positioning range over the past three years, measured from 0 to 100) shows the speculators are currently Bearish with a score of 34.8 percent. The commercials are Bullish-Extreme with a score of 95.3 percent and the small traders (not shown in chart) are Bearish with a score of 33.3 percent.
Price Trend-Following Model: Strong Uptrend
Our weekly trend-following model classifies the current market price position as: Strong Uptrend. The current action for the model is considered to be: Hold – Maintain Long Position.
BITCOIN Statistics
SPECULATORS
COMMERCIALS
SMALL TRADERS
– Percent of Open Interest Longs:
76.9
7.3
6.8
– Percent of Open Interest Shorts:
85.1
2.6
3.2
– Net Position:
-2,098
1,202
896
– Gross Longs:
19,624
1,862
1,724
– Gross Shorts:
21,722
660
828
– Long to Short Ratio:
0.9 to 1
2.8 to 1
2.1 to 1
NET POSITION TREND:
– Strength Index Score (3 Year Range Pct):
34.8
95.3
33.3
– Strength Index Reading (3 Year Range):
Bearish
Bullish-Extreme
Bearish
NET POSITION MOVEMENT INDEX:
– 6-Week Change in Strength Index:
-7.2
10.8
1.3
Article By InvestMacro – Receive our weekly COT Newsletter
*COT Report: The COT data, released weekly to the public each Friday, is updated through the most recent Tuesday (data is 3 days old) and shows a quick view of how large speculators or non-commercials (for-profit traders) were positioned in the futures markets.
The CFTC categorizes trader positions according to commercial hedgers (traders who use futures contracts for hedging as part of the business), non-commercials (large traders who speculate to realize trading profits) and nonreportable traders (usually small traders/speculators) as well as their open interest (contracts open in the market at time of reporting). See CFTC criteria here.
The latest update for the weekly Commitment of Traders (COT) report was released by the Commodity Futures Trading Commission (CFTC) on Friday for data ending on February 20th.
This weekly Extreme Positions report highlights the Most Bullish and Most Bearish Positions for the speculator category. Extreme positioning in these markets can foreshadow strong moves in the underlying market.
To signify an extreme position, we use the Strength Index (also known as the COT Index) of each instrument, a common method of measuring COT data. The Strength Index is simply a comparison of current trader positions against the range of positions over the previous 3 years. We use over 80 percent as extremely bullish and under 20 percent as extremely bearish. (Compare Strength Index scores across all markets in the data table or cot leaders table)
Here Are This Week’s Most Bullish Speculator Positions:
Mexican Peso
The Mexican Peso speculator position comes in as the most bullish extreme standing this week. The Mexican Peso speculator level is currently at a 97.3 percent score of its 3-year range.
The six-week trend for the percent strength score totaled 4.6 this week. The overall net speculator position was a total of 95,995 contracts this week with a decline of -4,449 contract in the weekly speculator bets.
Speculators or Non-Commercials Notes:
Speculators, classified as non-commercial traders by the CFTC, are made up of large commodity funds, hedge funds and other significant for-profit participants. The Specs are generally regarded as trend-followers in their behavior towards price action – net speculator bets and prices tend to go in the same directions. These traders often look to buy when prices are rising and sell when prices are falling. To illustrate this point, many times speculator contracts can be found at their most extremes (bullish or bearish) when prices are also close to their highest or lowest levels.
These extreme levels can be dangerous for the large speculators as the trade is most crowded, there is less trading ammunition still sitting on the sidelines to push the trend further and prices have moved a significant distance. When the trend becomes exhausted, some speculators take profits while others look to also exit positions when prices fail to continue in the same direction. This process usually plays out over many months to years and can ultimately create a reverse effect where prices start to fall and speculators start a process of selling when prices are falling.
British Pound Sterling
The British Pound speculator position comes next in the extreme standings this week. The British Pound speculator level is now at a 87.9 percent score of its 3-year range.
The six-week trend for the percent strength score was 17.8 this week. The speculator position registered 46,312 net contracts this week with a weekly fall of -4,160 contracts in speculator bets.
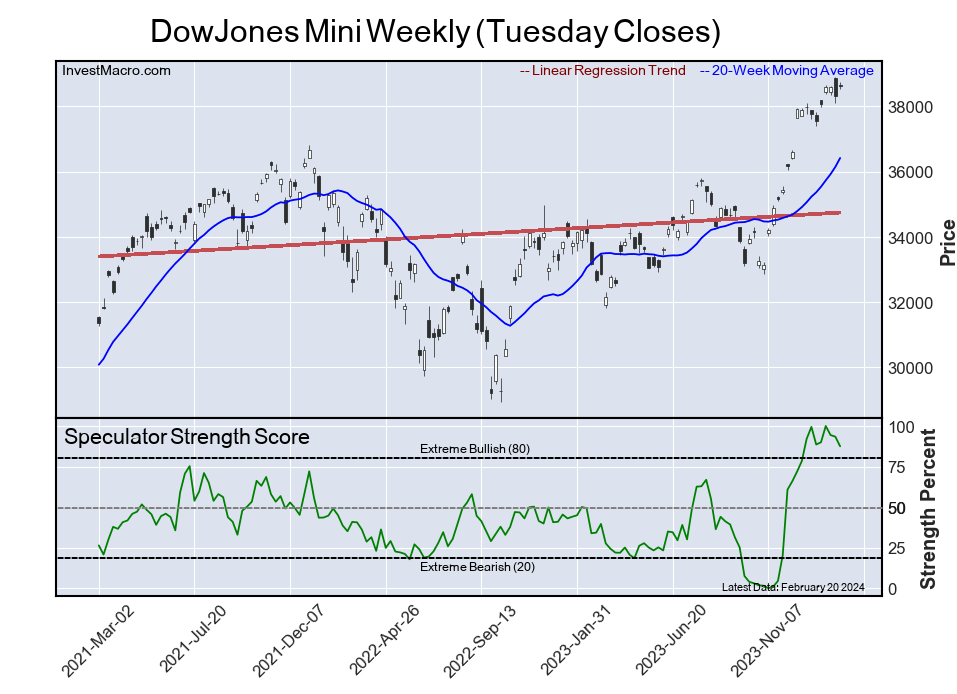
DowJones Mini
The DowJones Mini speculator position comes in third this week in the extreme standings. The DowJones Mini speculator level resides at a 87.5 percent score of its 3-year range.
The six-week trend for the speculator strength score came in at -12.0 this week. The overall speculator position was 16,728 net contracts this week with a decrease of -3,641 contracts in the weekly speculator bets.
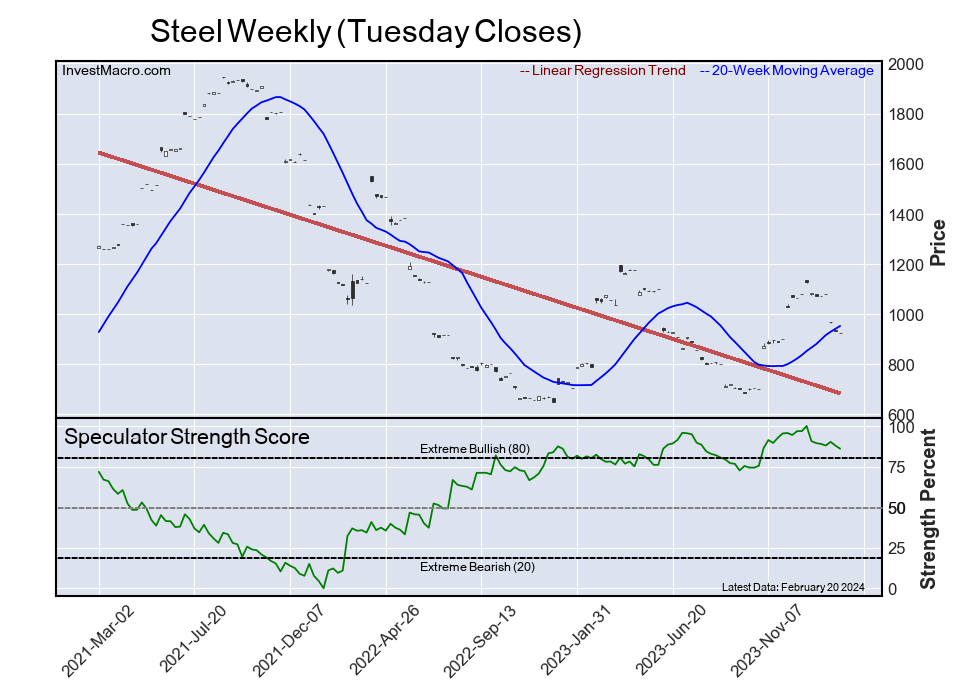
Steel
The Steel speculator position comes up number four in the extreme standings this week. The Steel speculator level is at a 86.0 percent score of its 3-year range.
The six-week trend for the speculator strength score totaled a change of -4.7 this week. The overall speculator position was -2,701 net contracts this week with a dip of -518 contracts in the speculator bets.
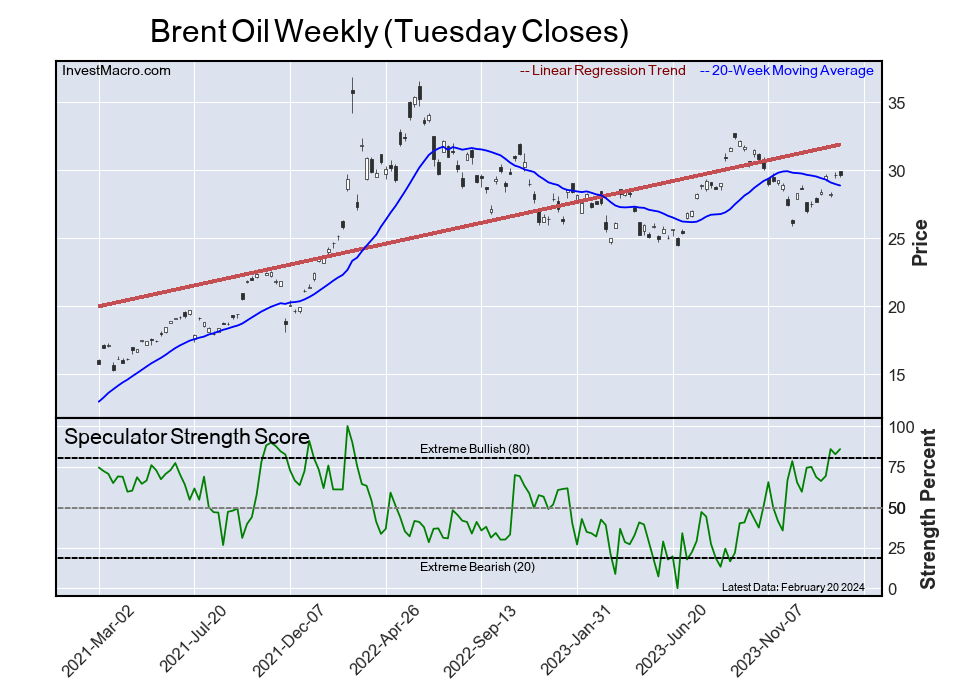
Brent Oil
The Brent Oil speculator position rounds out the top five in this week’s bullish extreme standings. The Brent Oil speculator level sits at a 85.8 percent score of its 3-year range. The six-week trend for the speculator strength score was 10.9 this week.
The speculator position was -13,856 net contracts this week with a gain of 1,589 contracts in the weekly speculator bets.
This Week’s Most Bearish Speculator Positions:
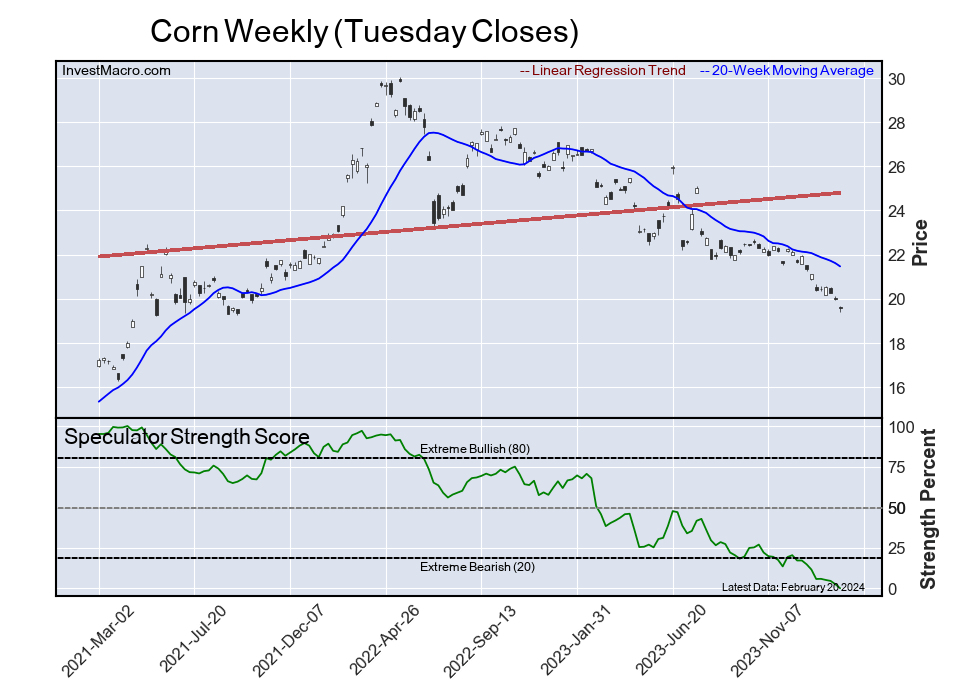
Corn
The Corn speculator position comes in as the most bearish extreme standing this week. The Corn speculator level is at a 0.0 percent score of its 3-year range.
The six-week trend for the speculator strength score was -11.5 this week. The overall speculator position was -266,067 net contracts this week with a drop of -20,128 contracts in the speculator bets.
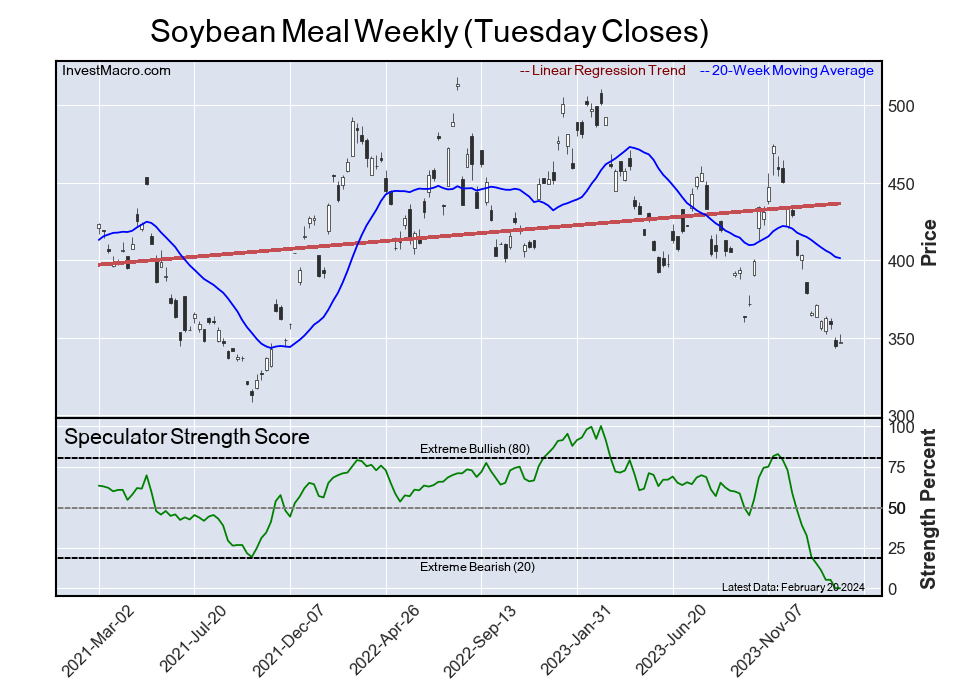
Soybean Meal
The Soybean Meal speculator position comes in next for the most bearish extreme standing on the week. The Soybean Meal speculator level is at a 0.0 percent score of its 3-year range.
The six-week trend for the speculator strength score was -19.3 this week. The speculator position was -45,453 net contracts this week with a edge higher by 14 contracts in the weekly speculator bets.
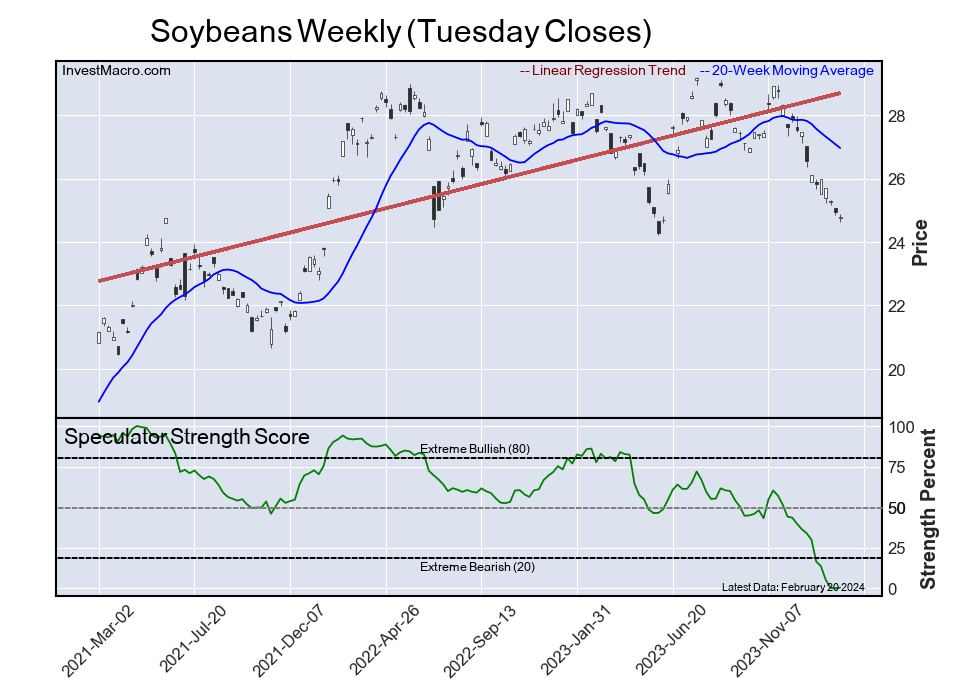
Soybeans
The Soybeans speculator position comes in as third most bearish extreme standing of the week. The Soybeans speculator level resides at a 0.4 percent score of its 3-year range.
The six-week trend for the speculator strength score was -29.6 this week. The overall speculator position was -160,288 net contracts this week with a small increase of 1,463 contracts in the speculator bets.
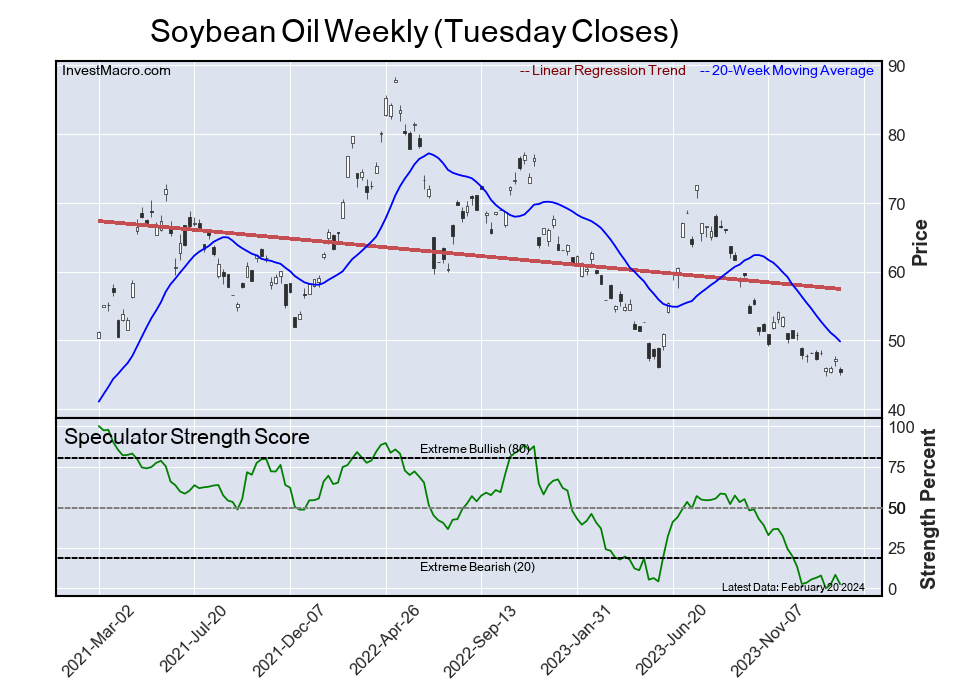
Soybean Oil
The Soybean Oil speculator position comes in as this week’s fourth most bearish extreme standing. The Soybean Oil speculator level is at a 2.5 percent score of its 3-year range.
The six-week trend for the speculator strength score was -2.9 this week. The speculator position was -33,941 net contracts this week with a drop of -9,325 contracts in the weekly speculator bets.
Japanese Yen
Finally, the Japanese Yen speculator position comes in as the fifth most bearish extreme standing for this week. The Japanese Yen speculator level is at a 6.3 percent score of its 3-year range.
The six-week trend for the speculator strength score was -43.4 this week. The speculator position was -120,778 net contracts this week with a decrease of -9,242 contracts in the weekly speculator bets.
Article By InvestMacro – Receive our weekly COT Newsletter
*COT Report: The COT data, released weekly to the public each Friday, is updated through the most recent Tuesday (data is 3 days old) and shows a quick view of how large speculators or non-commercials (for-profit traders) were positioned in the futures markets.
The CFTC categorizes trader positions according to commercial hedgers (traders who use futures contracts for hedging as part of the business), non-commercials (large traders who speculate to realize trading profits) and nonreportable traders (usually small traders/speculators) as well as their open interest (contracts open in the market at time of reporting). See CFTC criteria here.
Our focus lands on the Japanese Yen which has been the worst-performing G10 currency against the US Dollar year-to-date.
The final trading week of February promises to be eventful due to key economic data, speeches by numerous Fed officials, and threat of a partial US government shutdown:
USD: US ISM manufacturing, University of Michigan consumer sentiment, Fed speeches
Deadline for avoiding partial US government shutdown
Yen weakness has been a major theme this quarter thanks to a dovish BoJ, with the recession in Japan fuelling uncertainty about likely timings for a policy pivot.
Note: Yen down more than 6% versus the USD year-to-date.
The Yen’s recent depreciation below 150 per dollar has sparked warnings from Japanese officials, ultimately fuelling market fears of possible intervention.
With the USDJPY venturing closer to multi-year highs just below 152, a major move could be brewing.
With all the above said, here are 3 factors that could influence the USDJPY:
Japan inflation data
Japan’s national consumer price index (CPI) is forecast to slow to 1.9% year on year in January from the 2.6% in January. The core measure which excludes fresh food is expected to cool 1.9% year on year, down from 2.3% in December.
Should expectations match reality, this will be the first time the core CPI has dipped below the BoJ’s 2% target since March 2022.
Traders are currently pricing in only a 29% probability that the BoJ will scrap negative rates by March, with the odds jumping to 78% by April.
A softer than expected inflation report may support the argument around the economy being too weak for rate hikes, weakening the Yen as a result.
Should the inflation report print above expectations, this could boost the Yen as expectations mount over the BoJ ending negative rates.
US January PCE report
The Fed’s preferred inflation gauge – the Core Personal Consumption Expenditure is likely to influence rate cut expectations.
Traders are currently pricing in 79% probability of Fed rate cut by June, according to Fed fund futures.
The PCE core deflator is forecast to rise 0.4% month-over-month, from 0.2% in December while cooling 2.8% in January, down from 2.9% in the previous month.
Ultimately, more signs of cooling price pressures may boost bets around the Fed cutting interest rates down the road – hitting the dollar as a result.
If the PCE report prints above market forecasts, this could further dampen hopes for early rate cuts – pushing the USDJPY higher as a result.
Note: Looking beyond the PCE report and other key US data, it may be wise to keep an eye on the looming partial government shutdown.
The United States is facing another partial government shutdown deadline set to expire on 1st March. Should this become reality, it could impact the dollar and risk sentiment – reflecting on the USDJPY.
Technical forces
The USDJPY is firmly bullish on the daily timeframe as there have been consistently higher highs and higher lows. However, the Relative Strength Index (RSI) is approaching 70 – signalling that prices are overbought.
A solid weekly close above 150.90 may encourage an incline towards the 151.90 level.
Should bulls get cold feet below 150.90, this may trigger a selloff towards 149.70 and potentially lower.
Bloomberg’s FX model points to a 78% chance that USDJPY will trade within the 149.18 – 151.95 range over the next one-week period.
“Given how Nvidia shares ended Wednesday’s session around $675, this is equivalent to a rally towards fresh all-time highs …”
What happened since TP was published?
Nvidia, the US chipmaker whose GPUs are essential to the AI industry, reported better-than-expected earnings after US markets closed on Wednesday.
This sent the stock soaring by more than 14% in Thursday’s early trading session (before US markets officially open).
How much in potential profits?
Investors stand to gain 14% overnight
That’s if they had bought this stock yesterday (Wednesday) and hold on today, assuming the gains from the pre-market session carries over into today’s (Thursday) US market open.
Nvidia is then set to register a new all-time high today (Thursday)!
The article cited the “psychologically-important round number level” of 12,000 as a potential resistance.
What happened since TP was published?
The CN50 index surged on Wednesday (day after this article was published) likely due to some market intervention in China.
After briefly breaking above that 12k mark, the psychologically-important level duly acted as a resistance level, as mentioned in the article.
How much in potential profits?
Traders who opened long positions (bet that prices will go up) on the CN50 index on Tuesday, would have watched this index climb by as much as 430 index points the next day.
At the time of writing on Thursday (Feb 22nd), the CN50 index is still holding on to most of Wednesday’s gains, and is just hovering below that 12k TP.
Treatment.com AI Inc. (TRUE:CSE; TREIF:OTCMKTS) is a company that should have a very bright future as it has been pioneering the development of an AI healthcare platform using AI and advanced machine learning technologies that has the potential to revolutionize healthcare due to the streamlining of healthcare provision and the massive cost savings across the industry that should result.
The growth potential of this industry is enormous, as is made clear when you consider that the AI healthcare market, which was valued at US$11 billion in 2021, is projected to grow to US$187 billion in 2030, and with Treatment.com AI having already developed its own platform it is centrally placed to be a part of this.
The fields in which AI is set to make a big contribution are Virtual Assistance and Chatbots, Diagnosis and Treatment Planning, Streamlining Administrative Tasks, and Predictive Analytics.
Treatment.com AI’s platform is powered by its proprietary Global Library of Medicine, which incorporates AI machine learning and has been trained by hundreds of physician experts across the globe.
The company is already in partnership with the Mayo Clinic and the University of Minnesota Medical School and is in discussion with another 52 organizations.
We will now examine a range of charts to determine exactly what is happening with Treatment.com AI stock. These charts reveal clear technical patterns that enable us to see with almost pinpoint accuracy where the stock is in its lifecycle and, therefore, what we can expect to see unfold going forward.
The upside potential from the current historically low level is very substantial, especially in percentage terms.
We will start with the 2-year arithmetic chart, which makes brutally clear the severity of the bear market that followed from the peak at almost CA$63 towards the middle of 2021.
This savage bear market resulted in the stock losing well over 99% of its value from that peak. The value of this chart is not just that it clearly shows this bear market in its entirety, but it also shows how the rate of decline decelerated during the second half of 2022 before it settled into a long and very low base pattern that has continued from late 2022 all through 2023 and into this year.
Beyond observing these points, this chart is of little use technically because it squashes the base pattern so flat that we can’t see what is going on within it, but we can solve that problem by means of a log chart for the same timeframe, which we will now proceed to look at, but before leaving this chart to observe how upside volume has expanded quite dramatically since mid-October which has resulted in the Accumulation line shown at the bottom of it trending steeply higher — this is a clear indication of persistent accumulation of the stock presumably by those investors who believe that the company is set to do well and that its stock will, in consequence, enter a bullmarket. These are, therefore, very bullish indications.
Now, we will look at the 2-year log chart, which looks dramatically different from the arithmetic chart above for the same timeframe, which is due to the fact that the base pattern still in progress has formed at a very low level. This most useful chart makes it possible for us to see exactly what has been going on.
A Head-and-Shoulders pattern has built out whose Left Shoulder formed as far back as late 2022, so 14 months ago. The Right Shoulder of the pattern has been forming for several months now and is not yet complete, but with the price and its moving averages having converged in a most potent manner, we are believed to be fast approaching an upside breakout from this base pattern, especially as the Accumulation line is so strong.
We will now move on to review recent action in much more detail on a 10-month chart where we see that, embedded within the latter part of the Head-and-Shoulders bottom, is a fine, albeit lopsided, Cup & Handle base whose most distinguishing characteristic is high volume on the rally to complete the right side of the Cup part of it, which is exactly what we saw back in October.
These kinds of hybrid patterns, where the price chart has the characteristics of different base patterns simultaneously, are not uncommon, and happily, both the patterns we see on the Treatment.com AI chart are decidedly bullish. The Handle part of this Cup & Handle base, which started to form in mid-October, has been a remarkably narrow trading range, and the good news is that we can be reasonably confident of an upside breakout before much longer, thanks to the Accumulation line trending higher throughout, due to a preponderance of upside volume.
The conclusion is, with a breakout from the base pattern looking increasingly likely soon, the stock is rated a Strong Buy for all timeframes, and the upside potential from the current historically low level is very substantial, especially in percentage terms. The number of shares in issue is a reasonable 38.5 million.
Treatment.com AI closed at CA$0.52 on February 15, 2024.
Important Disclosures:
As of the date of this article, officers and/or employees of Streetwise Reports LLC (including members of their household) own securities of Treatment.com AI Inc..
Author Certification and Compensation: [Clive Maund of clivemaund.com] is being compensated as an independent contractor by Street Smart, an affiliate of Streetwise Reports, for writing this article. Maund received his UK Technical Analysts’ Diploma in 1989. The recommendations and opinions expressed in this content accurately reflect the personal, independent, and objective views of the author regarding any and all of the designated securities discussed. No part of the compensation received by the author was, is, or will be directly or indirectly related to the specific recommendations or views expressed.
Statements and opinions expressed are the opinions of the author and not of Streetwise Reports, Street Smart, or their officers. The author is wholly responsible for the accuracy of the statements. Streetwise Reports requires contributing authors to disclose any shareholdings in, or economic relationships with, companies that they write about. Any disclosures from the author can be found below. Streetwise Reports relies upon the authors to accurately provide this information and Streetwise Reports has no means of verifying its accuracy.
This article does not constitute investment advice and is not a solicitation for any investment. Streetwise Reports does not render general or specific investment advice and the information on Streetwise Reports should not be considered a recommendation to buy or sell any security. Each reader is encouraged to consult with his or her personal financial adviser and perform their own comprehensive investment research. By opening this page, each reader accepts and agrees to Streetwise Reports’ terms of use and full legal disclaimer. Streetwise Reports does not endorse or recommend the business, products, services or securities of any company.
The above represents the opinion and analysis of Mr. Maund, based on data available to him, at the time of writing. Mr. Maund’s opinions are his own, and are not a recommendation or an offer to buy or sell securities. As trading and investing in any financial markets may involve serious risk of loss, Mr. Maund recommends that you consult with a qualified investment advisor, one licensed by appropriate regulatory agencies in your legal jurisdiction and do your own due diligence and research when making any kind of a transaction with financial ramifications. Although a qualified and experienced stock market analyst, Clive Maund is not a Registered Securities Advisor. Therefore Mr. Maund’s opinions on the market and stocks can only be construed as a solicitation to buy and sell securities when they are subject to the prior approval and endorsement of a Registered Securities Advisor operating in accordance with the appropriate regulations in your area of jurisdiction.

 An autonomous race car built by the Technical University of Munich prepares to pass the University of Virginia’s entrant.