By InvestMacro
Here are the latest charts and statistics for the Commitment of Traders (COT) data published by the Commodities Futures Trading Commission (CFTC).
The latest COT data is updated through Tuesday February 13th and shows a quick view of how large market participants (for-profit speculators and commercial traders) were positioned in the futures markets. All currency positions are in direct relation to the US dollar where, for example, a bet for the euro is a bet that the euro will rise versus the dollar while a bet against the euro will be a bet that the euro will decline versus the dollar.
Weekly Speculator Changes led by British Pound Sterling & Mexican Peso
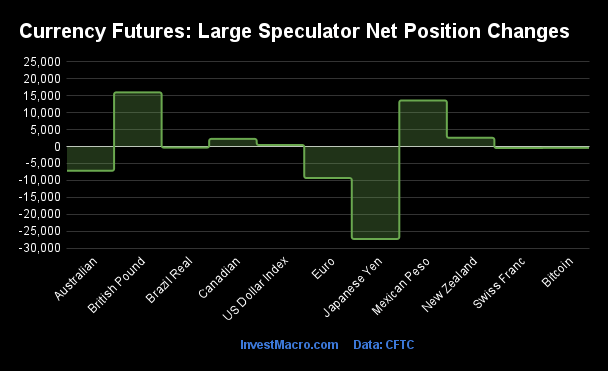
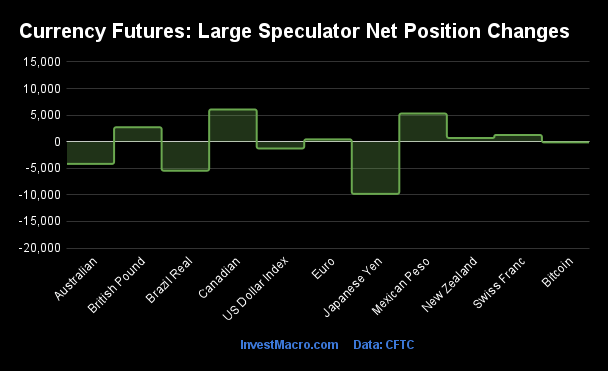
The COT currency market speculator bets were slightly lower this week as five out of the eleven currency markets we cover had higher positioning while the other six markets had lower speculator contracts.
Leading the gains for the currency markets was the British Pound (15,997 contracts) with the Mexican Peso (13,615 contracts), the New Zealand Dollar (2,577 contracts), Canadian Dollar (2,254 contracts) and the US Dollar Index (463 contracts) also having positive weeks.
The currencies seeing declines in speculator bets on the week were the Japanese Yen (-27,306 contracts), the EuroFX (-9,315 contracts), the Australian Dollar (-7,163 contracts), the Swiss Franc (-447 contracts), the Brazilian Real (-314 contracts) and Bitcoin (-398 contracts) also registering lower bets on the week.
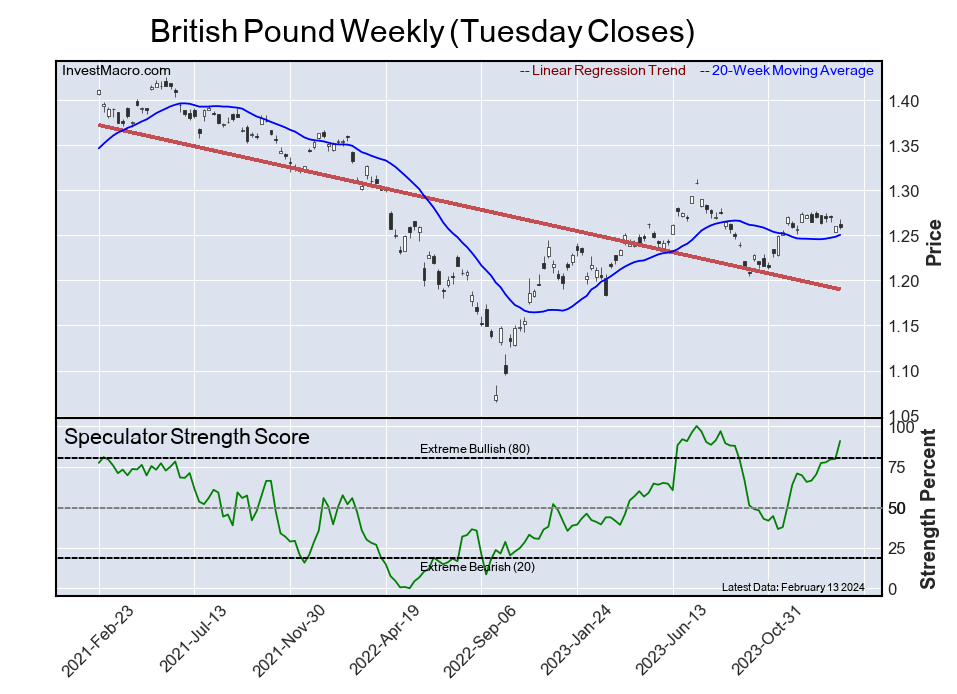
FX Speculators push British Pound bullish bets to 25-week high
Highlighting the COT currency’s data is the continued rise in the speculator’s positioning of the British Pound Sterling.
Large speculative Sterling positions rose this week by almost +16,000 contracts and have gained in seven consecutive weeks. The Sterling speculative level has added a total of +36,380 contracts to the net position over these last seven weeks and has brought the net level from a total of +14,092 contracts on December 26th to this week’s currently standing of +50,472 contracts. This marks the most bullish position for the GBP speculators since August 22nd, a span of twenty-five weeks.
The Pound Sterling exchange rate (GBPUSD currency pair) against the US Dollar has been oscillating around the 1.2500 exchange level over the past week despite recent downbeat economic news. The UK economy has recently dipped into a technical recession with declining GDP in both the 3rd and 4th quarters of 2023. However, with inflation still high, traders and market watchers still see the Bank of England holding their interest rates at high levels which could provide support for the UK currency.
The Pound exchange continues to be in a weekly uptrend since a recent dive in October when prices were falling and dipped as low as 1.2050. The currency has also come down from the most recent high levels of the current uptrend (topping out around 1.2800) and has now settled in right above the 200-day moving average with this week’s close trading at 1.2609.
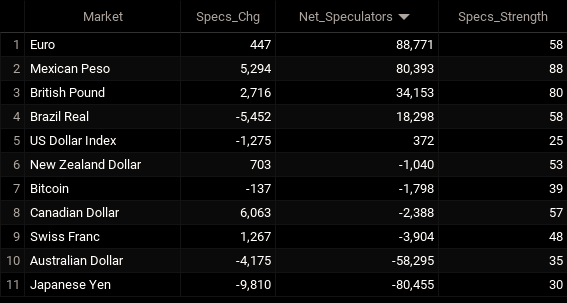
Speculators Leaderboard
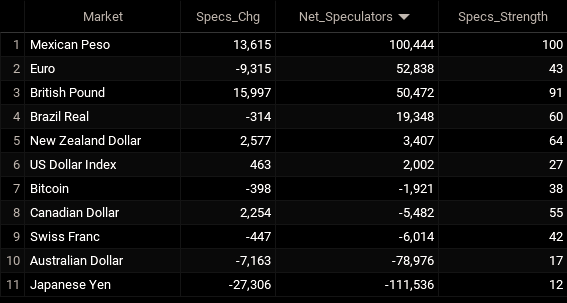
Legend: Weekly Speculators Change | Speculators Current Net Position | Speculators Strength Score compared to last 3-Years (0-100 range)
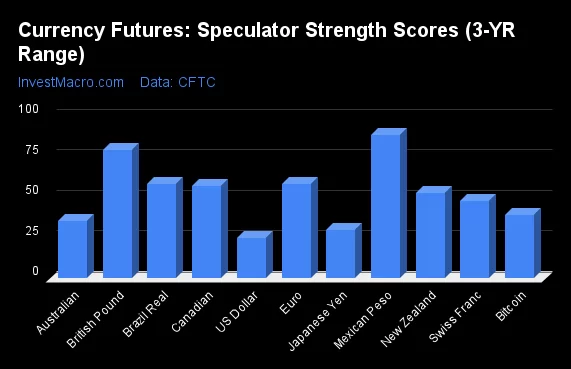
Strength Scores led by Mexican Peso & British Pound
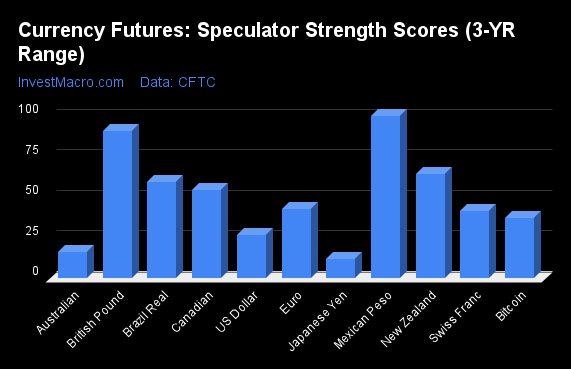
COT Strength Scores (a normalized measure of Speculator positions over a 3-Year range, from 0 to 100 where above 80 is Extreme-Bullish and below 20 is Extreme-Bearish) showed that the Mexican Peso (100 percent) and the British Pound (91 percent) lead the currency markets this week. The New Zealand Dollar (64 percent), Brazilian Real (60 percent) and the Canadian Dollar (54 percent) come in as the next highest in the weekly strength scores.
On the downside, the Japanese Yen (12 percent) and the Australian Dollar (16 percent) come in at the lowest strength levels currently and are in Extreme-Bearish territory (below 20 percent). The next lowest strength scores are the US Dollar Index (27 percent) and Bitcoin (37 percent).
Strength Statistics:
US Dollar Index (26.9 percent) vs US Dollar Index previous week (26.1 percent)
EuroFX (42.8 percent) vs EuroFX previous week (46.8 percent)
British Pound Sterling (90.8 percent) vs British Pound Sterling previous week (79.7 percent)
Japanese Yen (11.8 percent) vs Japanese Yen previous week (29.0 percent)
Swiss Franc (41.8 percent) vs Swiss Franc previous week (43.0 percent)
Canadian Dollar (54.5 percent) vs Canadian Dollar previous week (52.6 percent)
Australian Dollar (16.5 percent) vs Australian Dollar previous week (23.0 percent)
New Zealand Dollar (64.3 percent) vs New Zealand Dollar previous week (57.6 percent)
Mexican Peso (100.0 percent) vs Mexican Peso previous week (91.7 percent)
Brazilian Real (59.6 percent) vs Brazilian Real previous week (60.0 percent)
Bitcoin (37.5 percent) vs Bitcoin previous week (43.5 percent)
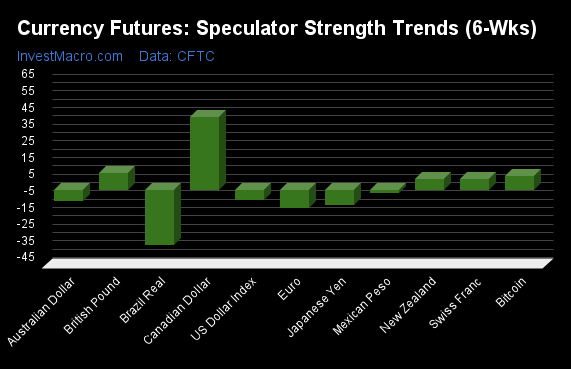
British Pound & Canadian Dollar top the 6-Week Strength Trends
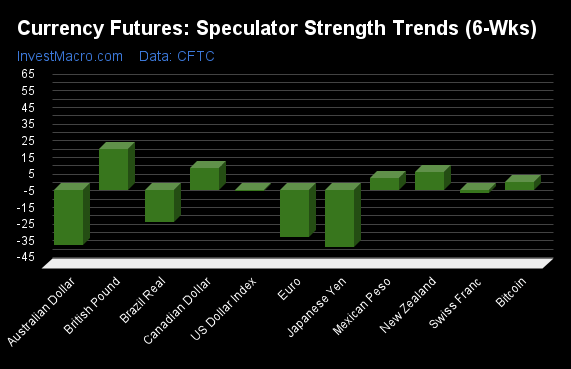
COT Strength Score Trends (or move index, calculates the 6-week changes in strength scores) showed that the British Pound (24 percent) and the Canadian Dollar (13 percent) lead the past six weeks trends for the currencies. The New Zealand Dollar (10 percent), the Mexican Peso (7 percent) and the Bitcoin (5 percent) are the next highest positive movers in the latest trends data.
The Japanese Yen (-34 percent) leads the downside trend scores currently with the Australian Dollar (-33 percent), the EuroFX (-28 percent) and the Brazilian Real (-19 percent) following next with lower trend scores.
Strength Trend Statistics:
US Dollar Index (-0.7 percent) vs US Dollar Index previous week (-2.7 percent)
EuroFX (-28.4 percent) vs EuroFX previous week (-23.5 percent)
British Pound Sterling (24.5 percent) vs British Pound Sterling previous week (14.1 percent)
Japanese Yen (-34.2 percent) vs Japanese Yen previous week (-18.0 percent)
Swiss Franc (-2.3 percent) vs Swiss Franc previous week (-6.1 percent)
Canadian Dollar (13.1 percent) vs Canadian Dollar previous week (22.6 percent)
Australian Dollar (-33.0 percent) vs Australian Dollar previous week (-18.8 percent)
New Zealand Dollar (10.3 percent) vs New Zealand Dollar previous week (11.7 percent)
Mexican Peso (6.9 percent) vs Mexican Peso previous week (-0.6 percent)
Brazilian Real (-19.4 percent) vs Brazilian Real previous week (-31.9 percent)
Bitcoin (4.5 percent) vs Bitcoin previous week (11.7 percent)
Individual COT Forex Markets:
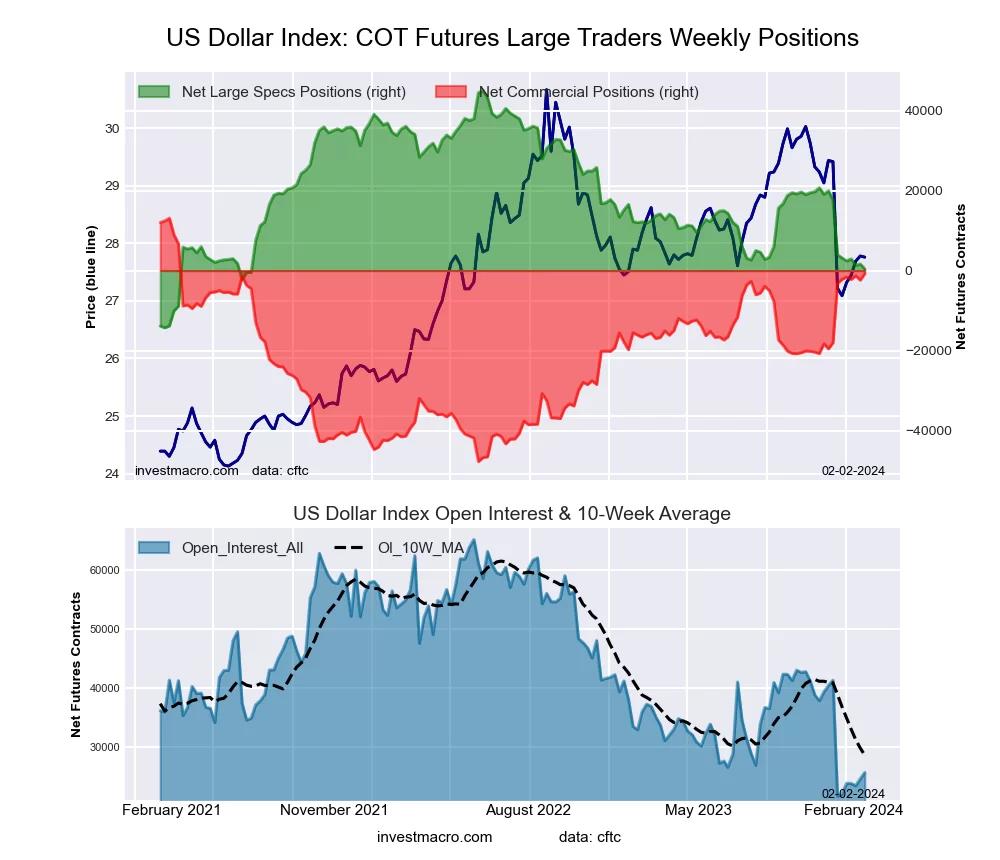
US Dollar Index Futures:
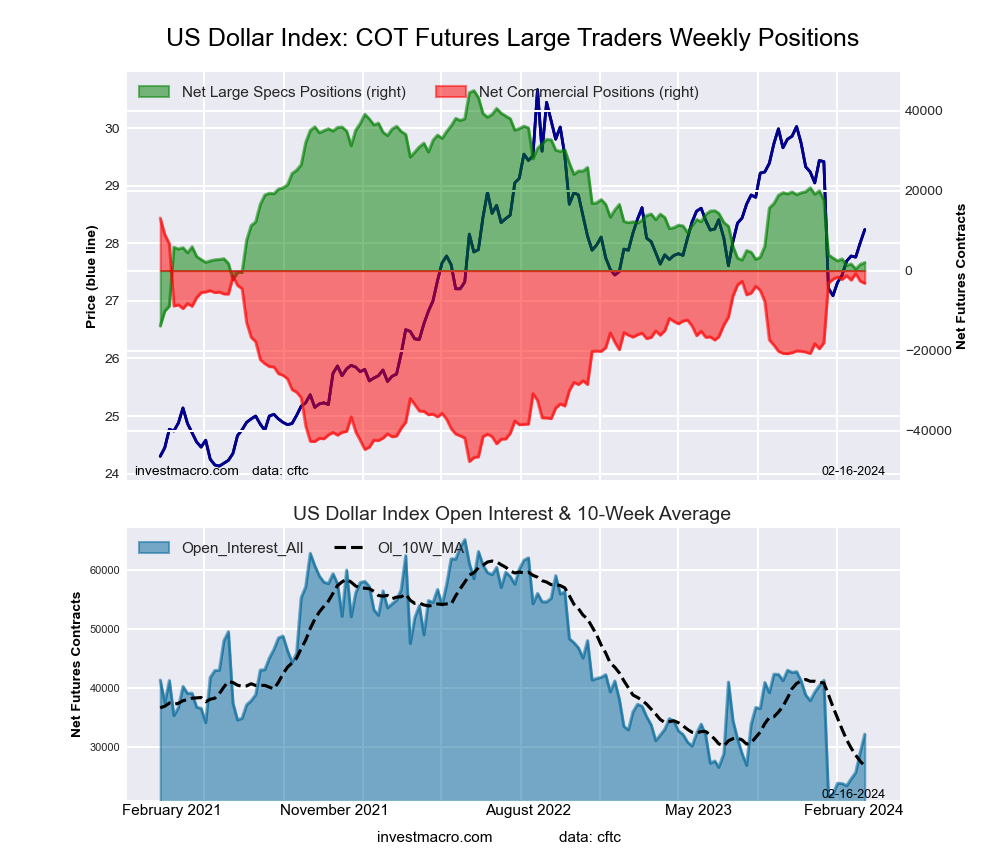 The US Dollar Index large speculator standing this week totaled a net position of 2,002 contracts in the data reported through Tuesday. This was a weekly boost of 463 contracts from the previous week which had a total of 1,539 net contracts.
This week’s current strength score (the trader positioning range over the past three years, measured from 0 to 100) shows the speculators are currently Bearish with a score of 26.9 percent. The commercials are Bullish with a score of 73.2 percent and the small traders (not shown in chart) are Bearish with a score of 24.9 percent.
Price Trend-Following Model: Downtrend
Our weekly trend-following model classifies the current market price position as: Downtrend. The current action for the model is considered to be: Hold – Maintain Short Position.
| US DOLLAR INDEX Statistics | SPECULATORS | COMMERCIALS | SMALL TRADERS |
| – Percent of Open Interest Longs: | 65.5 | 15.3 | 11.4 |
| – Percent of Open Interest Shorts: | 59.2 | 25.1 | 7.8 |
| – Net Position: | 2,002 | -3,179 | 1,177 |
| – Gross Longs: | 21,096 | 4,916 | 3,675 |
| – Gross Shorts: | 19,094 | 8,095 | 2,498 |
| – Long to Short Ratio: | 1.1 to 1 | 0.6 to 1 | 1.5 to 1 |
| NET POSITION TREND: | | | |
| – Strength Index Score (3 Year Range Pct): | 26.9 | 73.2 | 24.9 |
| – Strength Index Reading (3 Year Range): | Bearish | Bullish | Bearish |
| NET POSITION MOVEMENT INDEX: | | | |
| – 6-Week Change in Strength Index: | -0.7 | -2.6 | 23.1 |
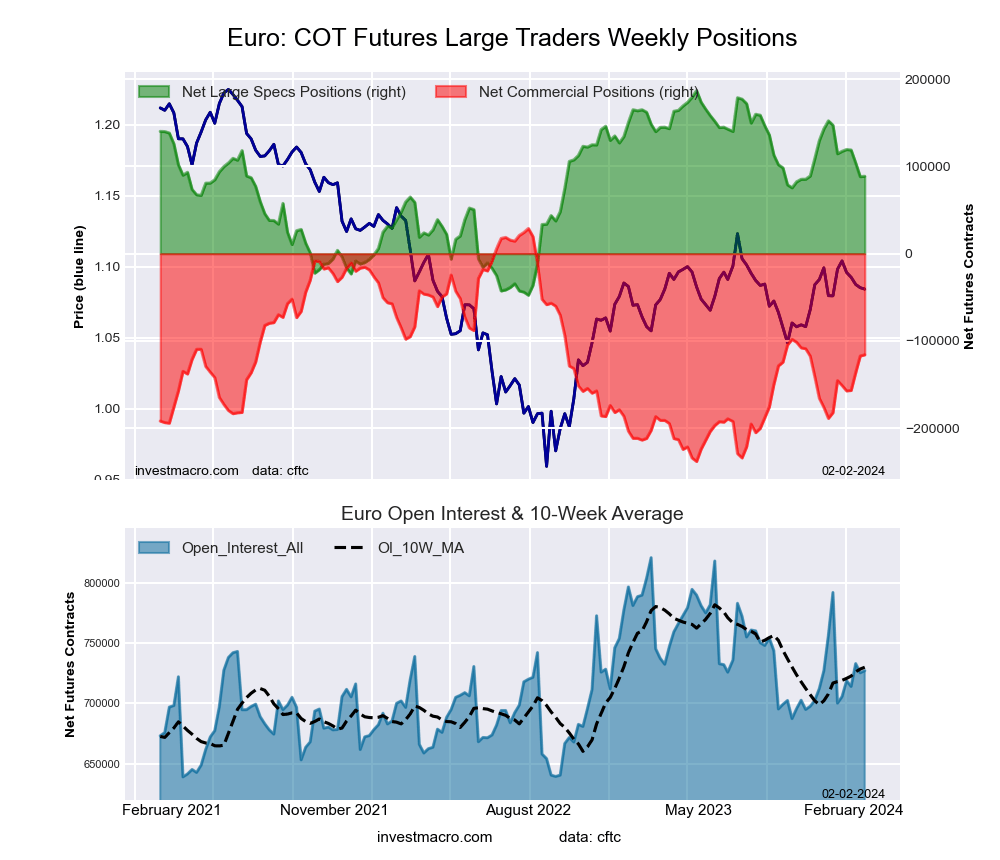
Euro Currency Futures:
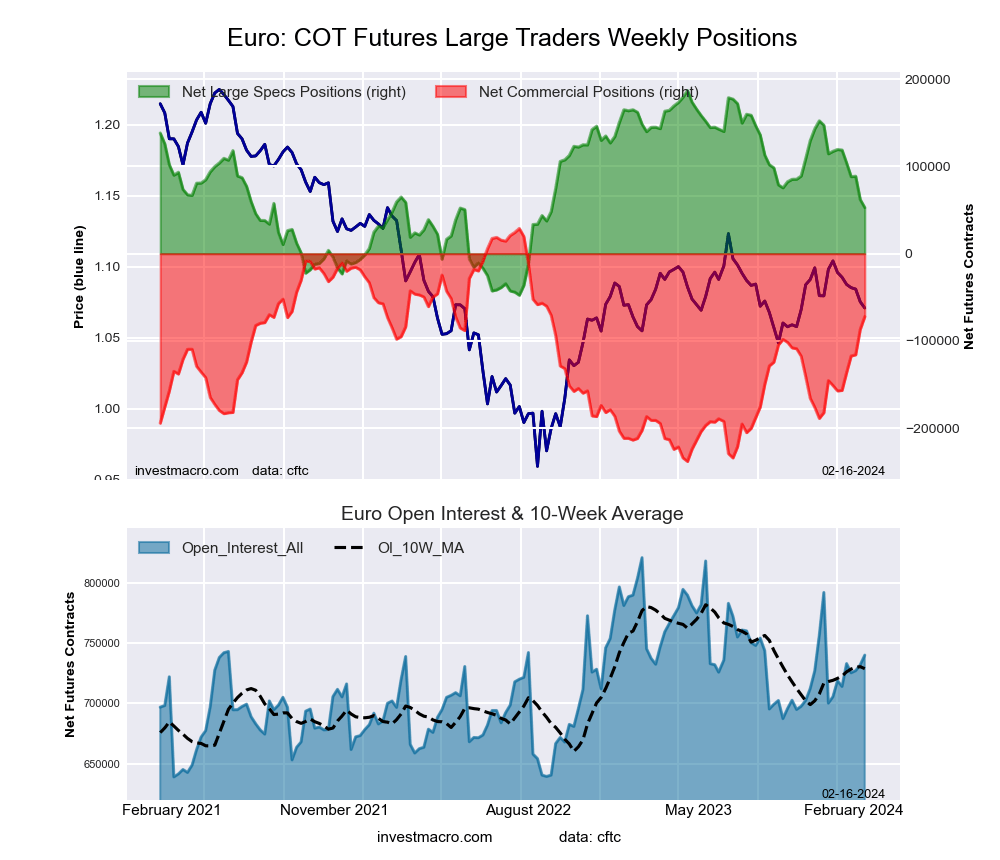 The Euro Currency large speculator standing this week totaled a net position of 52,838 contracts in the data reported through Tuesday. This was a weekly lowering of -9,315 contracts from the previous week which had a total of 62,153 net contracts.
This week’s current strength score (the trader positioning range over the past three years, measured from 0 to 100) shows the speculators are currently Bearish with a score of 42.8 percent. The commercials are Bullish with a score of 62.2 percent and the small traders (not shown in chart) are Bearish-Extreme with a score of 10.0 percent.
Price Trend-Following Model: Weak Uptrend
Our weekly trend-following model classifies the current market price position as: Weak Uptrend. The current action for the model is considered to be: Hold – Maintain Long Position.
| EURO Currency Statistics | SPECULATORS | COMMERCIALS | SMALL TRADERS |
| – Percent of Open Interest Longs: | 28.5 | 59.1 | 10.4 |
| – Percent of Open Interest Shorts: | 21.3 | 68.8 | 7.8 |
| – Net Position: | 52,838 | -72,264 | 19,426 |
| – Gross Longs: | 210,848 | 437,266 | 76,997 |
| – Gross Shorts: | 158,010 | 509,530 | 57,571 |
| – Long to Short Ratio: | 1.3 to 1 | 0.9 to 1 | 1.3 to 1 |
| NET POSITION TREND: | | | |
| – Strength Index Score (3 Year Range Pct): | 42.8 | 62.2 | 10.0 |
| – Strength Index Reading (3 Year Range): | Bearish | Bullish | Bearish-Extreme |
| NET POSITION MOVEMENT INDEX: | | | |
| – 6-Week Change in Strength Index: | -28.4 | 31.9 | -29.5 |
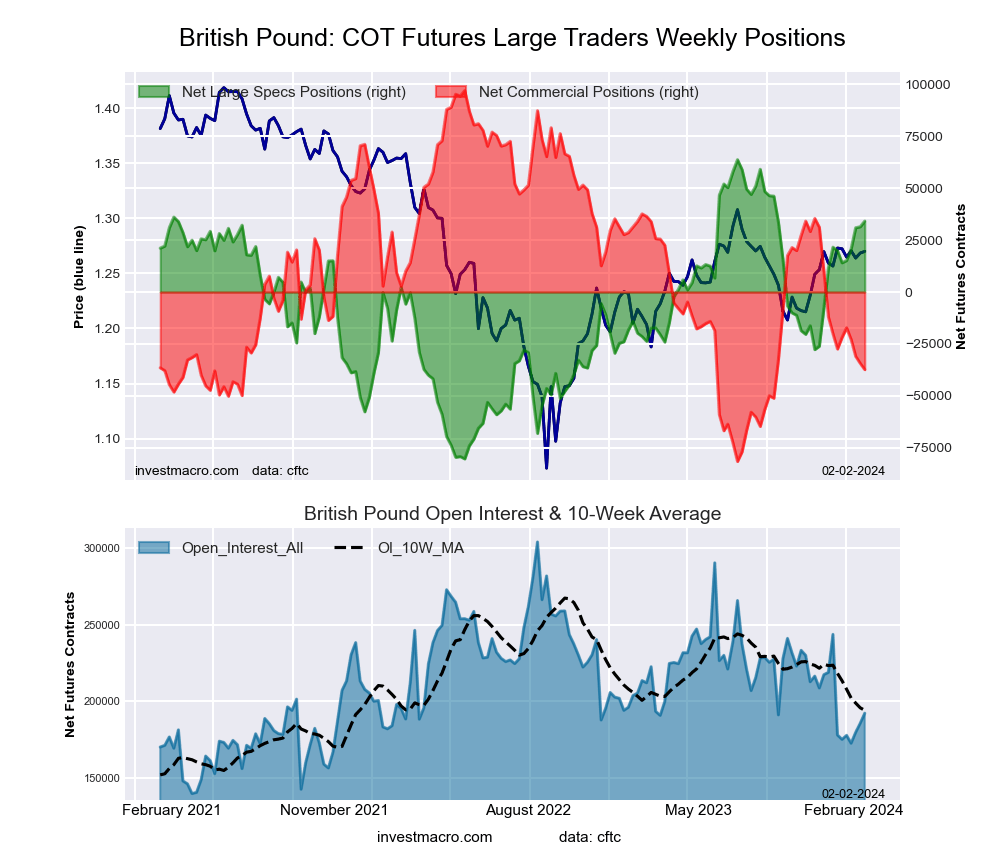
British Pound Sterling Futures:
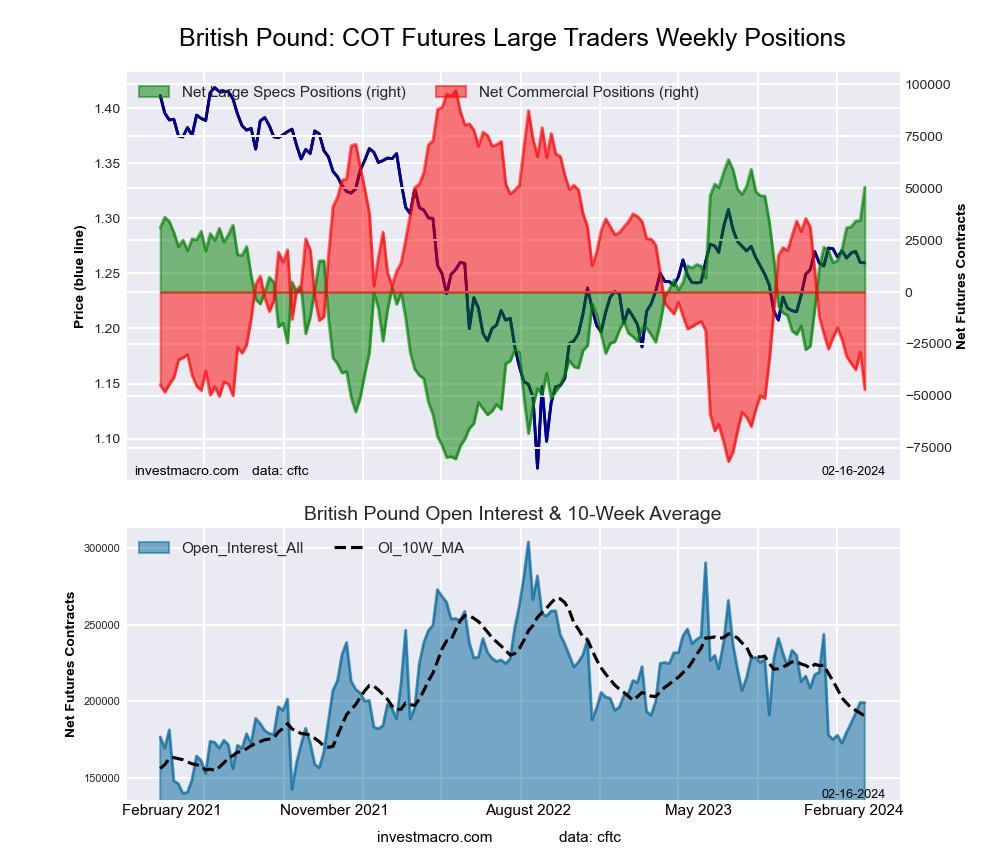 The British Pound Sterling large speculator standing this week totaled a net position of 50,472 contracts in the data reported through Tuesday. This was a weekly increase of 15,997 contracts from the previous week which had a total of 34,475 net contracts.
This week’s current strength score (the trader positioning range over the past three years, measured from 0 to 100) shows the speculators are currently Bullish-Extreme with a score of 90.8 percent. The commercials are Bearish-Extreme with a score of 19.4 percent and the small traders (not shown in chart) are Bullish with a score of 51.0 percent.
Price Trend-Following Model: Uptrend
Our weekly trend-following model classifies the current market price position as: Uptrend. The current action for the model is considered to be: Hold – Maintain Long Position.
| BRITISH POUND Statistics | SPECULATORS | COMMERCIALS | SMALL TRADERS |
| – Percent of Open Interest Longs: | 45.5 | 36.3 | 12.6 |
| – Percent of Open Interest Shorts: | 20.1 | 59.9 | 14.4 |
| – Net Position: | 50,472 | -46,883 | -3,589 |
| – Gross Longs: | 90,545 | 72,289 | 25,127 |
| – Gross Shorts: | 40,073 | 119,172 | 28,716 |
| – Long to Short Ratio: | 2.3 to 1 | 0.6 to 1 | 0.9 to 1 |
| NET POSITION TREND: | | | |
| – Strength Index Score (3 Year Range Pct): | 90.8 | 19.4 | 51.0 |
| – Strength Index Reading (3 Year Range): | Bullish-Extreme | Bearish-Extreme | Bullish |
| NET POSITION MOVEMENT INDEX: | | | |
| – 6-Week Change in Strength Index: | 24.5 | -16.6 | -11.1 |
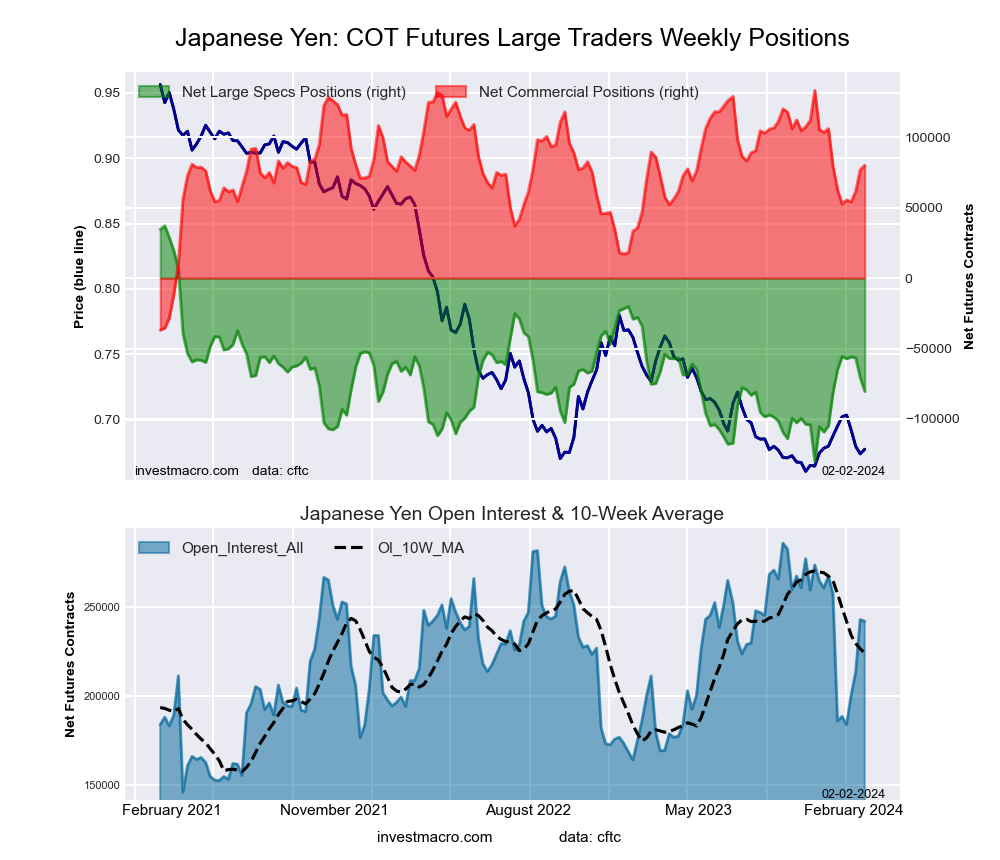
Japanese Yen Futures:
 The Japanese Yen large speculator standing this week totaled a net position of -111,536 contracts in the data reported through Tuesday. This was a weekly lowering of -27,306 contracts from the previous week which had a total of -84,230 net contracts.
This week’s current strength score (the trader positioning range over the past three years, measured from 0 to 100) shows the speculators are currently Bearish-Extreme with a score of 11.8 percent. The commercials are Bullish-Extreme with a score of 88.8 percent and the small traders (not shown in chart) are Bullish with a score of 71.2 percent.
Price Trend-Following Model: Weak Uptrend
Our weekly trend-following model classifies the current market price position as: Weak Uptrend. The current action for the model is considered to be: Hold – Maintain Long Position.
| JAPANESE YEN Statistics | SPECULATORS | COMMERCIALS | SMALL TRADERS |
| – Percent of Open Interest Longs: | 19.2 | 63.7 | 14.2 |
| – Percent of Open Interest Shorts: | 55.8 | 25.9 | 15.4 |
| – Net Position: | -111,536 | 115,172 | -3,636 |
| – Gross Longs: | 58,554 | 194,067 | 43,189 |
| – Gross Shorts: | 170,090 | 78,895 | 46,825 |
| – Long to Short Ratio: | 0.3 to 1 | 2.5 to 1 | 0.9 to 1 |
| NET POSITION TREND: | | | |
| – Strength Index Score (3 Year Range Pct): | 11.8 | 88.8 | 71.2 |
| – Strength Index Reading (3 Year Range): | Bearish-Extreme | Bullish-Extreme | Bullish |
| NET POSITION MOVEMENT INDEX: | | | |
| – 6-Week Change in Strength Index: | -34.2 | 37.0 | -16.8 |
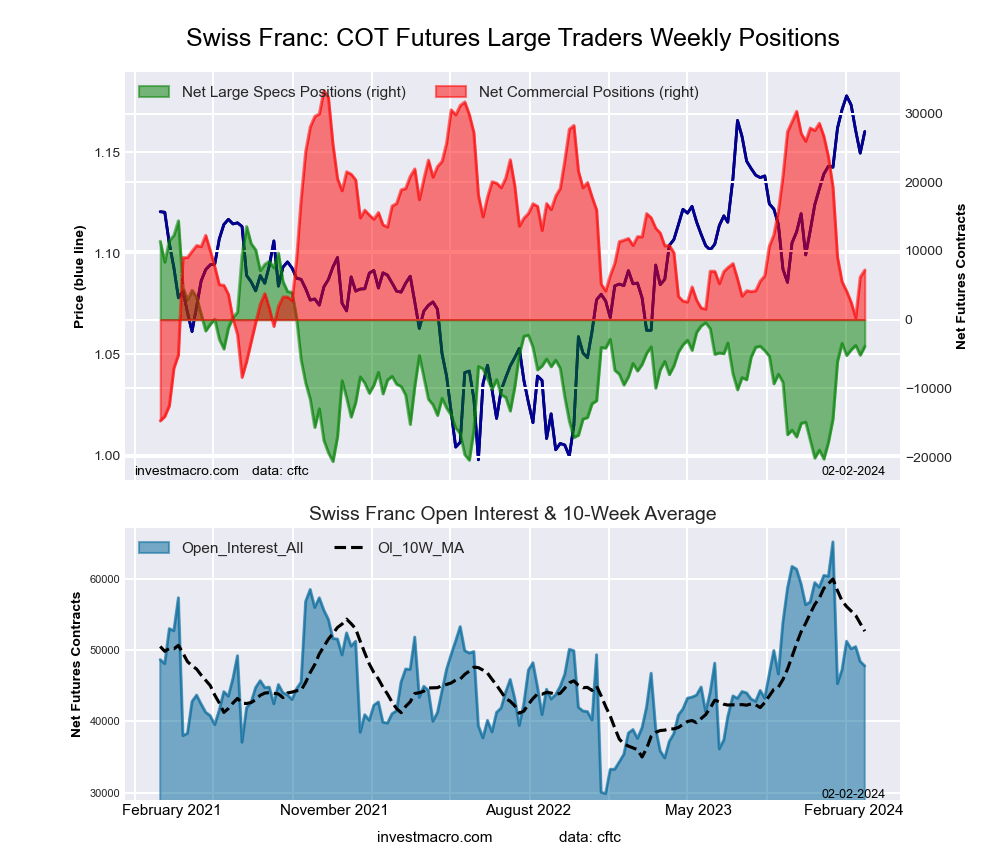
Swiss Franc Futures:
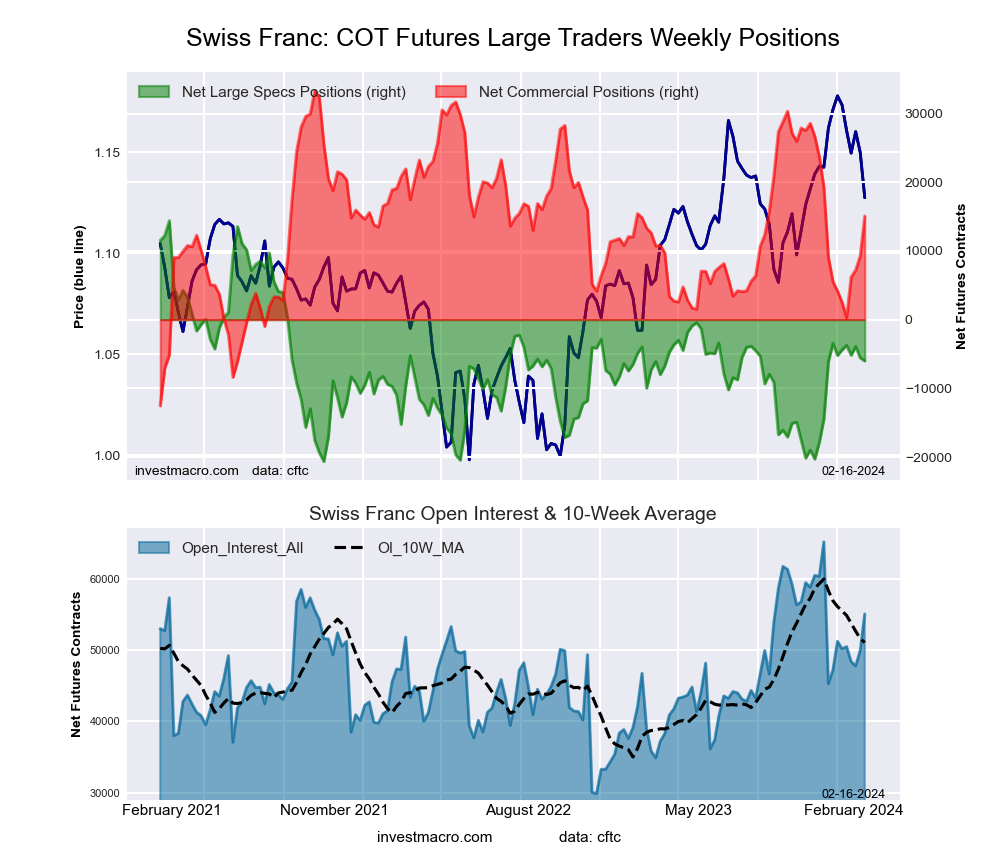 The Swiss Franc large speculator standing this week totaled a net position of -6,014 contracts in the data reported through Tuesday. This was a weekly decline of -447 contracts from the previous week which had a total of -5,567 net contracts.
This week’s current strength score (the trader positioning range over the past three years, measured from 0 to 100) shows the speculators are currently Bearish with a score of 41.8 percent. The commercials are Bullish with a score of 60.2 percent and the small traders (not shown in chart) are Bearish with a score of 36.0 percent.
Price Trend-Following Model: Weak Uptrend
Our weekly trend-following model classifies the current market price position as: Weak Uptrend. The current action for the model is considered to be: Hold – Maintain Long Position.
| SWISS FRANC Statistics | SPECULATORS | COMMERCIALS | SMALL TRADERS |
| – Percent of Open Interest Longs: | 23.0 | 58.4 | 18.3 |
| – Percent of Open Interest Shorts: | 34.0 | 31.0 | 34.8 |
| – Net Position: | -6,014 | 15,080 | -9,066 |
| – Gross Longs: | 12,689 | 32,148 | 10,071 |
| – Gross Shorts: | 18,703 | 17,068 | 19,137 |
| – Long to Short Ratio: | 0.7 to 1 | 1.9 to 1 | 0.5 to 1 |
| NET POSITION TREND: | | | |
| – Strength Index Score (3 Year Range Pct): | 41.8 | 60.2 | 36.0 |
| – Strength Index Reading (3 Year Range): | Bearish | Bullish | Bearish |
| NET POSITION MOVEMENT INDEX: | | | |
| – 6-Week Change in Strength Index: | -2.3 | 23.8 | -46.0 |
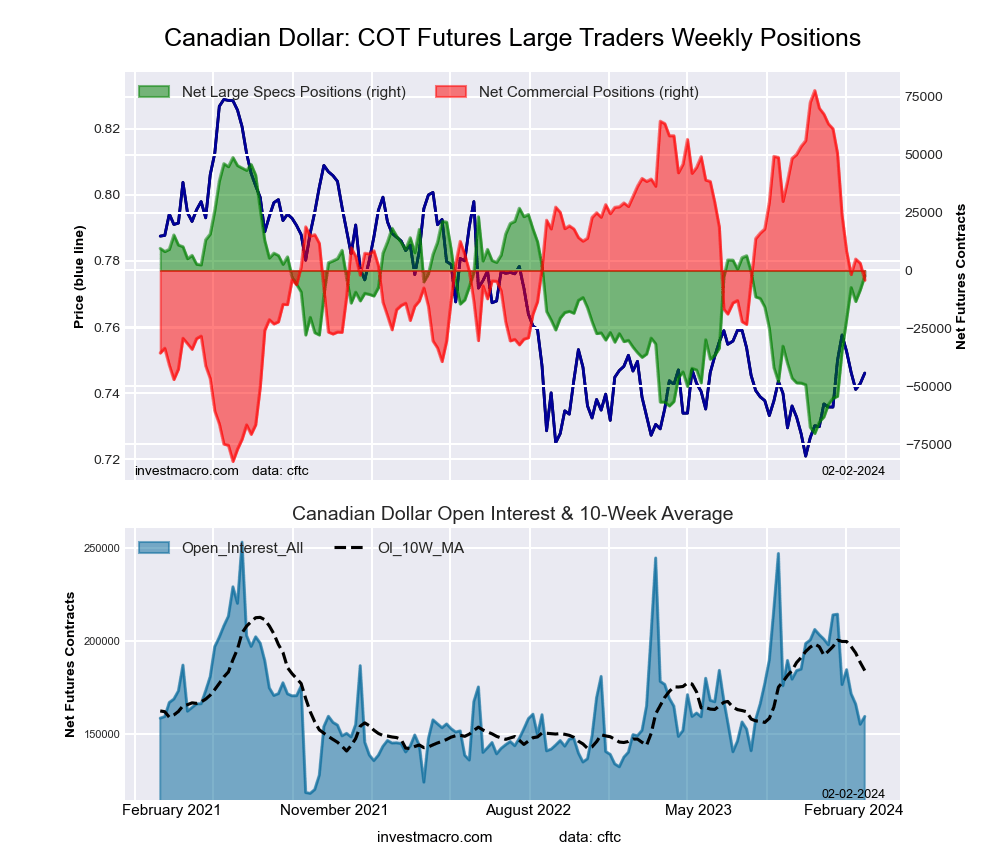
Canadian Dollar Futures:
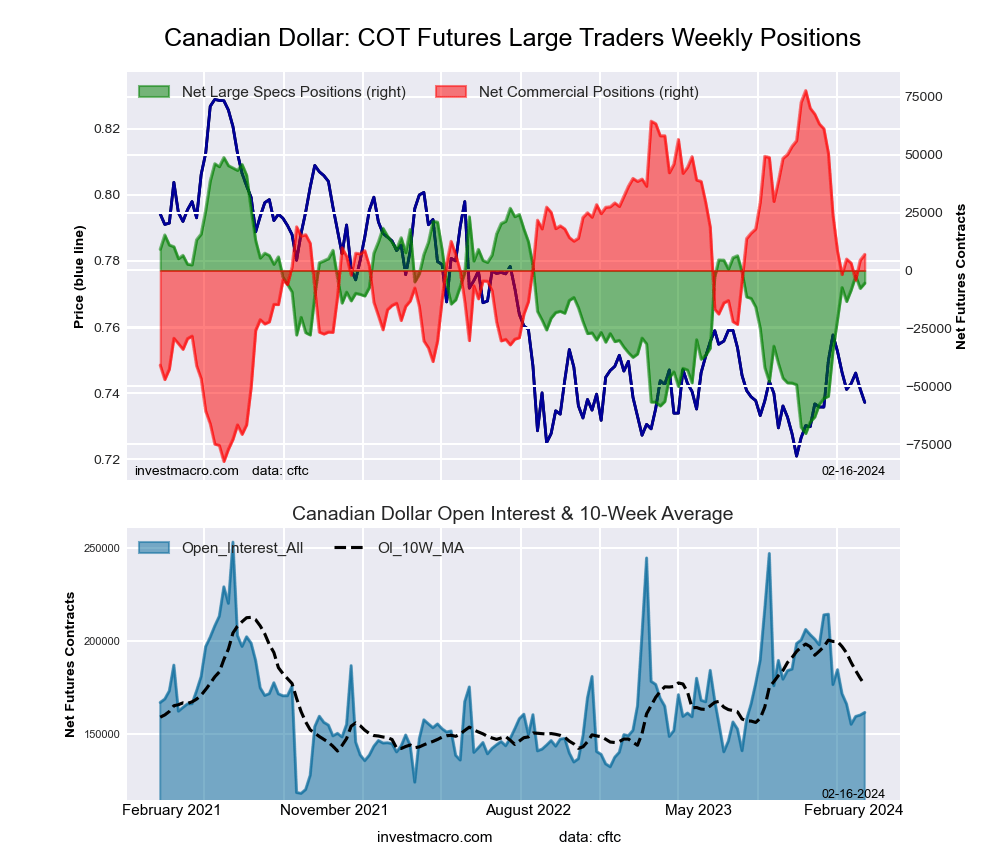 The Canadian Dollar large speculator standing this week totaled a net position of -5,482 contracts in the data reported through Tuesday. This was a weekly increase of 2,254 contracts from the previous week which had a total of -7,736 net contracts.
This week’s current strength score (the trader positioning range over the past three years, measured from 0 to 100) shows the speculators are currently Bullish with a score of 54.5 percent. The commercials are Bullish with a score of 55.8 percent and the small traders (not shown in chart) are Bearish-Extreme with a score of 19.5 percent.
Price Trend-Following Model: Uptrend
Our weekly trend-following model classifies the current market price position as: Uptrend. The current action for the model is considered to be: Hold – Maintain Long Position.
| CANADIAN DOLLAR Statistics | SPECULATORS | COMMERCIALS | SMALL TRADERS |
| – Percent of Open Interest Longs: | 22.1 | 57.1 | 18.7 |
| – Percent of Open Interest Shorts: | 25.5 | 52.8 | 19.6 |
| – Net Position: | -5,482 | 6,958 | -1,476 |
| – Gross Longs: | 35,698 | 92,188 | 30,243 |
| – Gross Shorts: | 41,180 | 85,230 | 31,719 |
| – Long to Short Ratio: | 0.9 to 1 | 1.1 to 1 | 1.0 to 1 |
| NET POSITION TREND: | | | |
| – Strength Index Score (3 Year Range Pct): | 54.5 | 55.8 | 19.5 |
| – Strength Index Reading (3 Year Range): | Bullish | Bullish | Bearish-Extreme |
| NET POSITION MOVEMENT INDEX: | | | |
| – 6-Week Change in Strength Index: | 13.1 | -0.9 | -31.7 |
Australian Dollar Futures:
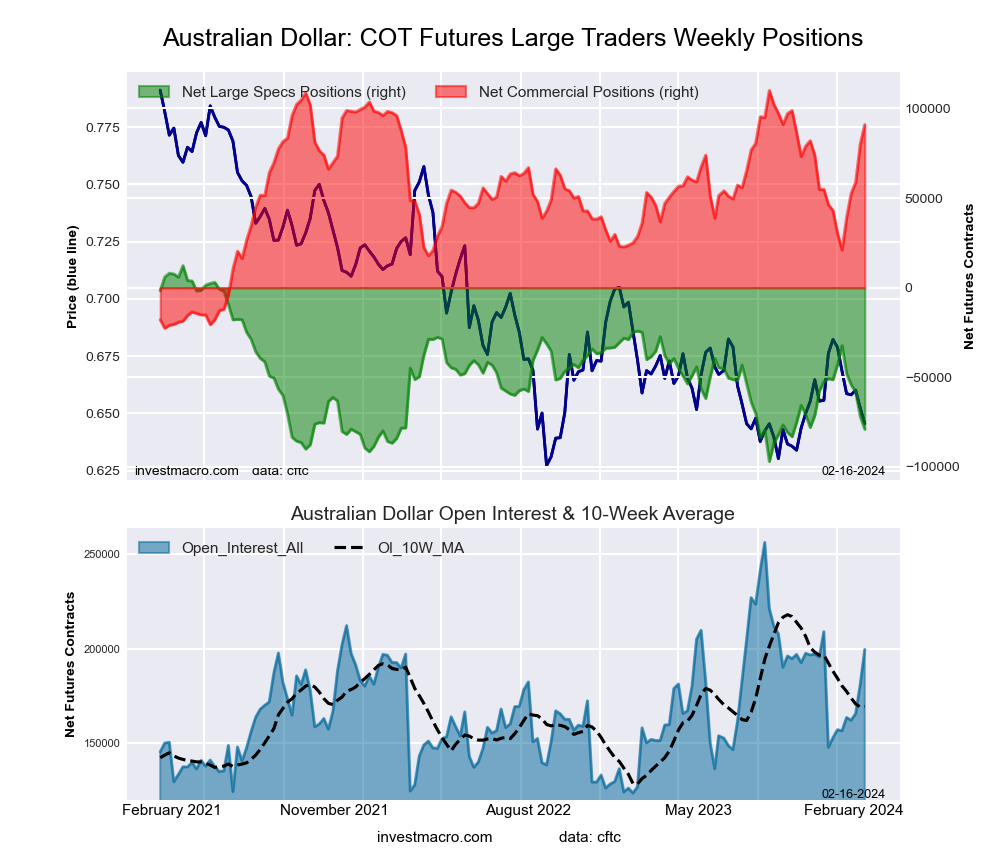 The Australian Dollar large speculator standing this week totaled a net position of -78,976 contracts in the data reported through Tuesday. This was a weekly lowering of -7,163 contracts from the previous week which had a total of -71,813 net contracts.
This week’s current strength score (the trader positioning range over the past three years, measured from 0 to 100) shows the speculators are currently Bearish-Extreme with a score of 16.5 percent. The commercials are Bullish-Extreme with a score of 85.7 percent and the small traders (not shown in chart) are Bearish with a score of 23.2 percent.
Price Trend-Following Model: Weak Uptrend
Our weekly trend-following model classifies the current market price position as: Weak Uptrend. The current action for the model is considered to be: Hold – Maintain Long Position.
| AUSTRALIAN DOLLAR Statistics | SPECULATORS | COMMERCIALS | SMALL TRADERS |
| – Percent of Open Interest Longs: | 23.8 | 64.4 | 9.2 |
| – Percent of Open Interest Shorts: | 63.4 | 18.8 | 15.2 |
| – Net Position: | -78,976 | 90,985 | -12,009 |
| – Gross Longs: | 47,405 | 128,465 | 18,320 |
| – Gross Shorts: | 126,381 | 37,480 | 30,329 |
| – Long to Short Ratio: | 0.4 to 1 | 3.4 to 1 | 0.6 to 1 |
| NET POSITION TREND: | | | |
| – Strength Index Score (3 Year Range Pct): | 16.5 | 85.7 | 23.2 |
| – Strength Index Reading (3 Year Range): | Bearish-Extreme | Bullish-Extreme | Bearish |
| NET POSITION MOVEMENT INDEX: | | | |
| – 6-Week Change in Strength Index: | -33.0 | 45.8 | -60.0 |
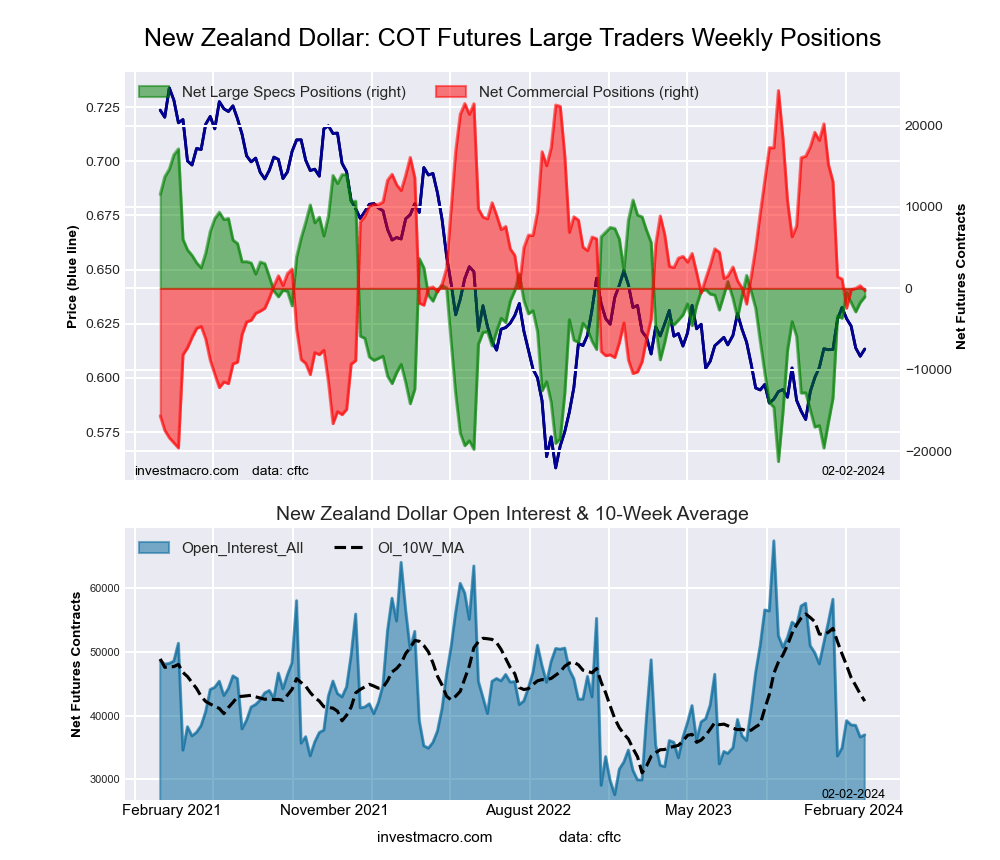
New Zealand Dollar Futures:
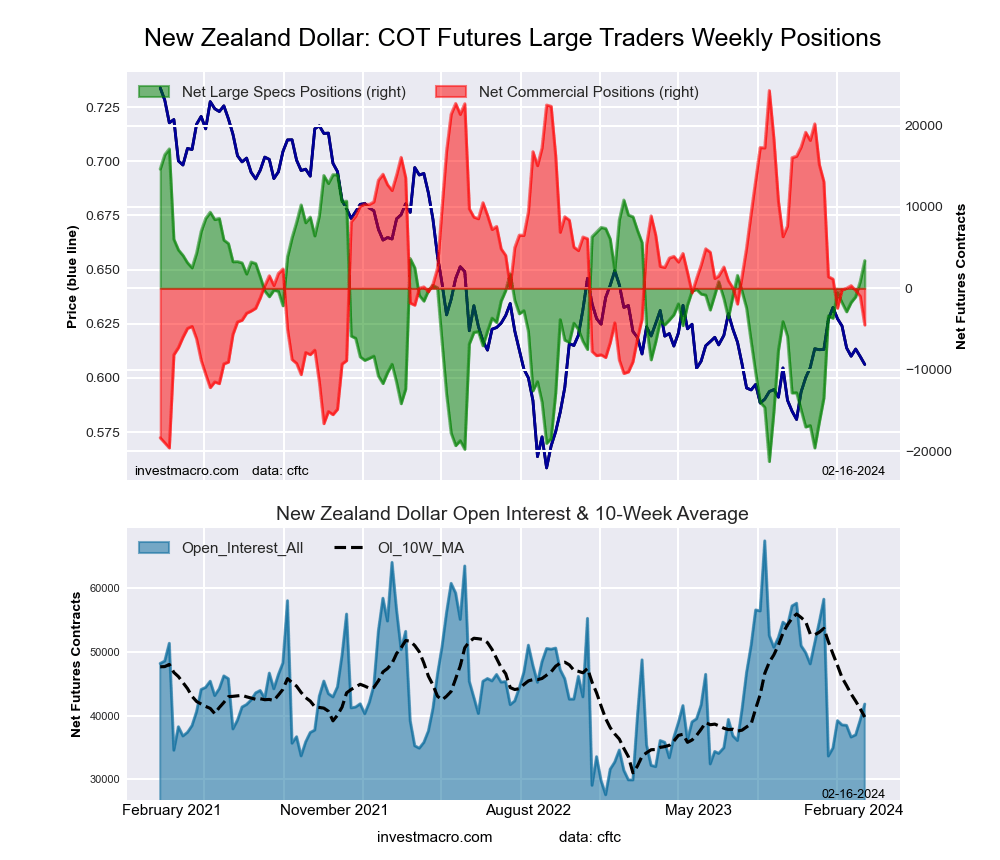 The New Zealand Dollar large speculator standing this week totaled a net position of 3,407 contracts in the data reported through Tuesday. This was a weekly increase of 2,577 contracts from the previous week which had a total of 830 net contracts.
This week’s current strength score (the trader positioning range over the past three years, measured from 0 to 100) shows the speculators are currently Bullish with a score of 64.3 percent. The commercials are Bearish with a score of 34.4 percent and the small traders (not shown in chart) are Bullish with a score of 66.9 percent.
Price Trend-Following Model: Uptrend
Our weekly trend-following model classifies the current market price position as: Uptrend. The current action for the model is considered to be: Hold – Maintain Long Position.
| NEW ZEALAND DOLLAR Statistics | SPECULATORS | COMMERCIALS | SMALL TRADERS |
| – Percent of Open Interest Longs: | 46.9 | 37.5 | 11.5 |
| – Percent of Open Interest Shorts: | 38.8 | 48.2 | 8.9 |
| – Net Position: | 3,407 | -4,505 | 1,098 |
| – Gross Longs: | 19,632 | 15,668 | 4,819 |
| – Gross Shorts: | 16,225 | 20,173 | 3,721 |
| – Long to Short Ratio: | 1.2 to 1 | 0.8 to 1 | 1.3 to 1 |
| NET POSITION TREND: | | | |
| – Strength Index Score (3 Year Range Pct): | 64.3 | 34.4 | 66.9 |
| – Strength Index Reading (3 Year Range): | Bullish | Bearish | Bullish |
| NET POSITION MOVEMENT INDEX: | | | |
| – 6-Week Change in Strength Index: | 10.3 | -4.7 | -23.8 |
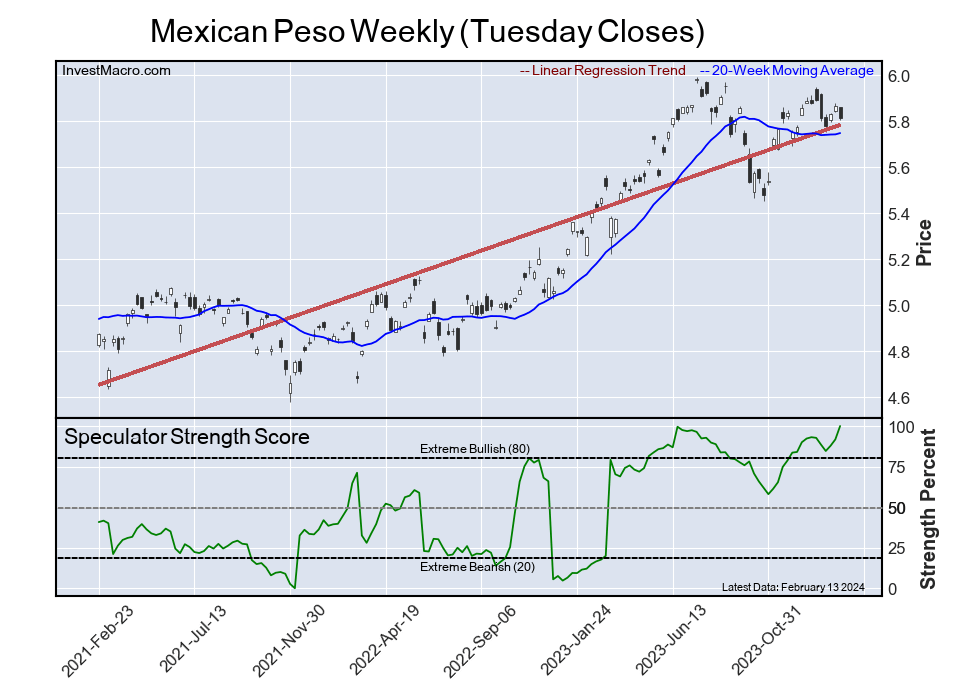
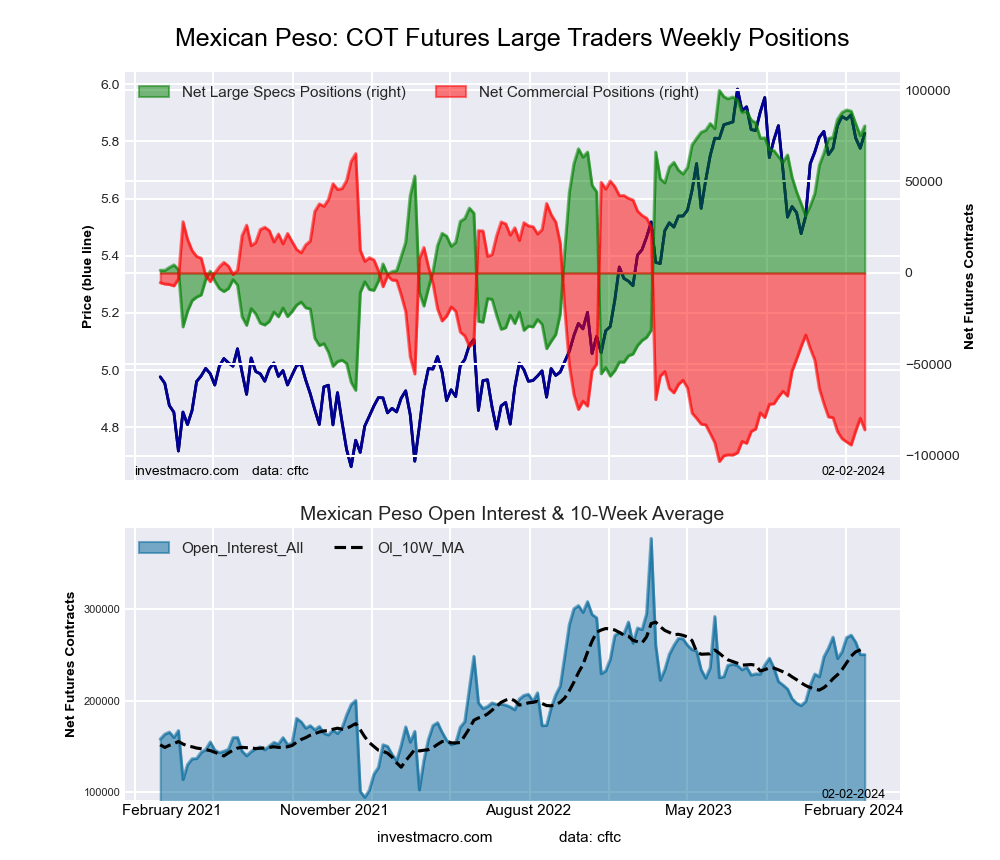
Mexican Peso Futures:
 The Mexican Peso large speculator standing this week totaled a net position of 100,444 contracts in the data reported through Tuesday. This was a weekly rise of 13,615 contracts from the previous week which had a total of 86,829 net contracts.
This week’s current strength score (the trader positioning range over the past three years, measured from 0 to 100) shows the speculators are currently Bullish-Extreme with a score of 100.0 percent. The commercials are Bearish-Extreme with a score of 0.0 percent and the small traders (not shown in chart) are Bearish with a score of 40.5 percent.
Price Trend-Following Model: Uptrend
Our weekly trend-following model classifies the current market price position as: Uptrend. The current action for the model is considered to be: Hold – Maintain Long Position.
| MEXICAN PESO Statistics | SPECULATORS | COMMERCIALS | SMALL TRADERS |
| – Percent of Open Interest Longs: | 55.5 | 38.7 | 2.8 |
| – Percent of Open Interest Shorts: | 17.6 | 78.3 | 1.1 |
| – Net Position: | 100,444 | -105,042 | 4,598 |
| – Gross Longs: | 147,176 | 102,632 | 7,407 |
| – Gross Shorts: | 46,732 | 207,674 | 2,809 |
| – Long to Short Ratio: | 3.1 to 1 | 0.5 to 1 | 2.6 to 1 |
| NET POSITION TREND: | | | |
| – Strength Index Score (3 Year Range Pct): | 100.0 | 0.0 | 40.5 |
| – Strength Index Reading (3 Year Range): | Bullish-Extreme | Bearish-Extreme | Bearish |
| NET POSITION MOVEMENT INDEX: | | | |
| – 6-Week Change in Strength Index: | 6.9 | -7.5 | 8.7 |
Brazilian Real Futures:
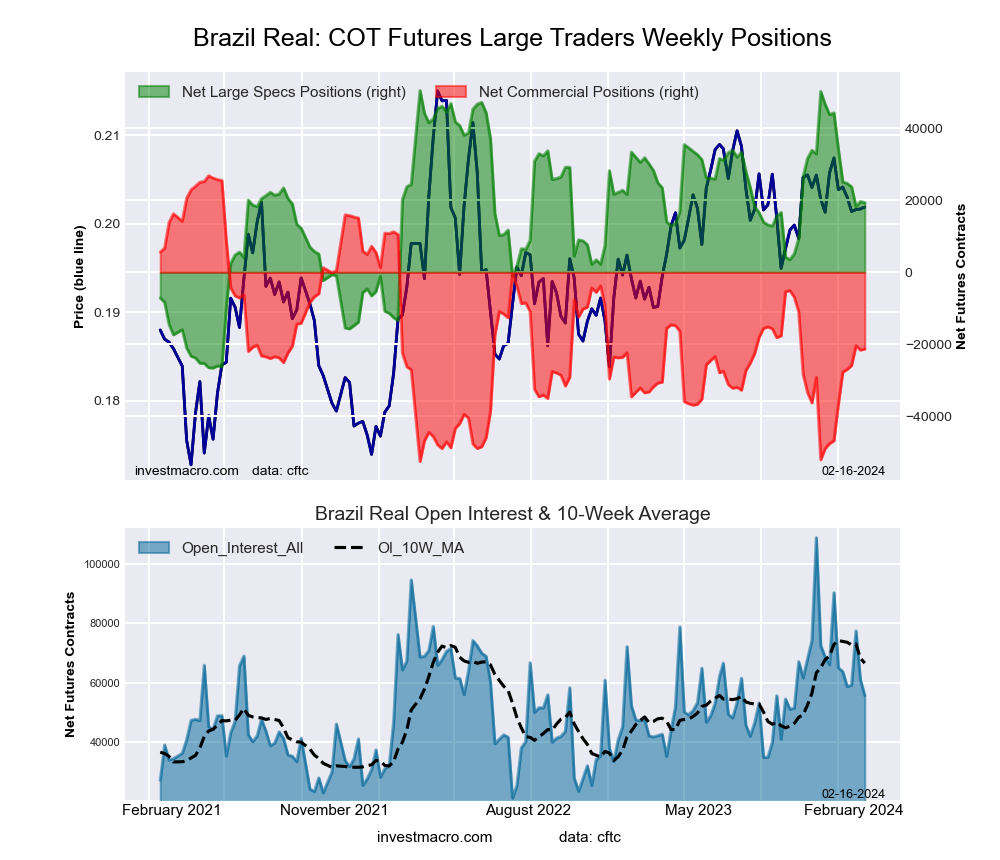 The Brazilian Real large speculator standing this week totaled a net position of 19,348 contracts in the data reported through Tuesday. This was a weekly fall of -314 contracts from the previous week which had a total of 19,662 net contracts.
This week’s current strength score (the trader positioning range over the past three years, measured from 0 to 100) shows the speculators are currently Bullish with a score of 59.6 percent. The commercials are Bearish with a score of 39.4 percent and the small traders (not shown in chart) are Bullish with a score of 52.8 percent.
Price Trend-Following Model: Weak Uptrend
Our weekly trend-following model classifies the current market price position as: Weak Uptrend. The current action for the model is considered to be: Hold – Maintain Long Position.
| BRAZIL REAL Statistics | SPECULATORS | COMMERCIALS | SMALL TRADERS |
| – Percent of Open Interest Longs: | 58.6 | 35.4 | 5.8 |
| – Percent of Open Interest Shorts: | 23.8 | 73.7 | 2.2 |
| – Net Position: | 19,348 | -21,321 | 1,973 |
| – Gross Longs: | 32,621 | 19,693 | 3,211 |
| – Gross Shorts: | 13,273 | 41,014 | 1,238 |
| – Long to Short Ratio: | 2.5 to 1 | 0.5 to 1 | 2.6 to 1 |
| NET POSITION TREND: | | | |
| – Strength Index Score (3 Year Range Pct): | 59.6 | 39.4 | 52.8 |
| – Strength Index Reading (3 Year Range): | Bullish | Bearish | Bullish |
| NET POSITION MOVEMENT INDEX: | | | |
| – 6-Week Change in Strength Index: | -19.4 | 19.4 | -3.7 |
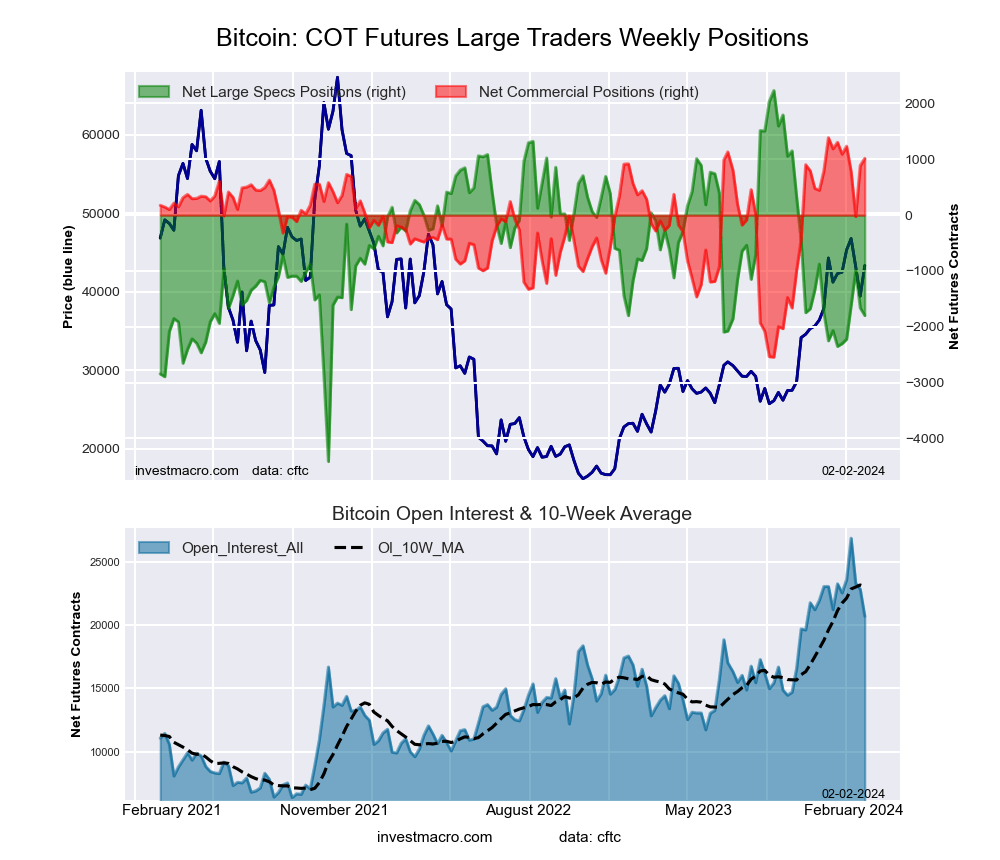
Bitcoin Futures:
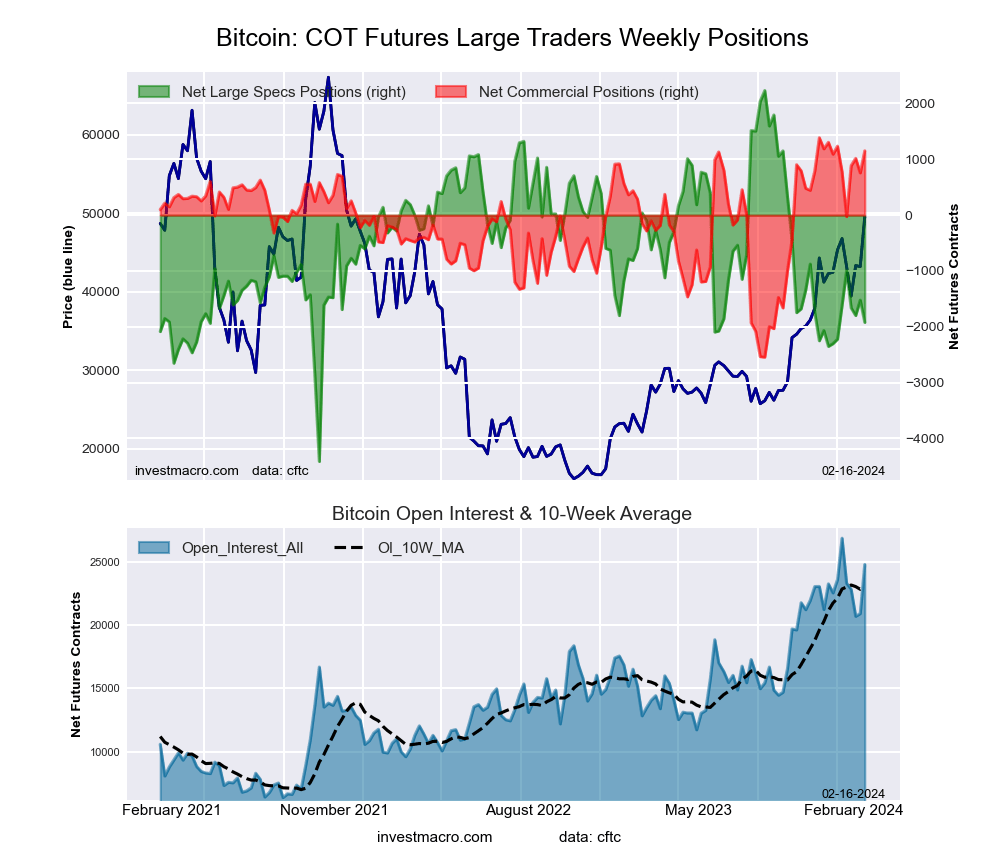 The Bitcoin large speculator standing this week totaled a net position of -1,921 contracts in the data reported through Tuesday. This was a weekly lowering of -398 contracts from the previous week which had a total of -1,523 net contracts.
This week’s current strength score (the trader positioning range over the past three years, measured from 0 to 100) shows the speculators are currently Bearish with a score of 37.5 percent. The commercials are Bullish-Extreme with a score of 94.0 percent and the small traders (not shown in chart) are Bearish with a score of 30.4 percent.
Price Trend-Following Model: Strong Uptrend
Our weekly trend-following model classifies the current market price position as: Strong Uptrend. The current action for the model is considered to be: Hold – Maintain Long Position.
| BITCOIN Statistics | SPECULATORS | COMMERCIALS | SMALL TRADERS |
| – Percent of Open Interest Longs: | 77.3 | 6.1 | 7.0 |
| – Percent of Open Interest Shorts: | 85.1 | 1.5 | 3.9 |
| – Net Position: | -1,921 | 1,152 | 769 |
| – Gross Longs: | 19,147 | 1,514 | 1,725 |
| – Gross Shorts: | 21,068 | 362 | 956 |
| – Long to Short Ratio: | 0.9 to 1 | 4.2 to 1 | 1.8 to 1 |
| NET POSITION TREND: | | | |
| – Strength Index Score (3 Year Range Pct): | 37.5 | 94.0 | 30.4 |
| – Strength Index Reading (3 Year Range): | Bearish | Bullish-Extreme | Bearish |
| NET POSITION MOVEMENT INDEX: | | | |
| – 6-Week Change in Strength Index: | 4.5 | -2.1 | -5.0 |
Article By InvestMacro – Receive our weekly COT Newsletter
*COT Report: The COT data, released weekly to the public each Friday, is updated through the most recent Tuesday (data is 3 days old) and shows a quick view of how large speculators or non-commercials (for-profit traders) were positioned in the futures markets.
The CFTC categorizes trader positions according to commercial hedgers (traders who use futures contracts for hedging as part of the business), non-commercials (large traders who speculate to realize trading profits) and nonreportable traders (usually small traders/speculators) as well as their open interest (contracts open in the market at time of reporting). See CFTC criteria here.


 Cutaway view of a Nissan Leaf electric vehicle showing part of its battery array (silver boxes).


