By InvestMacro
Here are the latest charts and statistics for the Commitment of Traders (COT) data published by the Commodities Futures Trading Commission (CFTC).
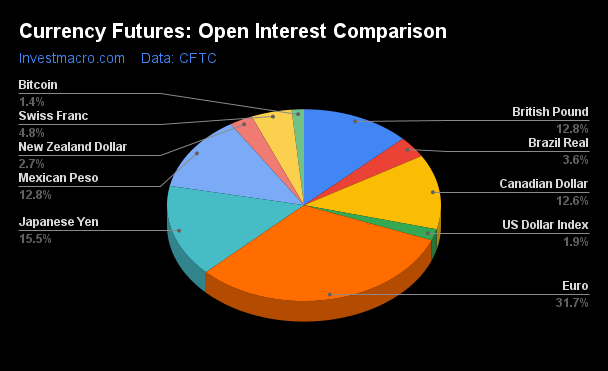
The latest COT data is updated through Tuesday May 28th and shows a quick view of how large market participants (for-profit speculators and commercial traders) were positioned in the futures markets. All currency positions are in direct relation to the US dollar where, for example, a bet for the euro is a bet that the euro will rise versus the dollar while a bet against the euro will be a bet that the euro will decline versus the dollar.
Weekly Speculator Changes led by British Pound & EuroFX
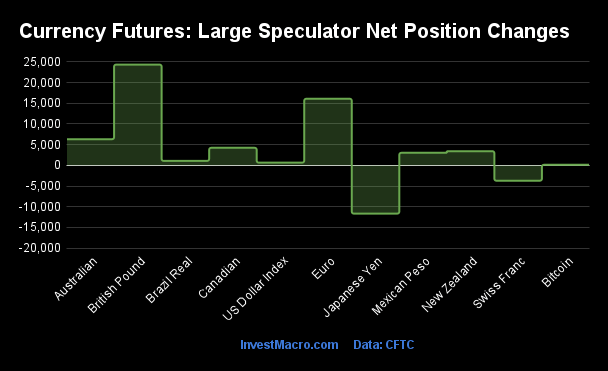
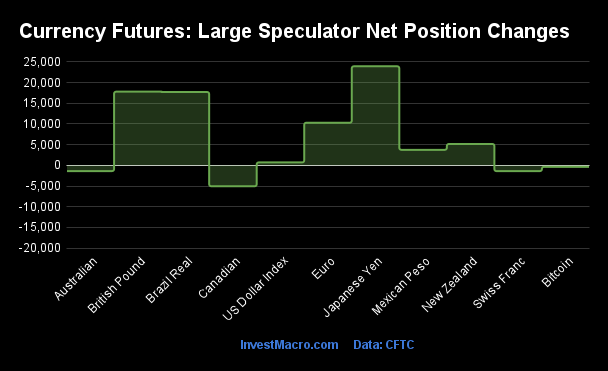
The COT currency market speculator bets were higher this week as nine out of the eleven currency markets we cover had higher positioning while the other two markets had lower speculator contracts.
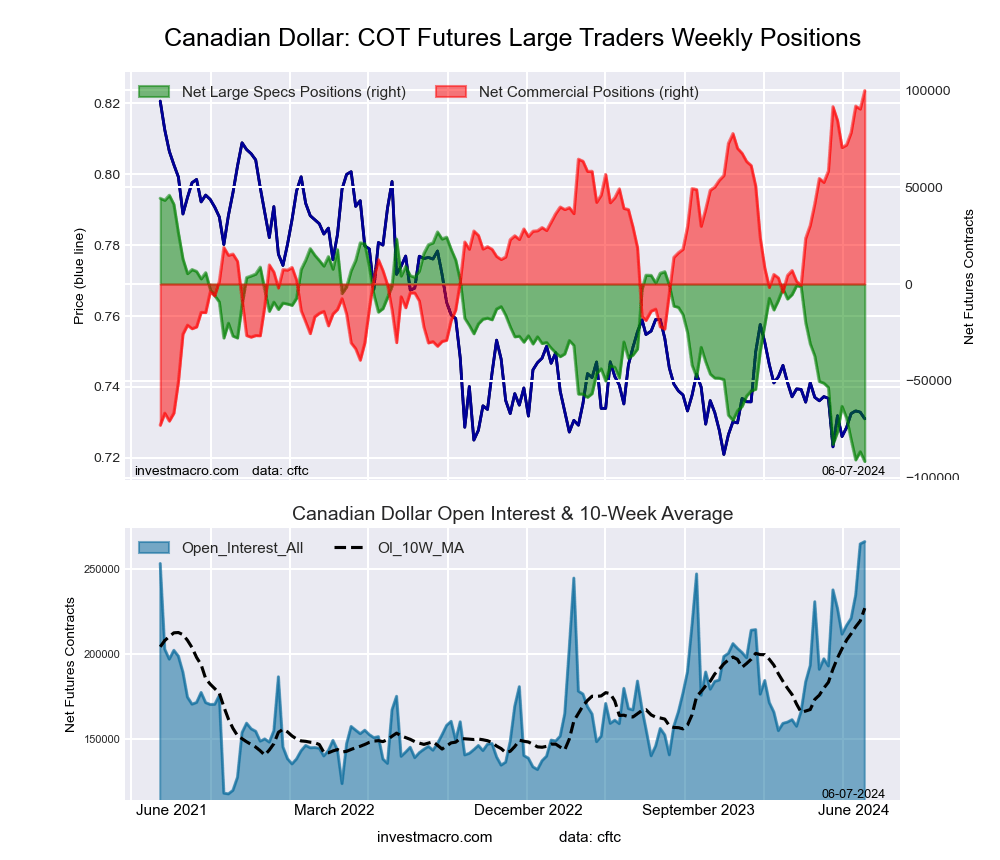
Leading the gains for the currency markets was the British Pound (24,349 contracts), the EuroFX (16,097 contracts), the Australian Dollar (6,317 contracts), Canadian Dollar (4,239 contracts), New Zealand Dollar (3,416 contracts), Mexican Peso (3,027 contracts), the Brazilian Real (1,076 contracts), the US Dollar Index (656 contracts) and with Bitcoin (134 contracts) also having a positive week.
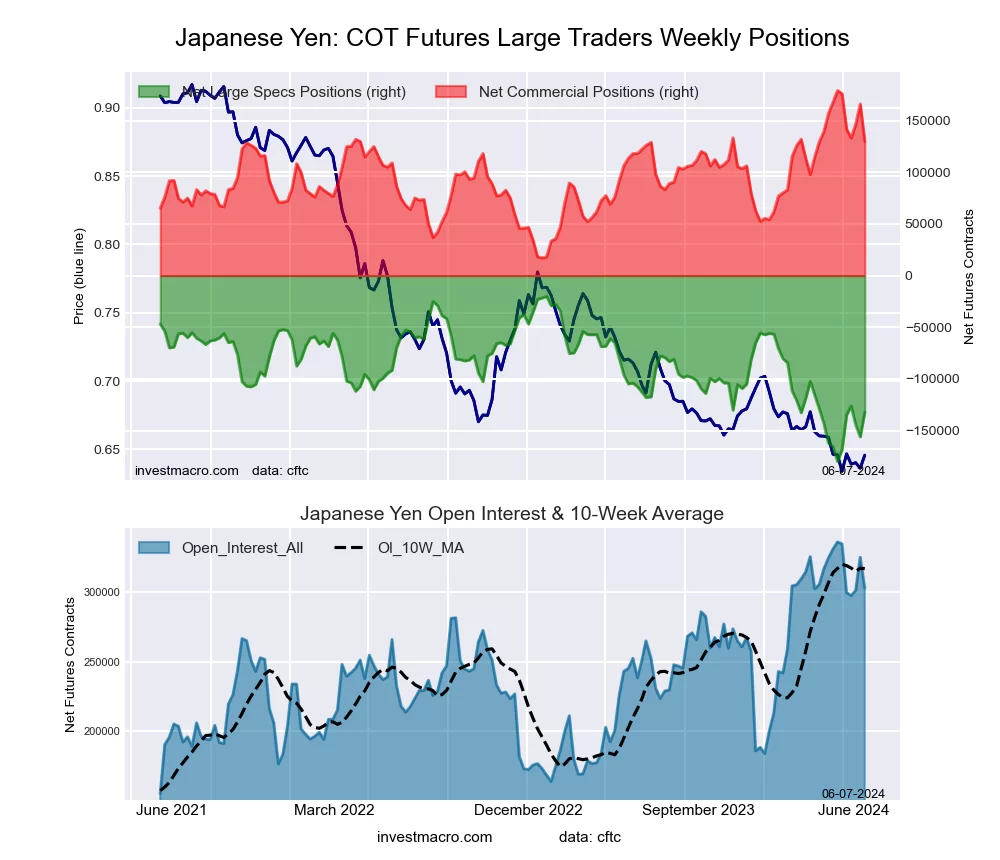
The currencies seeing declines in speculator bets on the week were the Japanese Yen (-11,672 contracts) and the Swiss Franc (-3,721 contracts).
GBP and Euro Speculator bets rise for multiple weeks
To start this week’s COT currency roundup, the Euro positions have continued to improve after the speculator contracts dropped into a bearish position in late-April. This was the first time since September of 2022 that Euro bets had fallen into negative territory. Since then, the Euro speculative bets have risen for five straight weeks and by a total of +67,561 contracts in that period. Euro bets, currently at +57,572 contracts, have now climbed back to the best level in the past eleven weeks, dating back to March 12th. The EURUSD exchange rate still has some work to do as it remains below the 1.10 major resistance area.
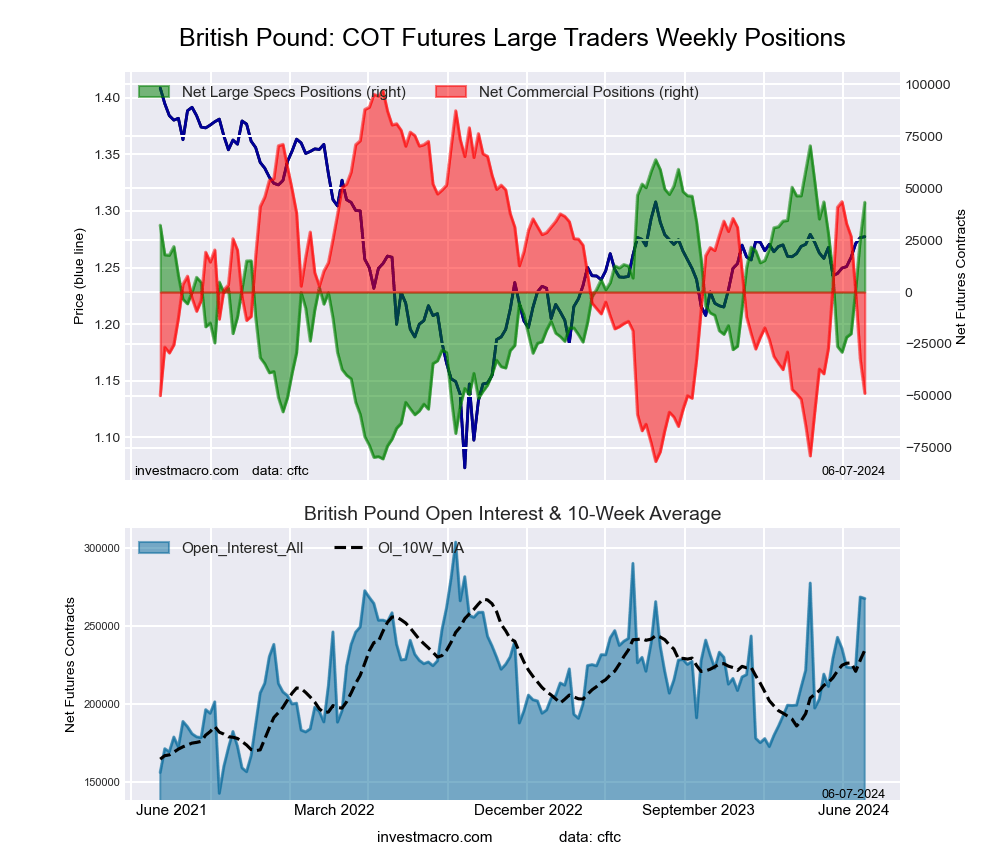
The British pound sterling speculator contracts rose again this week and has jumped by over +20,000 contracts for the second consecutive week. Overall, the GBP bet have now improved for four straight weeks with a gain of +54,392 contracts in the past four weeks. The speculator standing has now come out of a four-week bearish position (April 23rd to May 14th) and is at the highest level since April. The GBPUSD exchange rate has recently hit its highest level since March and is trading around 1.2600 currently. On a trade-weighted basis, Reuters notes that the GBP is near the highest since Brexit.
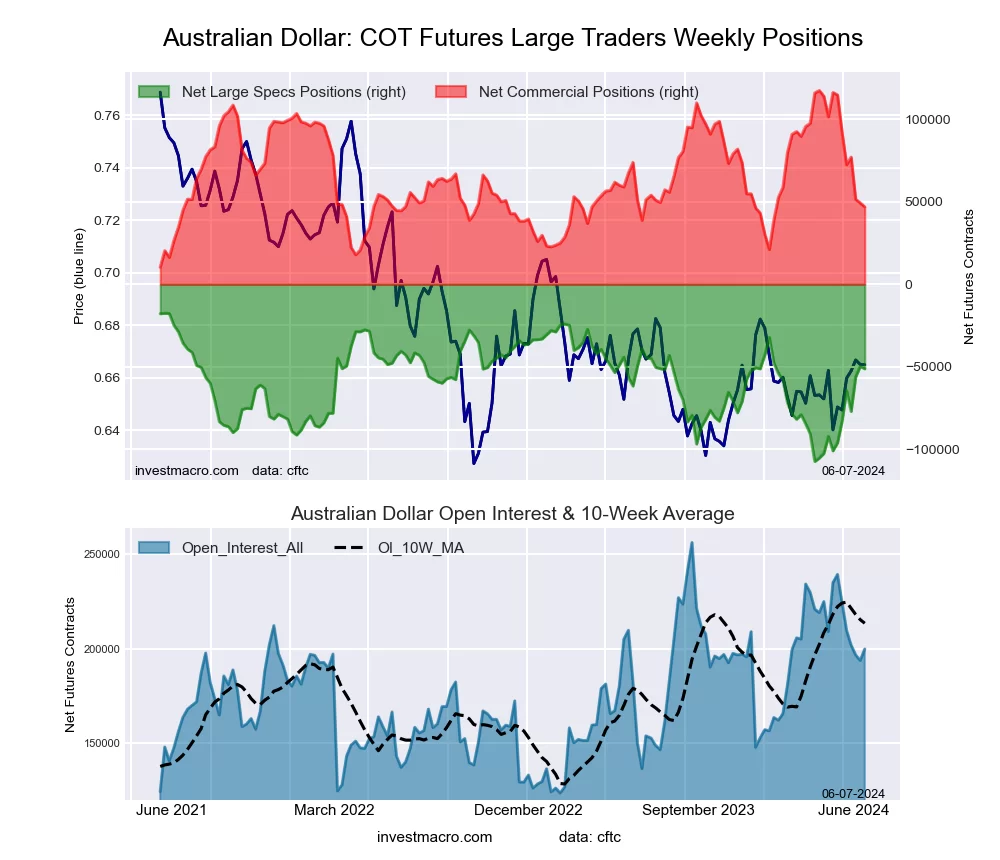
The Australian dollar speculator bets rose this week for a second consecutive week and have now improved in eight out of the past ten weeks. The AUD position has gained a total of +57,622 contracts over the past ten weeks and has brought the level from a record bearish position of -107,538 contracts on March 19th to a total of -49,916 contracts this week. The current standing is the least bearish level in the past nineteen weeks, dating back to January 16th.
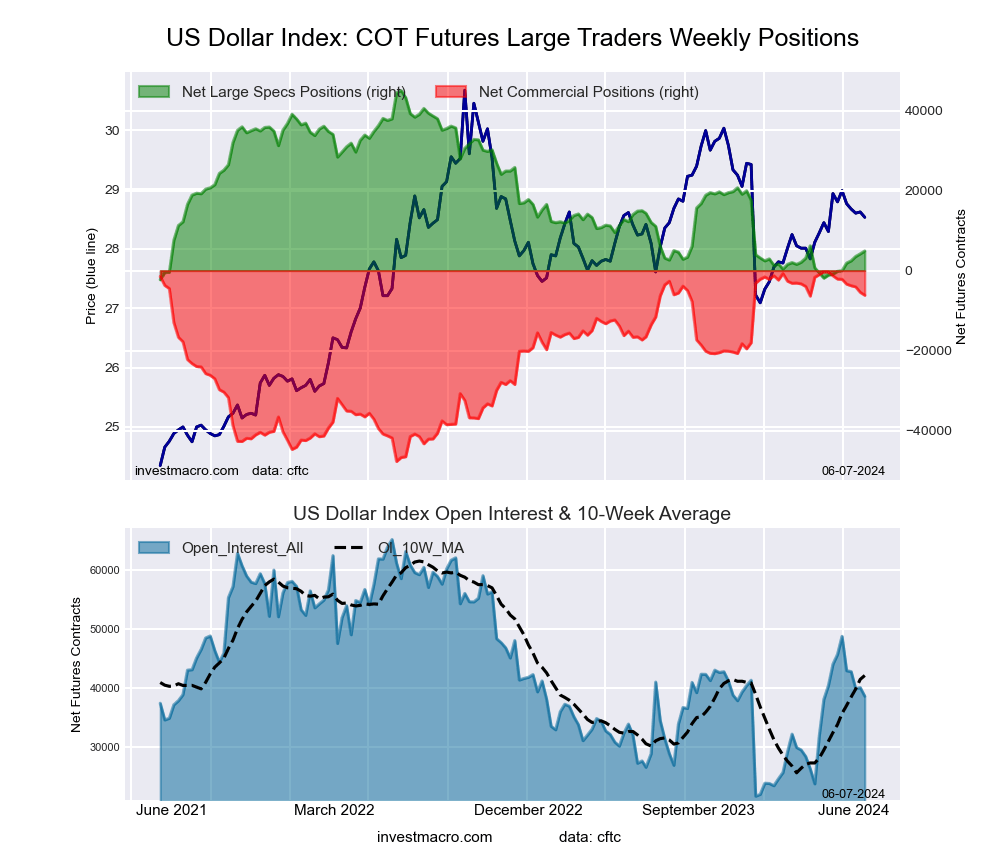
The US dollar index positions increased slightly again this week and have now risen for eight consecutive weeks. The speculator standing had fallen into a bearish position from March 26th to April 30th before coming back over to a bullish level in these past four weeks. That bearish level had marked the first time the USD index bets had been negative since 2021.
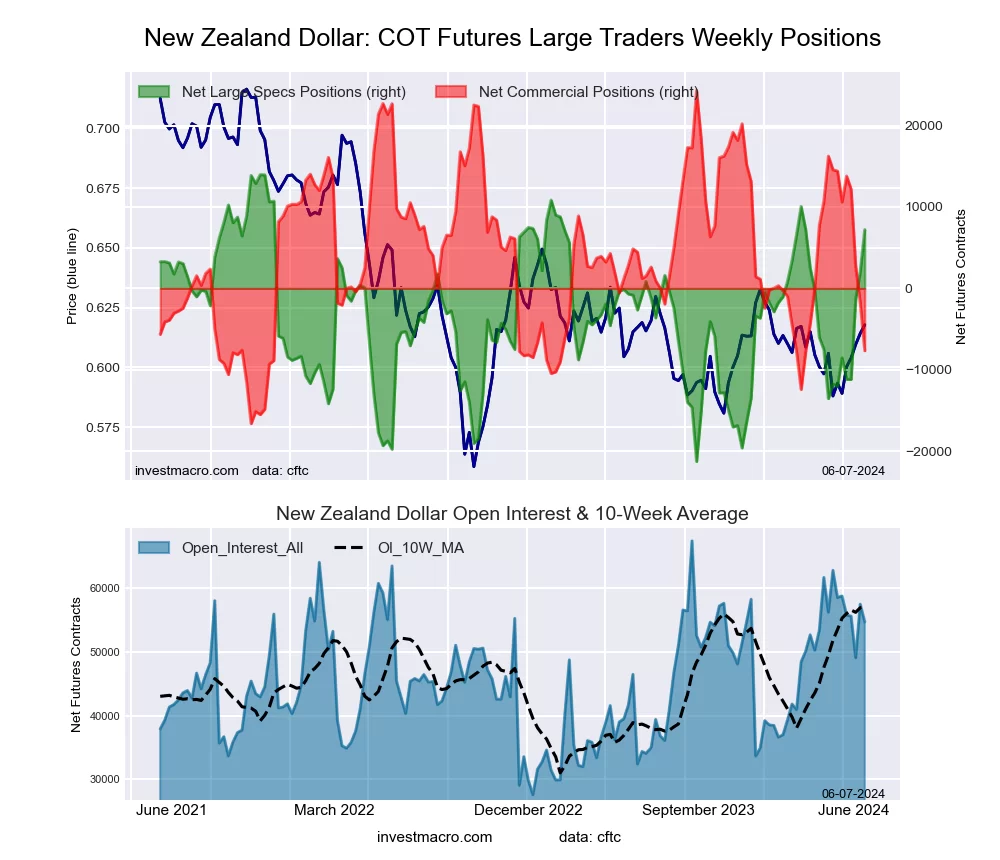
The New Zealand dollar speculator position gained for a second straight week and came out of a bearish level into a bullish position this week. The NZD bets had been bearish or negative for the past ten weeks with a recent bearish high of -12,047 contracts taking place on April 23rd. The NZD positioning has been on a rollercoaster of ups and (mostly) downs since 2021 while the NZDUSD exchange had been on the defensive over that time. However, the exchange rate for the NZD versus the USD has started to see higher lows on the weekly charts and is challenging the downward sloping trendline that started in 2021 – pointing to a possible breakout scenerio.
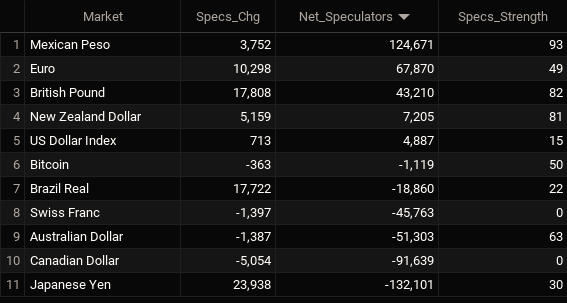
Currencies Net Speculators Leaderboard
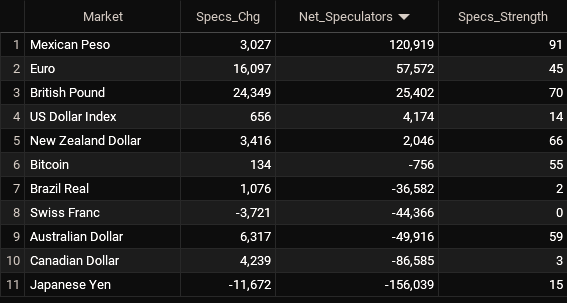
Legend: Weekly Speculators Change | Speculators Current Net Position | Speculators Strength Score compared to last 3-Years (0-100 range)
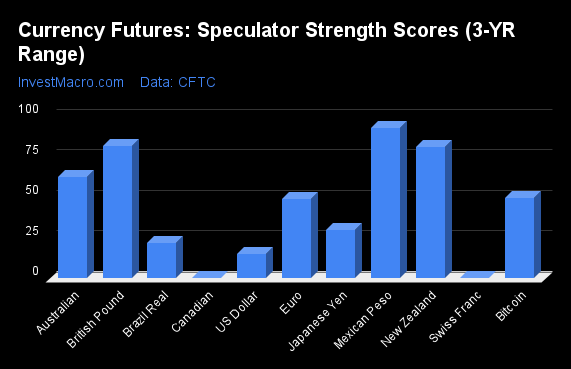
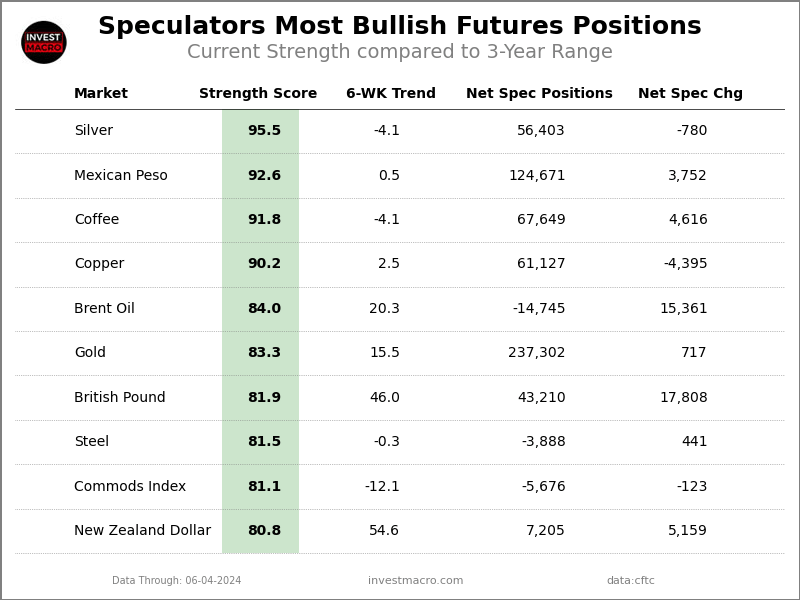
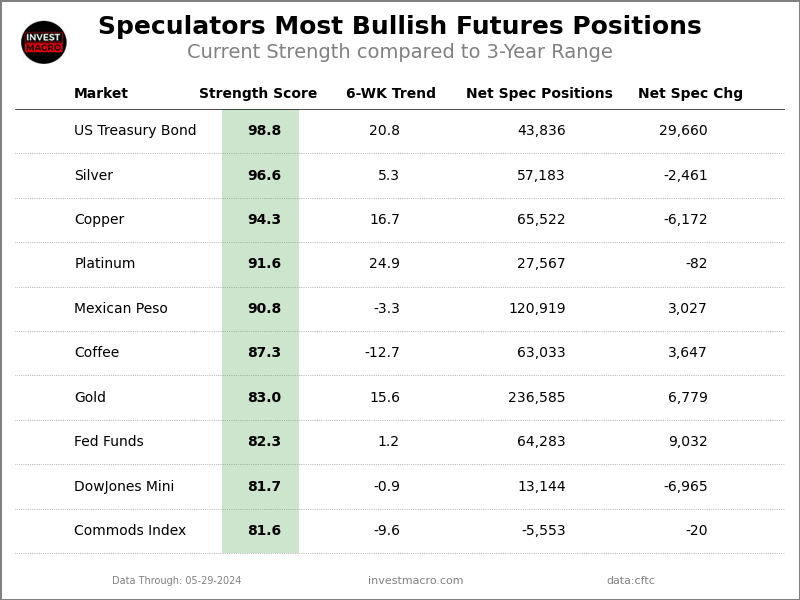
Strength Scores led by Mexican Peso & British Pound
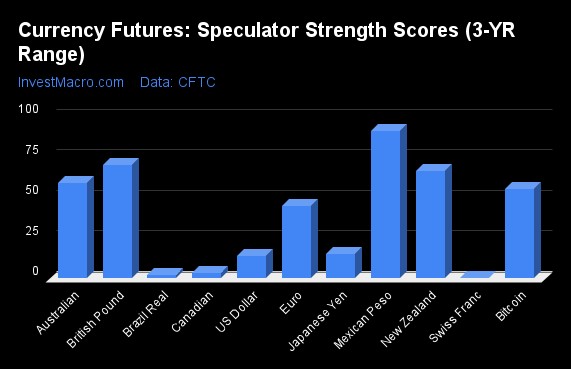
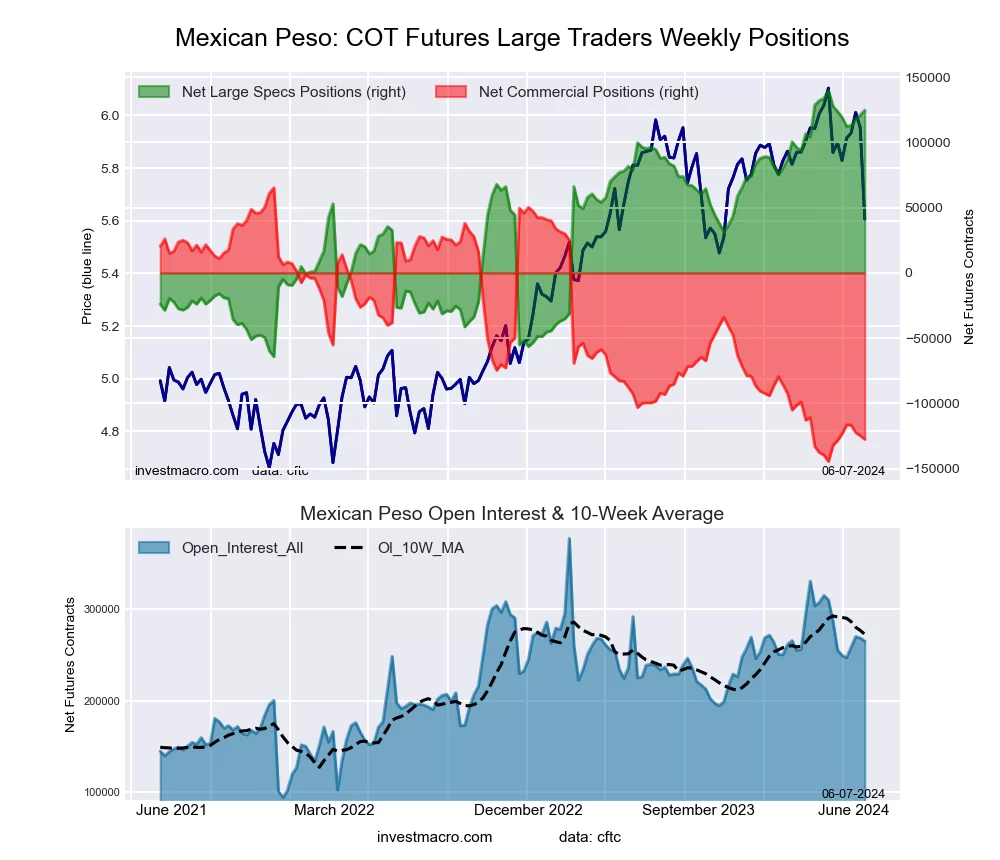
COT Strength Scores (a normalized measure of Speculator positions over a 3-Year range, from 0 to 100 where above 80 is Extreme-Bullish and below 20 is Extreme-Bearish) showed that the Mexican Peso (91 percent) and the British Pound (70 percent) lead the currency markets this week. The New Zealand Dollar (66 percent), Australian Dollar (59 percent) and the Bitcoin (55 percent) come in as the next highest in the weekly strength scores.
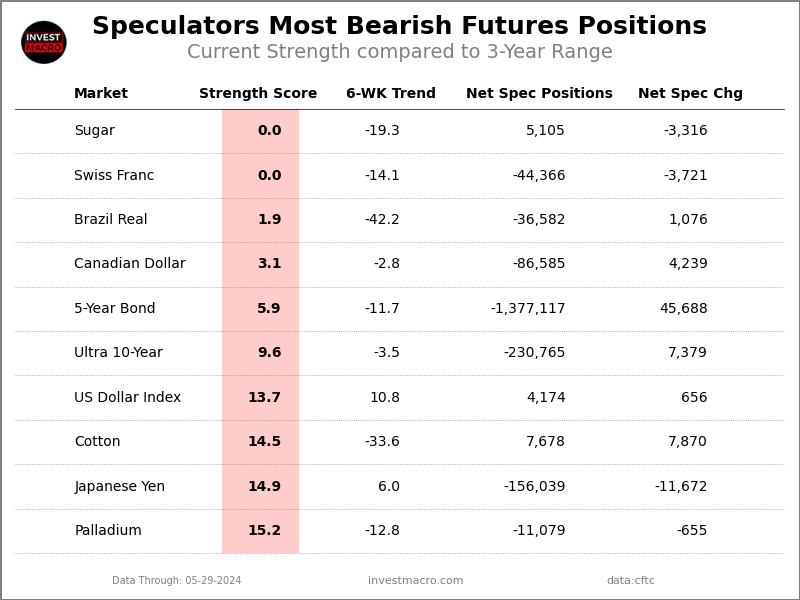
On the downside, the Swiss Franc (0 percent), the Brazilian Real (2 percent), the Canadian Dollar (3 percent), the US Dollar Index (14 percent) and the Japanese Yen (14.9 percent) come in at the lowest strength levels currently and are in Extreme-Bearish territory (below 20 percent).
Strength Statistics:
US Dollar Index (13.7 percent) vs US Dollar Index previous week (12.3 percent)
EuroFX (44.8 percent) vs EuroFX previous week (38.0 percent)
British Pound Sterling (70.1 percent) vs British Pound Sterling previous week (54.0 percent)
Japanese Yen (14.9 percent) vs Japanese Yen previous week (22.2 percent)
Swiss Franc (0.0 percent) vs Swiss Franc previous week (6.4 percent)
Canadian Dollar (3.1 percent) vs Canadian Dollar previous week (0.0 percent)
Australian Dollar (58.7 percent) vs Australian Dollar previous week (52.3 percent)
New Zealand Dollar (66.2 percent) vs New Zealand Dollar previous week (56.5 percent)
Mexican Peso (90.8 percent) vs Mexican Peso previous week (89.3 percent)
Brazilian Real (1.9 percent) vs Brazilian Real previous week (0.7 percent)
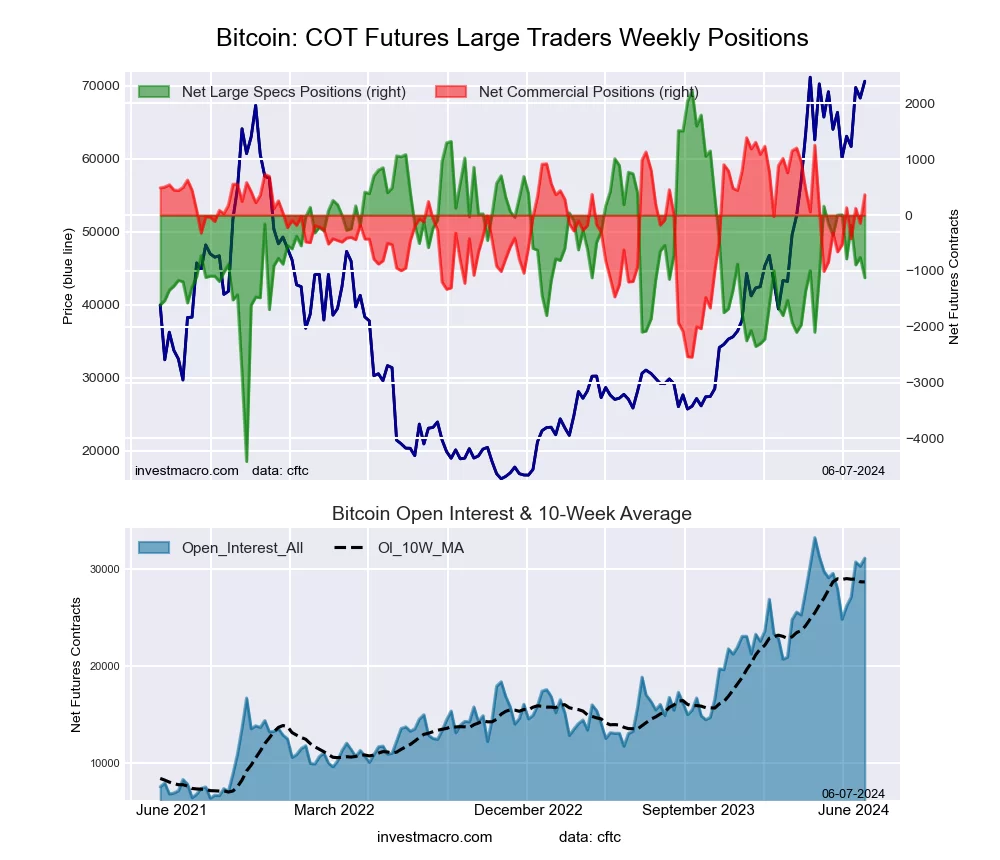
Bitcoin (55.0 percent) vs Bitcoin previous week (53.0 percent)
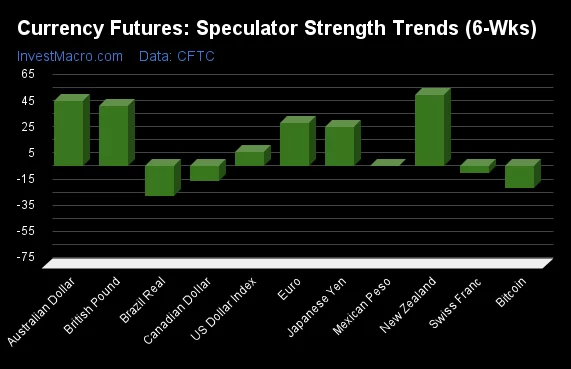
Australian Dollar & New Zealand Dollar top the 6-Week Strength Trends
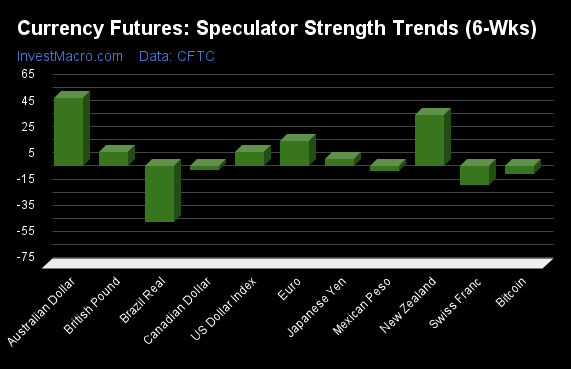
COT Strength Score Trends (or move index, calculates the 6-week changes in strength scores) showed that the Australian Dollar (52 percent) and the New Zealand Dollar (39 percent) lead the past six weeks trends for the currencies. The EuroFX (19 percent), the US Dollar Index (11 percent) and the British Pound (11 percent) are the next highest positive movers in the latest trends data.
The Brazilian Real (-42 percent) leads the downside trend scores currently with the Swiss Franc (-14 percent), Bitcoin (-6 percent) and the Mexican Peso (-3 percent) following next with lower trend scores.
Strength Trend Statistics:
US Dollar Index (10.8 percent) vs US Dollar Index previous week (9.8 percent)
EuroFX (19.3 percent) vs EuroFX previous week (3.7 percent)
British Pound Sterling (11.1 percent) vs British Pound Sterling previous week (-18.0 percent)
Japanese Yen (6.0 percent) vs Japanese Yen previous week (11.1 percent)
Swiss Franc (-14.1 percent) vs Swiss Franc previous week (-15.3 percent)
Canadian Dollar (-2.8 percent) vs Canadian Dollar previous week (-27.4 percent)
Australian Dollar (52.2 percent) vs Australian Dollar previous week (36.8 percent)
New Zealand Dollar (39.1 percent) vs New Zealand Dollar previous week (34.6 percent)
Mexican Peso (-3.3 percent) vs Mexican Peso previous week (-10.7 percent)
Brazilian Real (-42.2 percent) vs Brazilian Real previous week (-39.5 percent)
Bitcoin (-5.9 percent) vs Bitcoin previous week (-11.1 percent)
Individual COT Forex Markets:
US Dollar Index Futures:
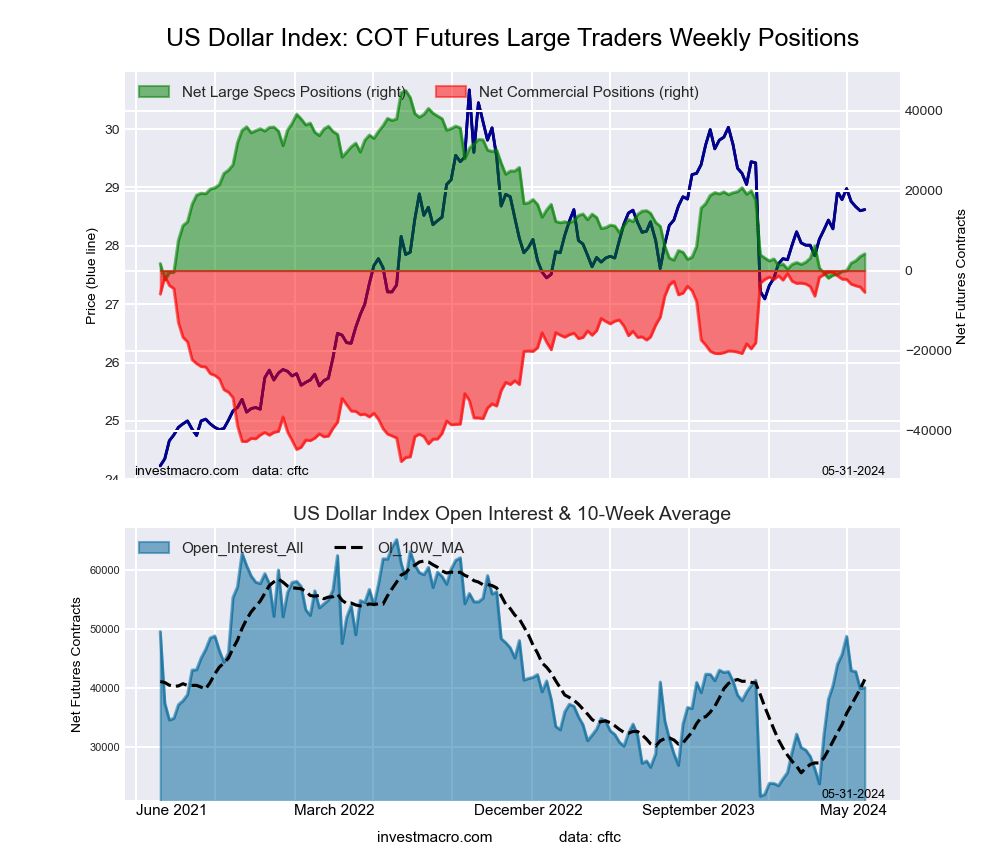 The US Dollar Index large speculator standing this week reached a net position of 4,174 contracts in the data reported through Tuesday. This was a weekly increase of 656 contracts from the previous week which had a total of 3,518 net contracts.
This week’s current strength score (the trader positioning range over the past three years, measured from 0 to 100) shows the speculators are currently Bearish-Extreme with a score of 13.7 percent. The commercials are Bullish-Extreme with a score of 89.2 percent and the small traders (not shown in chart) are Bearish with a score of 25.9 percent.
Price Trend-Following Model: Uptrend
Our weekly trend-following model classifies the current market price position as: Uptrend. The current action for the model is considered to be: Hold – Maintain Long Position.
| US DOLLAR INDEX Statistics | SPECULATORS | COMMERCIALS | SMALL TRADERS |
| – Percent of Open Interest Longs: | 70.6 | 17.5 | 9.0 |
| – Percent of Open Interest Shorts: | 60.2 | 31.1 | 5.9 |
| – Net Position: | 4,174 | -5,436 | 1,262 |
| – Gross Longs: | 28,325 | 7,026 | 3,621 |
| – Gross Shorts: | 24,151 | 12,462 | 2,359 |
| – Long to Short Ratio: | 1.2 to 1 | 0.6 to 1 | 1.5 to 1 |
| NET POSITION TREND: | | | |
| – Strength Index Score (3 Year Range Pct): | 13.7 | 89.2 | 25.9 |
| – Strength Index Reading (3 Year Range): | Bearish-Extreme | Bullish-Extreme | Bearish |
| NET POSITION MOVEMENT INDEX: | | | |
| – 6-Week Change in Strength Index: | 10.8 | -8.7 | -11.4 |
Euro Currency Futures:
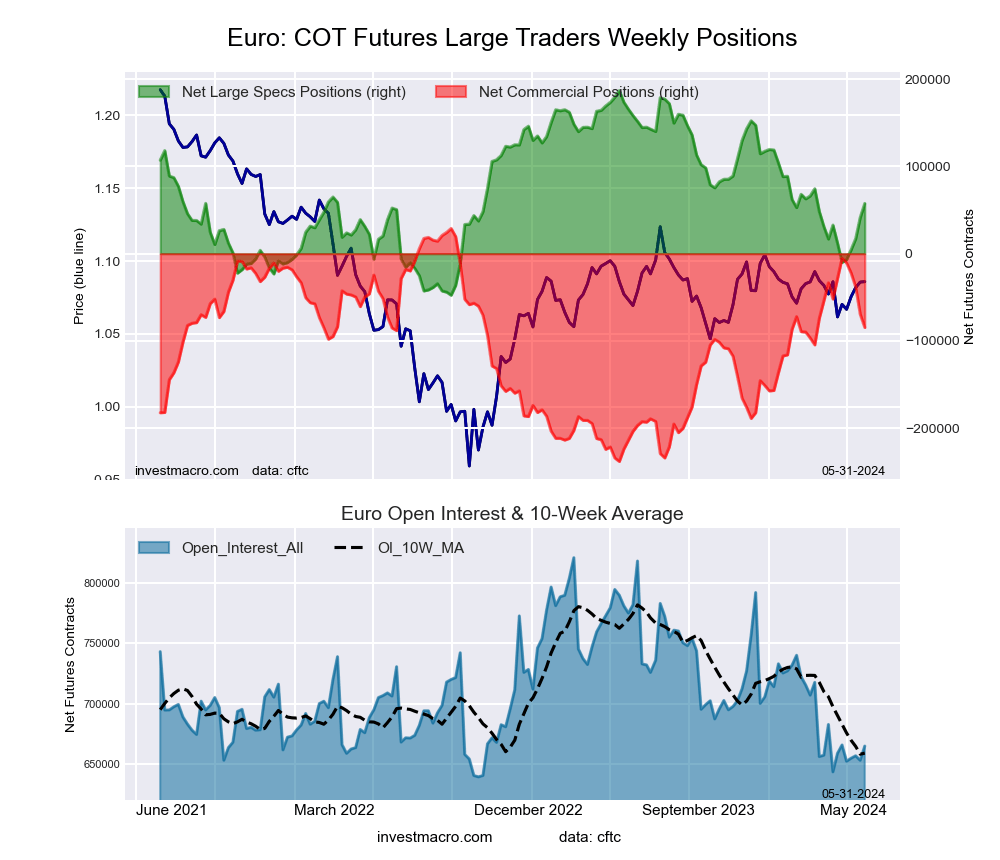 The Euro Currency large speculator standing this week reached a net position of 57,572 contracts in the data reported through Tuesday. This was a weekly gain of 16,097 contracts from the previous week which had a total of 41,475 net contracts.
This week’s current strength score (the trader positioning range over the past three years, measured from 0 to 100) shows the speculators are currently Bearish with a score of 44.8 percent. The commercials are Bullish with a score of 57.5 percent and the small traders (not shown in chart) are Bearish with a score of 22.4 percent.
Price Trend-Following Model: Weak Downtrend
Our weekly trend-following model classifies the current market price position as: Weak Downtrend. The current action for the model is considered to be: Hold – Maintain Short Position.
| EURO Currency Statistics | SPECULATORS | COMMERCIALS | SMALL TRADERS |
| – Percent of Open Interest Longs: | 27.8 | 57.2 | 12.0 |
| – Percent of Open Interest Shorts: | 19.1 | 69.9 | 7.9 |
| – Net Position: | 57,572 | -84,652 | 27,080 |
| – Gross Longs: | 184,656 | 380,224 | 79,849 |
| – Gross Shorts: | 127,084 | 464,876 | 52,769 |
| – Long to Short Ratio: | 1.5 to 1 | 0.8 to 1 | 1.5 to 1 |
| NET POSITION TREND: | | | |
| – Strength Index Score (3 Year Range Pct): | 44.8 | 57.5 | 22.4 |
| – Strength Index Reading (3 Year Range): | Bearish | Bullish | Bearish |
| NET POSITION MOVEMENT INDEX: | | | |
| – 6-Week Change in Strength Index: | 19.3 | -21.0 | 17.1 |
British Pound Sterling Futures:
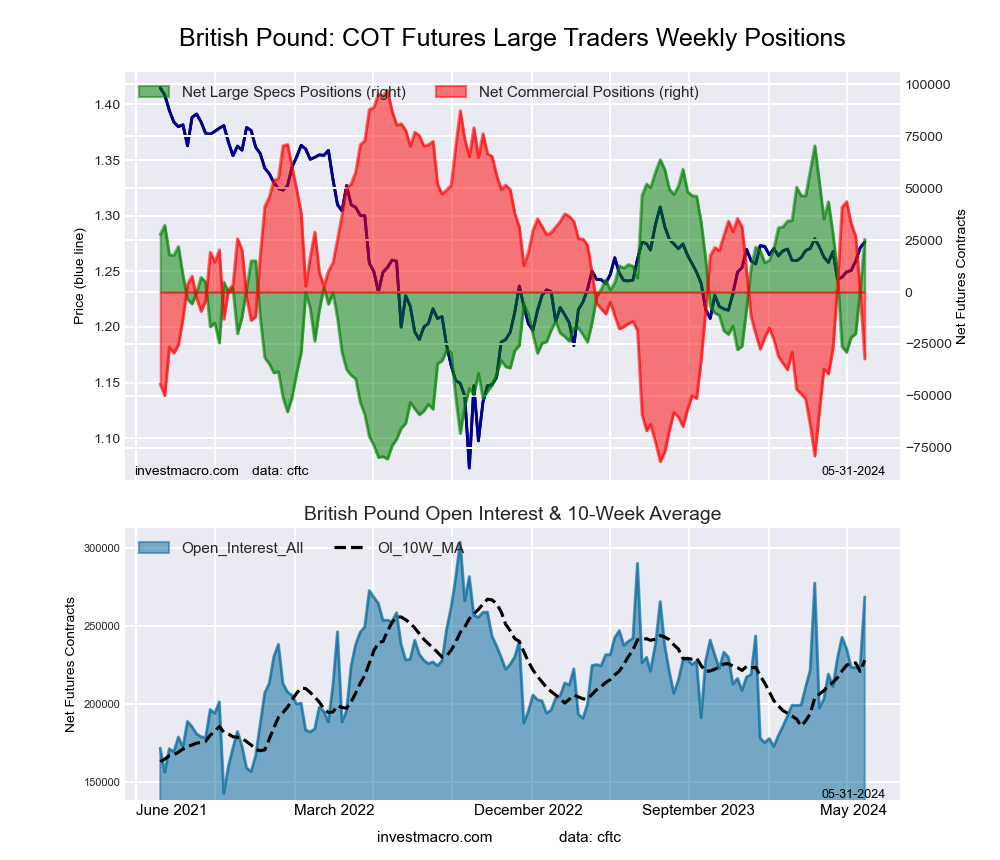 The British Pound Sterling large speculator standing this week reached a net position of 25,402 contracts in the data reported through Tuesday. This was a weekly increase of 24,349 contracts from the previous week which had a total of 1,053 net contracts.
This week’s current strength score (the trader positioning range over the past three years, measured from 0 to 100) shows the speculators are currently Bullish with a score of 70.1 percent. The commercials are Bearish with a score of 27.7 percent and the small traders (not shown in chart) are Bullish with a score of 76.4 percent.
Price Trend-Following Model: Weak Downtrend
Our weekly trend-following model classifies the current market price position as: Weak Downtrend. The current action for the model is considered to be: Hold – Maintain Short Position.
| BRITISH POUND Statistics | SPECULATORS | COMMERCIALS | SMALL TRADERS |
| – Percent of Open Interest Longs: | 34.6 | 43.9 | 12.5 |
| – Percent of Open Interest Shorts: | 25.2 | 55.9 | 10.0 |
| – Net Position: | 25,402 | -32,173 | 6,771 |
| – Gross Longs: | 93,041 | 118,109 | 33,632 |
| – Gross Shorts: | 67,639 | 150,282 | 26,861 |
| – Long to Short Ratio: | 1.4 to 1 | 0.8 to 1 | 1.3 to 1 |
| NET POSITION TREND: | | | |
| – Strength Index Score (3 Year Range Pct): | 70.1 | 27.7 | 76.4 |
| – Strength Index Reading (3 Year Range): | Bullish | Bearish | Bullish |
| NET POSITION MOVEMENT INDEX: | | | |
| – 6-Week Change in Strength Index: | 11.1 | -19.7 | 38.6 |
Japanese Yen Futures:
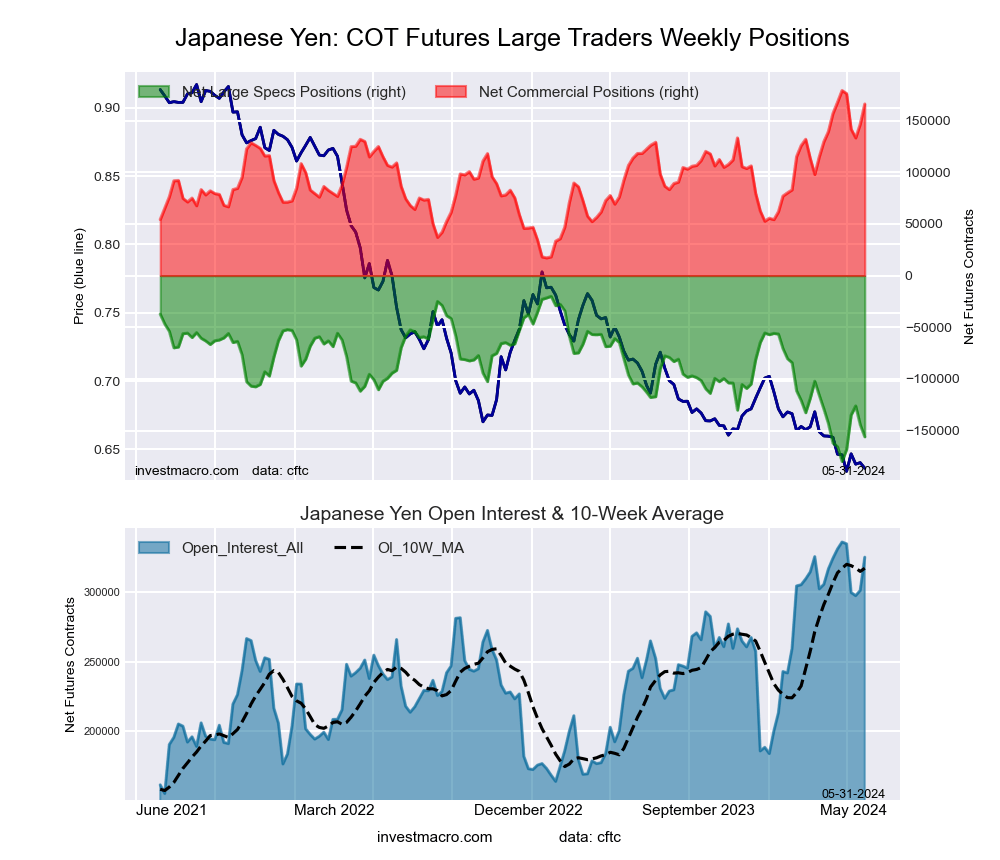 The Japanese Yen large speculator standing this week reached a net position of -156,039 contracts in the data reported through Tuesday. This was a weekly decrease of -11,672 contracts from the previous week which had a total of -144,367 net contracts.
This week’s current strength score (the trader positioning range over the past three years, measured from 0 to 100) shows the speculators are currently Bearish-Extreme with a score of 14.9 percent. The commercials are Bullish-Extreme with a score of 92.0 percent and the small traders (not shown in chart) are Bullish with a score of 50.9 percent.
Price Trend-Following Model: Strong Downtrend
Our weekly trend-following model classifies the current market price position as: Strong Downtrend. The current action for the model is considered to be: Hold – Maintain Short Position.
| JAPANESE YEN Statistics | SPECULATORS | COMMERCIALS | SMALL TRADERS |
| – Percent of Open Interest Longs: | 8.8 | 75.9 | 13.0 |
| – Percent of Open Interest Shorts: | 56.8 | 24.8 | 16.1 |
| – Net Position: | -156,039 | 166,122 | -10,083 |
| – Gross Longs: | 28,565 | 246,911 | 42,324 |
| – Gross Shorts: | 184,604 | 80,789 | 52,407 |
| – Long to Short Ratio: | 0.2 to 1 | 3.1 to 1 | 0.8 to 1 |
| NET POSITION TREND: | | | |
| – Strength Index Score (3 Year Range Pct): | 14.9 | 92.0 | 50.9 |
| – Strength Index Reading (3 Year Range): | Bearish-Extreme | Bullish-Extreme | Bullish |
| NET POSITION MOVEMENT INDEX: | | | |
| – 6-Week Change in Strength Index: | 6.0 | -1.0 | -25.0 |
Swiss Franc Futures:
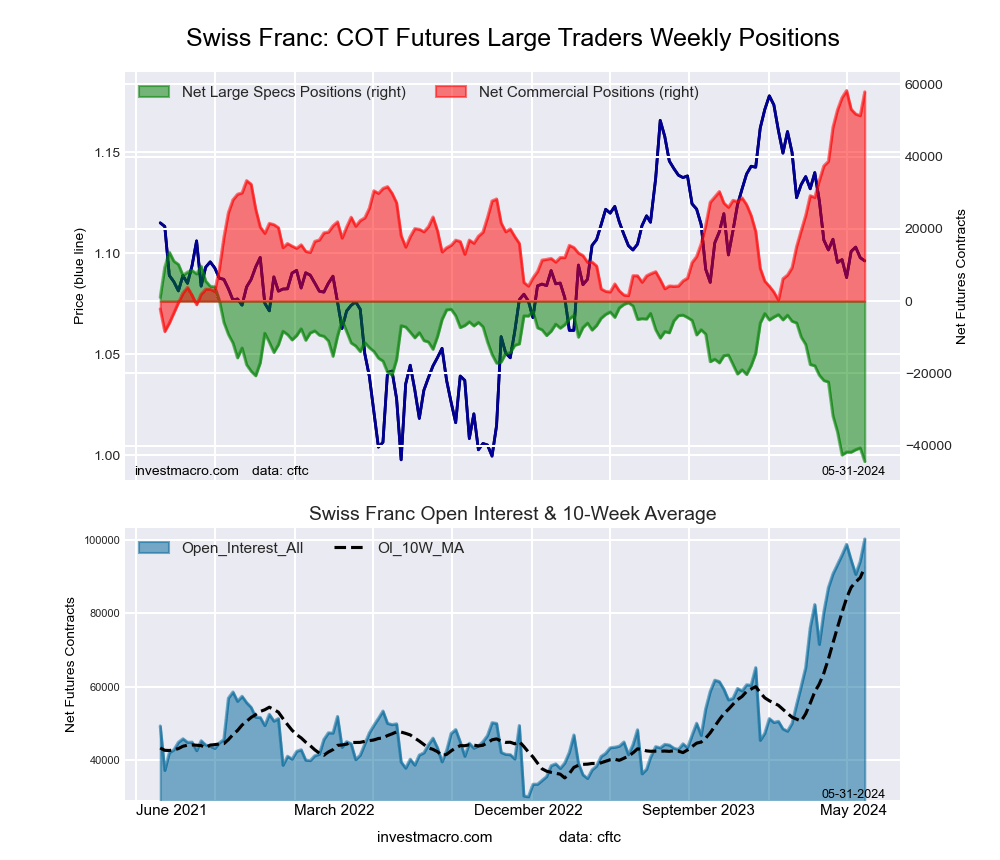 The Swiss Franc large speculator standing this week reached a net position of -44,366 contracts in the data reported through Tuesday. This was a weekly lowering of -3,721 contracts from the previous week which had a total of -40,645 net contracts.
This week’s current strength score (the trader positioning range over the past three years, measured from 0 to 100) shows the speculators are currently Bearish-Extreme with a score of 0.0 percent. The commercials are Bullish-Extreme with a score of 99.5 percent and the small traders (not shown in chart) are Bearish-Extreme with a score of 15.5 percent.
Price Trend-Following Model: Downtrend
Our weekly trend-following model classifies the current market price position as: Downtrend. The current action for the model is considered to be: Hold – Maintain Short Position.
| SWISS FRANC Statistics | SPECULATORS | COMMERCIALS | SMALL TRADERS |
| – Percent of Open Interest Longs: | 8.9 | 80.7 | 9.5 |
| – Percent of Open Interest Shorts: | 53.1 | 23.0 | 23.0 |
| – Net Position: | -44,366 | 57,936 | -13,570 |
| – Gross Longs: | 8,943 | 80,998 | 9,553 |
| – Gross Shorts: | 53,309 | 23,062 | 23,123 |
| – Long to Short Ratio: | 0.2 to 1 | 3.5 to 1 | 0.4 to 1 |
| NET POSITION TREND: | | | |
| – Strength Index Score (3 Year Range Pct): | 0.0 | 99.5 | 15.5 |
| – Strength Index Reading (3 Year Range): | Bearish-Extreme | Bullish-Extreme | Bearish-Extreme |
| NET POSITION MOVEMENT INDEX: | | | |
| – 6-Week Change in Strength Index: | -14.1 | 7.5 | 14.4 |
Canadian Dollar Futures:
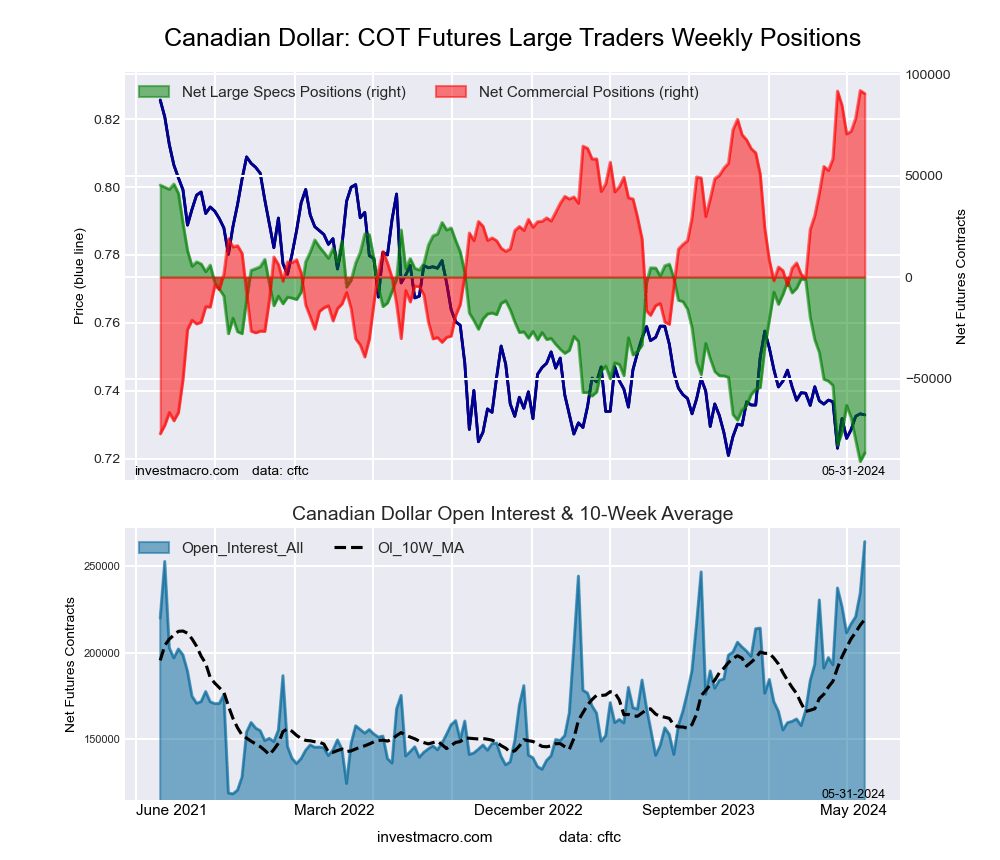 The Canadian Dollar large speculator standing this week reached a net position of -86,585 contracts in the data reported through Tuesday. This was a weekly boost of 4,239 contracts from the previous week which had a total of -90,824 net contracts.
This week’s current strength score (the trader positioning range over the past three years, measured from 0 to 100) shows the speculators are currently Bearish-Extreme with a score of 3.1 percent. The commercials are Bullish-Extreme with a score of 99.1 percent and the small traders (not shown in chart) are Bearish-Extreme with a score of 15.4 percent.
Price Trend-Following Model: Downtrend
Our weekly trend-following model classifies the current market price position as: Downtrend. The current action for the model is considered to be: Hold – Maintain Short Position.
| CANADIAN DOLLAR Statistics | SPECULATORS | COMMERCIALS | SMALL TRADERS |
| – Percent of Open Interest Longs: | 14.1 | 71.8 | 11.1 |
| – Percent of Open Interest Shorts: | 46.9 | 37.6 | 12.5 |
| – Net Position: | -86,585 | 90,353 | -3,768 |
| – Gross Longs: | 37,299 | 189,745 | 29,401 |
| – Gross Shorts: | 123,884 | 99,392 | 33,169 |
| – Long to Short Ratio: | 0.3 to 1 | 1.9 to 1 | 0.9 to 1 |
| NET POSITION TREND: | | | |
| – Strength Index Score (3 Year Range Pct): | 3.1 | 99.1 | 15.4 |
| – Strength Index Reading (3 Year Range): | Bearish-Extreme | Bullish-Extreme | Bearish-Extreme |
| NET POSITION MOVEMENT INDEX: | | | |
| – 6-Week Change in Strength Index: | -2.8 | -0.7 | 11.8 |
Australian Dollar Futures:
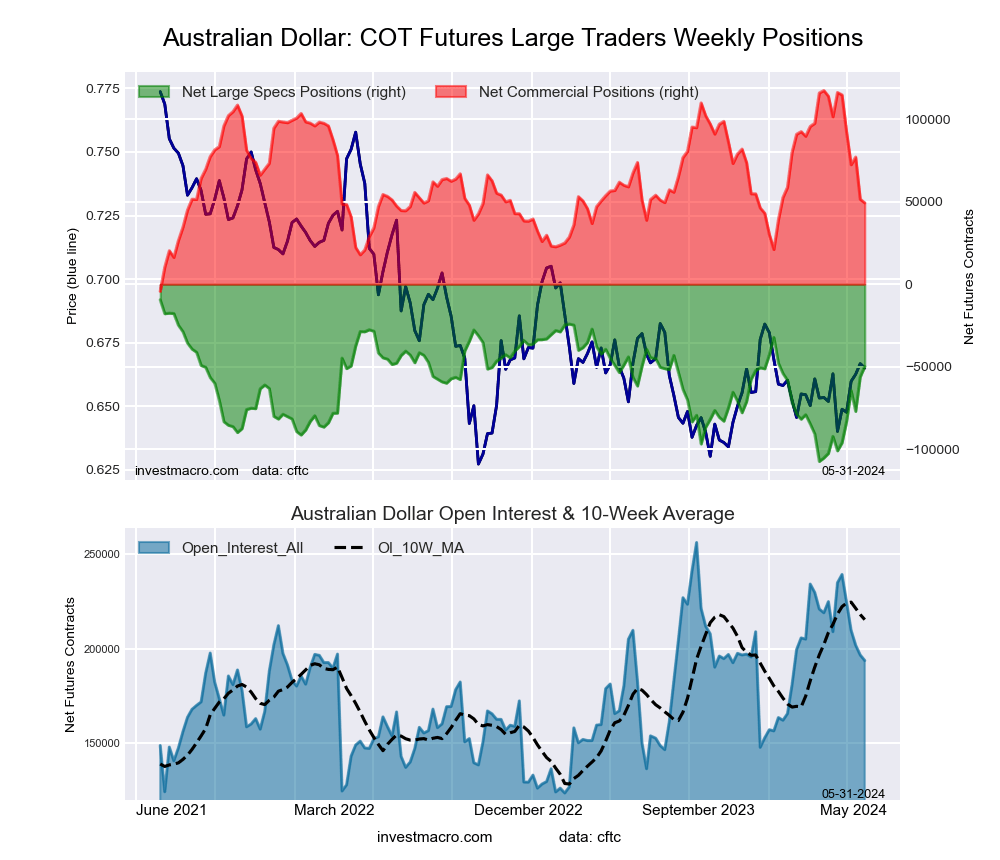 The Australian Dollar large speculator standing this week reached a net position of -49,916 contracts in the data reported through Tuesday. This was a weekly rise of 6,317 contracts from the previous week which had a total of -56,233 net contracts.
This week’s current strength score (the trader positioning range over the past three years, measured from 0 to 100) shows the speculators are currently Bullish with a score of 58.7 percent. The commercials are Bearish with a score of 44.0 percent and the small traders (not shown in chart) are Bullish with a score of 60.1 percent.
Price Trend-Following Model: Strong Uptrend
Our weekly trend-following model classifies the current market price position as: Strong Uptrend. The current action for the model is considered to be: New Buy – Long Position.
| AUSTRALIAN DOLLAR Statistics | SPECULATORS | COMMERCIALS | SMALL TRADERS |
| – Percent of Open Interest Longs: | 27.8 | 57.9 | 12.6 |
| – Percent of Open Interest Shorts: | 53.6 | 32.5 | 12.3 |
| – Net Position: | -49,916 | 49,360 | 556 |
| – Gross Longs: | 53,892 | 112,209 | 24,416 |
| – Gross Shorts: | 103,808 | 62,849 | 23,860 |
| – Long to Short Ratio: | 0.5 to 1 | 1.8 to 1 | 1.0 to 1 |
| NET POSITION TREND: | | | |
| – Strength Index Score (3 Year Range Pct): | 58.7 | 44.0 | 60.1 |
| – Strength Index Reading (3 Year Range): | Bullish | Bearish | Bullish |
| NET POSITION MOVEMENT INDEX: | | | |
| – 6-Week Change in Strength Index: | 52.2 | -55.0 | 43.1 |
New Zealand Dollar Futures:
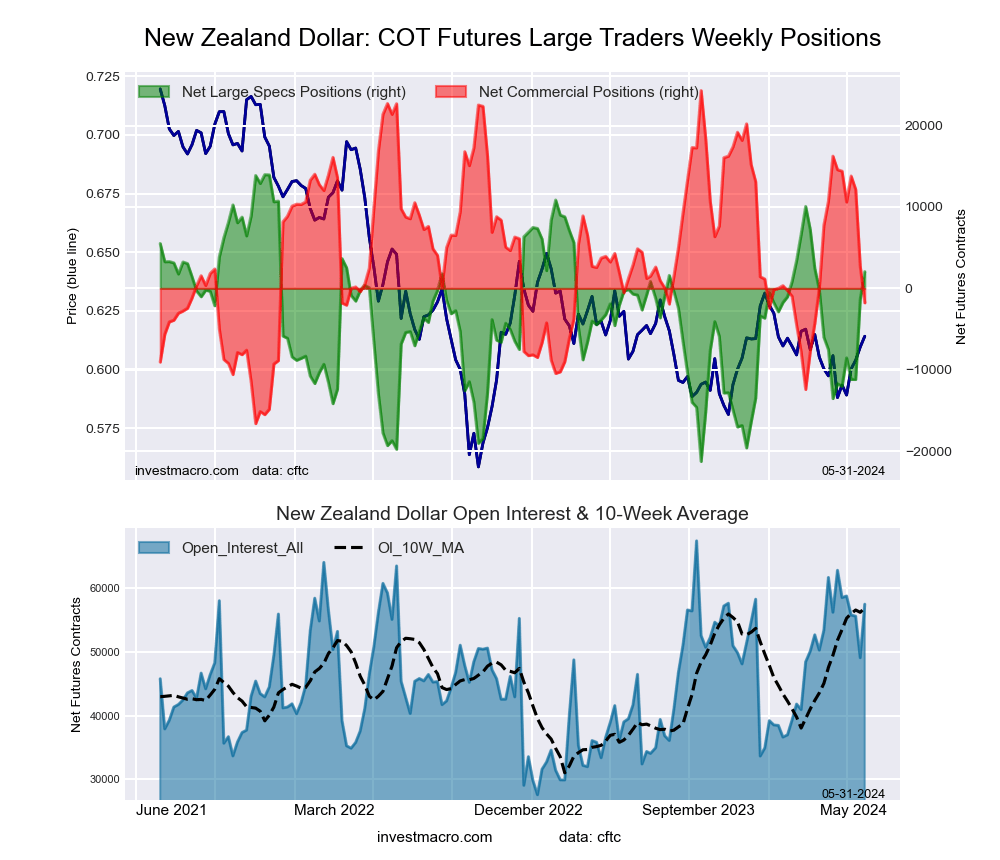 The New Zealand Dollar large speculator standing this week reached a net position of 2,046 contracts in the data reported through Tuesday. This was a weekly lift of 3,416 contracts from the previous week which had a total of -1,370 net contracts.
This week’s current strength score (the trader positioning range over the past three years, measured from 0 to 100) shows the speculators are currently Bullish with a score of 66.2 percent. The commercials are Bearish with a score of 36.3 percent and the small traders (not shown in chart) are Bullish with a score of 50.7 percent.
Price Trend-Following Model: Weak Downtrend
Our weekly trend-following model classifies the current market price position as: Weak Downtrend. The current action for the model is considered to be: Hold – Maintain Short Position.
| NEW ZEALAND DOLLAR Statistics | SPECULATORS | COMMERCIALS | SMALL TRADERS |
| – Percent of Open Interest Longs: | 46.8 | 43.5 | 6.4 |
| – Percent of Open Interest Shorts: | 43.2 | 46.6 | 6.9 |
| – Net Position: | 2,046 | -1,779 | -267 |
| – Gross Longs: | 26,916 | 25,013 | 3,687 |
| – Gross Shorts: | 24,870 | 26,792 | 3,954 |
| – Long to Short Ratio: | 1.1 to 1 | 0.9 to 1 | 0.9 to 1 |
| NET POSITION TREND: | | | |
| – Strength Index Score (3 Year Range Pct): | 66.2 | 36.3 | 50.7 |
| – Strength Index Reading (3 Year Range): | Bullish | Bearish | Bullish |
| NET POSITION MOVEMENT INDEX: | | | |
| – 6-Week Change in Strength Index: | 39.1 | -39.9 | 33.2 |
Mexican Peso Futures:
 The Mexican Peso large speculator standing this week reached a net position of 120,919 contracts in the data reported through Tuesday. This was a weekly gain of 3,027 contracts from the previous week which had a total of 117,892 net contracts.
This week’s current strength score (the trader positioning range over the past three years, measured from 0 to 100) shows the speculators are currently Bullish-Extreme with a score of 90.8 percent. The commercials are Bearish-Extreme with a score of 9.4 percent and the small traders (not shown in chart) are Bearish with a score of 35.3 percent.
Price Trend-Following Model: Weak Uptrend
Our weekly trend-following model classifies the current market price position as: Weak Uptrend. The current action for the model is considered to be: Hold – Maintain Long Position.
| MEXICAN PESO Statistics | SPECULATORS | COMMERCIALS | SMALL TRADERS |
| – Percent of Open Interest Longs: | 56.5 | 39.8 | 2.7 |
| – Percent of Open Interest Shorts: | 11.4 | 86.3 | 1.2 |
| – Net Position: | 120,919 | -124,698 | 3,779 |
| – Gross Longs: | 151,468 | 106,742 | 7,111 |
| – Gross Shorts: | 30,549 | 231,440 | 3,332 |
| – Long to Short Ratio: | 5.0 to 1 | 0.5 to 1 | 2.1 to 1 |
| NET POSITION TREND: | | | |
| – Strength Index Score (3 Year Range Pct): | 90.8 | 9.4 | 35.3 |
| – Strength Index Reading (3 Year Range): | Bullish-Extreme | Bearish-Extreme | Bearish |
| NET POSITION MOVEMENT INDEX: | | | |
| – 6-Week Change in Strength Index: | -3.3 | 3.5 | -3.9 |
Brazilian Real Futures:
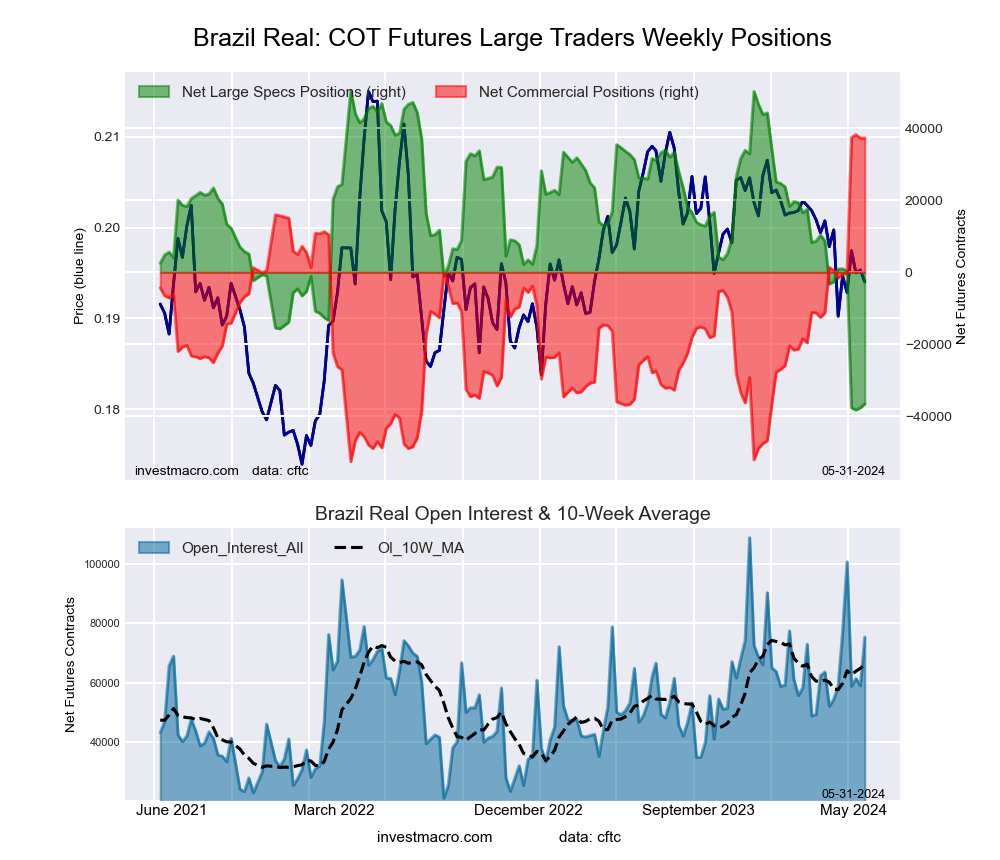 The Brazilian Real large speculator standing this week reached a net position of -36,582 contracts in the data reported through Tuesday. This was a weekly rise of 1,076 contracts from the previous week which had a total of -37,658 net contracts.
This week’s current strength score (the trader positioning range over the past three years, measured from 0 to 100) shows the speculators are currently Bearish-Extreme with a score of 1.9 percent. The commercials are Bullish-Extreme with a score of 99.0 percent and the small traders (not shown in chart) are Bearish with a score of 27.7 percent.
Price Trend-Following Model: Strong Downtrend
Our weekly trend-following model classifies the current market price position as: Strong Downtrend. The current action for the model is considered to be: Hold – Maintain Short Position.
| BRAZIL REAL Statistics | SPECULATORS | COMMERCIALS | SMALL TRADERS |
| – Percent of Open Interest Longs: | 9.2 | 79.1 | 2.9 |
| – Percent of Open Interest Shorts: | 57.8 | 29.6 | 3.9 |
| – Net Position: | -36,582 | 37,302 | -720 |
| – Gross Longs: | 6,940 | 59,601 | 2,182 |
| – Gross Shorts: | 43,522 | 22,299 | 2,902 |
| – Long to Short Ratio: | 0.2 to 1 | 2.7 to 1 | 0.8 to 1 |
| NET POSITION TREND: | | | |
| – Strength Index Score (3 Year Range Pct): | 1.9 | 99.0 | 27.7 |
| – Strength Index Reading (3 Year Range): | Bearish-Extreme | Bullish-Extreme | Bearish |
| NET POSITION MOVEMENT INDEX: | | | |
| – 6-Week Change in Strength Index: | -42.2 | 42.8 | -13.3 |
Bitcoin Futures:
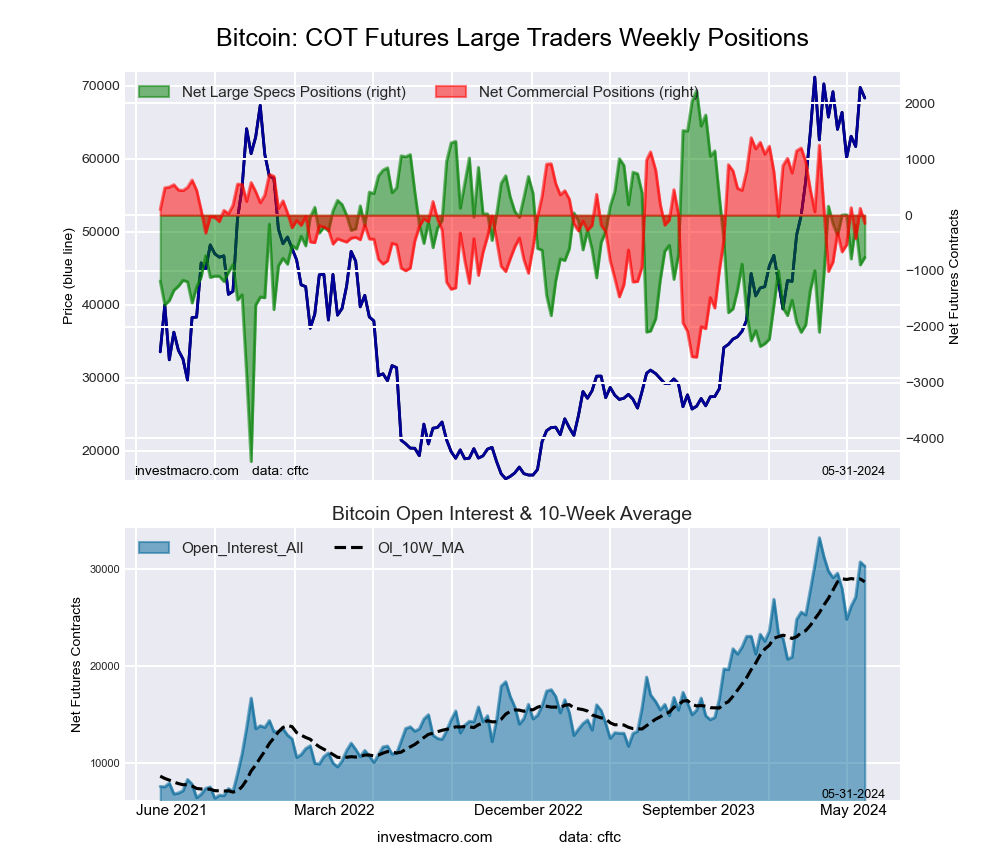 The Bitcoin large speculator standing this week reached a net position of -756 contracts in the data reported through Tuesday. This was a weekly gain of 134 contracts from the previous week which had a total of -890 net contracts.
This week’s current strength score (the trader positioning range over the past three years, measured from 0 to 100) shows the speculators are currently Bullish with a score of 55.0 percent. The commercials are Bullish with a score of 60.9 percent and the small traders (not shown in chart) are Bearish with a score of 33.5 percent.
Price Trend-Following Model: Uptrend
Our weekly trend-following model classifies the current market price position as: Uptrend. The current action for the model is considered to be: Hold – Maintain Long Position.
| BITCOIN Statistics | SPECULATORS | COMMERCIALS | SMALL TRADERS |
| – Percent of Open Interest Longs: | 75.2 | 4.0 | 5.8 |
| – Percent of Open Interest Shorts: | 77.7 | 4.5 | 2.8 |
| – Net Position: | -756 | -148 | 904 |
| – Gross Longs: | 22,761 | 1,214 | 1,763 |
| – Gross Shorts: | 23,517 | 1,362 | 859 |
| – Long to Short Ratio: | 1.0 to 1 | 0.9 to 1 | 2.1 to 1 |
| NET POSITION TREND: | | | |
| – Strength Index Score (3 Year Range Pct): | 55.0 | 60.9 | 33.5 |
| – Strength Index Reading (3 Year Range): | Bullish | Bullish | Bearish |
| NET POSITION MOVEMENT INDEX: | | | |
| – 6-Week Change in Strength Index: | -5.9 | 4.2 | 5.2 |
Article By InvestMacro – Receive our weekly COT Newsletter
*COT Report: The COT data, released weekly to the public each Friday, is updated through the most recent Tuesday (data is 3 days old) and shows a quick view of how large speculators or non-commercials (for-profit traders) were positioned in the futures markets.
The CFTC categorizes trader positions according to commercial hedgers (traders who use futures contracts for hedging as part of the business), non-commercials (large traders who speculate to realize trading profits) and nonreportable traders (usually small traders/speculators) as well as their open interest (contracts open in the market at time of reporting). See CFTC criteria here.


