By InvestMacro
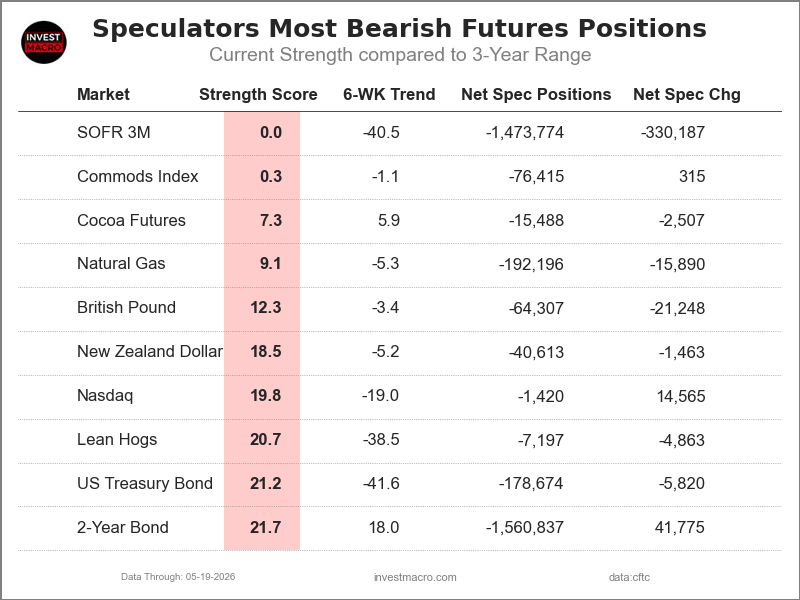
Here are the latest charts and statistics for the Commitment of Traders (COT) data published by the Commodities Futures Trading Commission (CFTC).
The latest COT data is updated through Tuesday May 19th and shows a quick view of how large market participants (for-profit speculators and commercial traders) were positioned in the futures markets. All currency positions are in direct relation to the US dollar where, for example, a bet for the euro is a bet that the euro will rise versus the dollar while a bet against the euro will be a bet that the euro will decline versus the dollar.
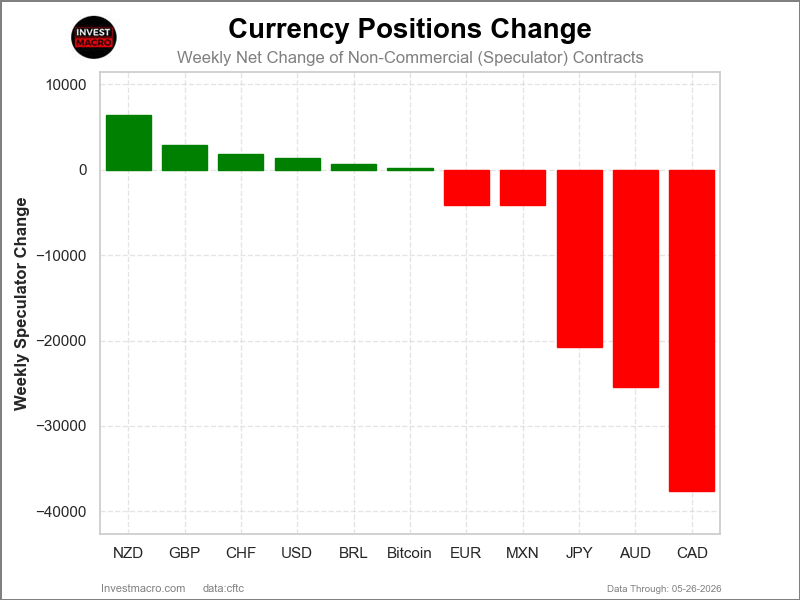
Weekly Speculator Changes led by Brazilian Real
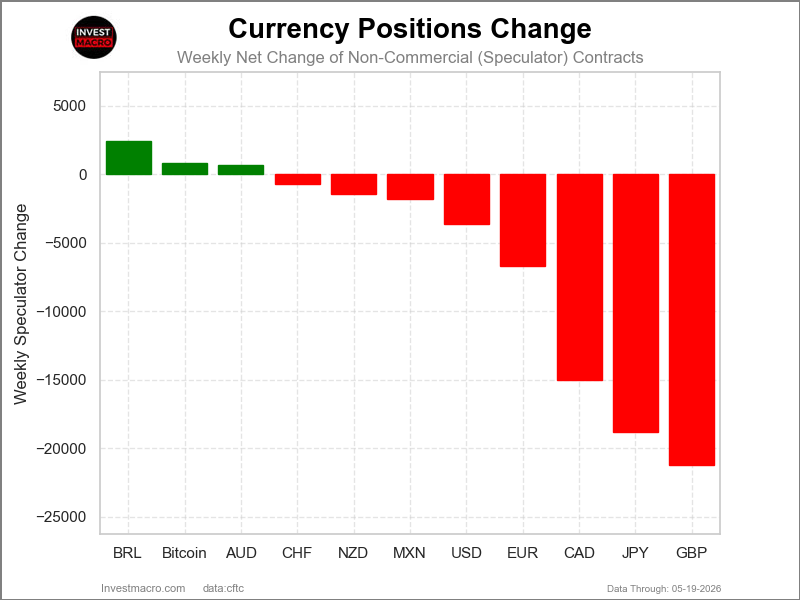
The COT currency market speculator bets were overall lower this week as just three out of the eleven currency markets we cover had higher positioning while the other eight markets had lower speculator contracts.
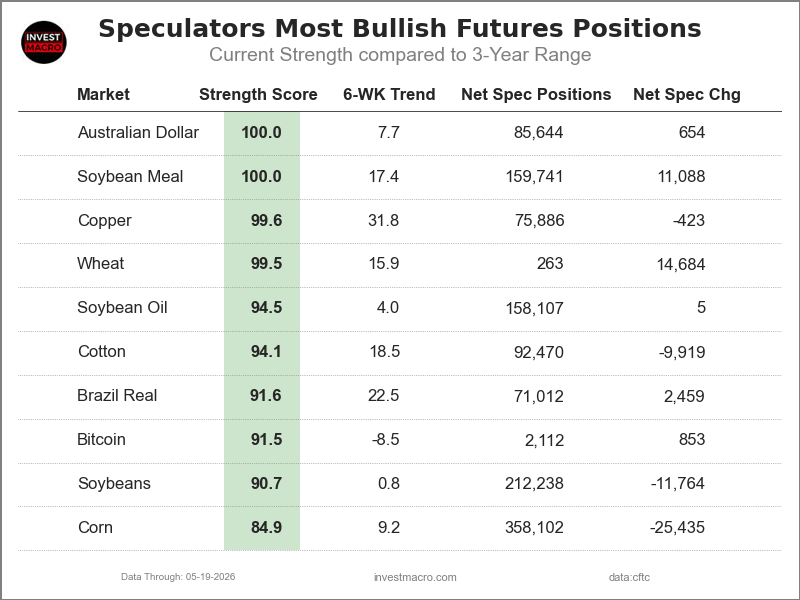
Leading the gains for the currency markets was the Brazilian Real (2,459 contracts) with Bitcoin (853 contracts) and the Australian Dollar (654 contracts) also showing positive weeks.
The currencies seeing declines in speculator bets on the week were the British Pound (-21,248 contracts), the Japanese Yen (-18,803 contracts), the Canadian Dollar (-14,989 contracts), the EuroFX (-6,687 contracts), the US Dollar Index (-3,666 contracts), the New Zealand Dollar (-1,463 contracts), the Mexican Peso (-1,841 contracts) and with the Swiss Franc (-740 contracts) also registering lower bets on the week.
Australian Dollar speculators continue to raise bullish bets for 4th straight week
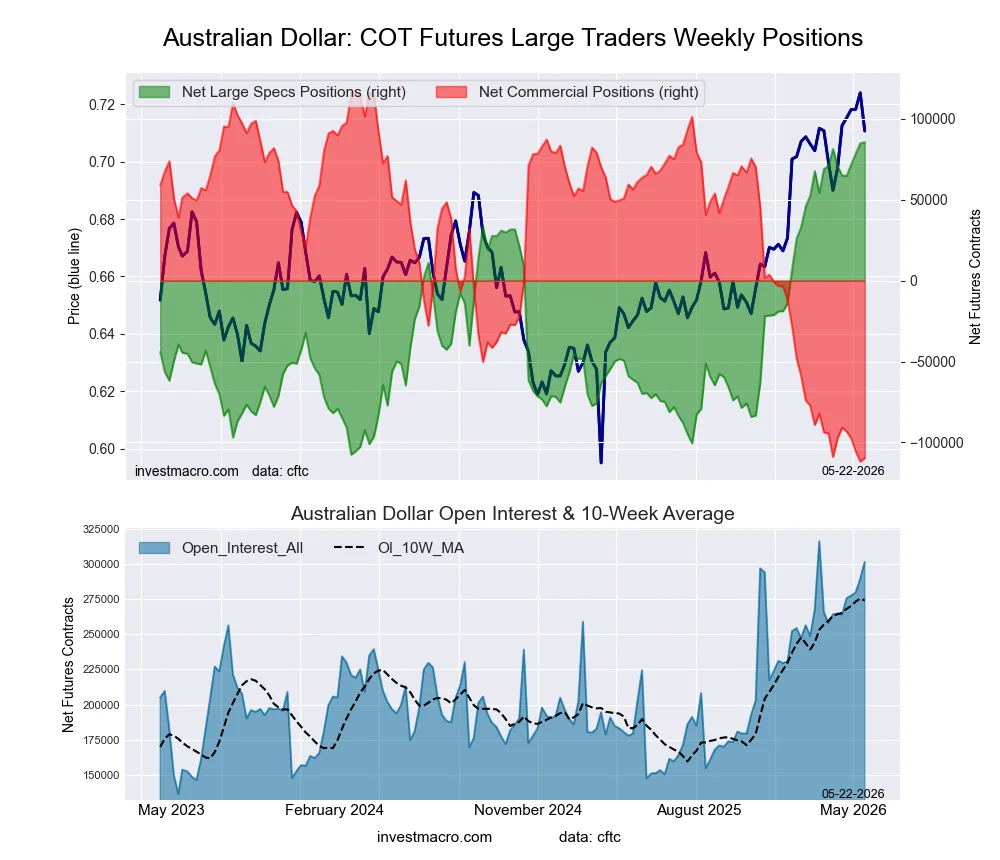
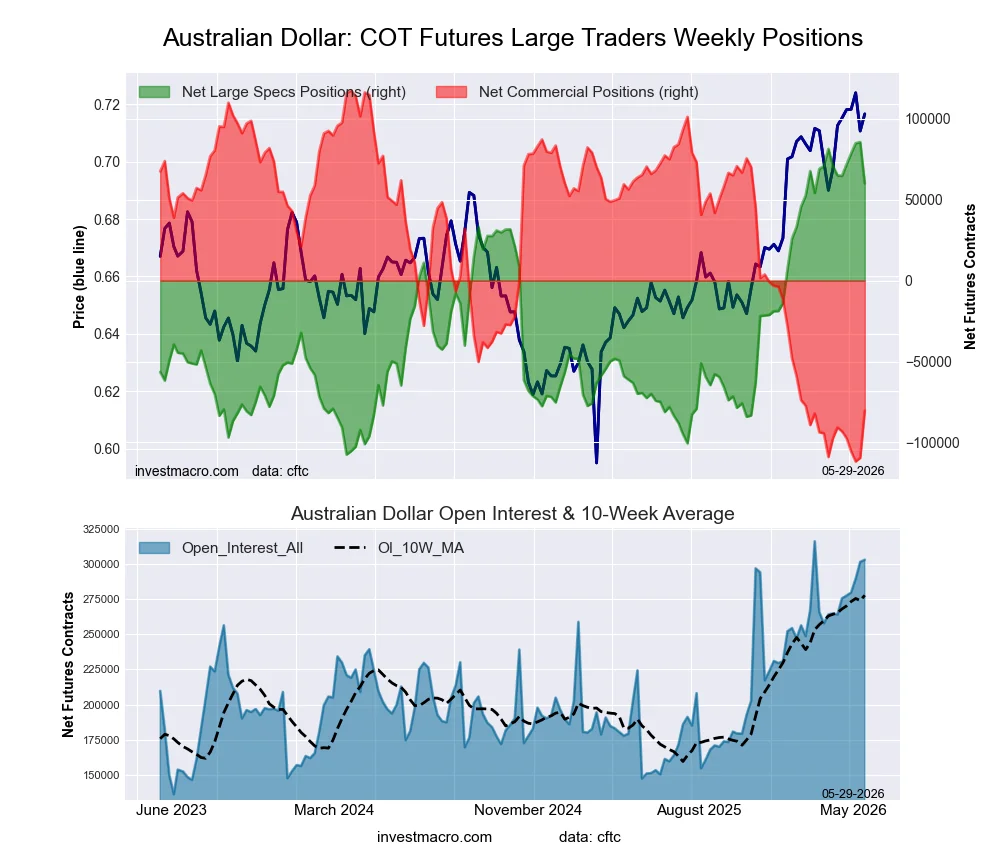
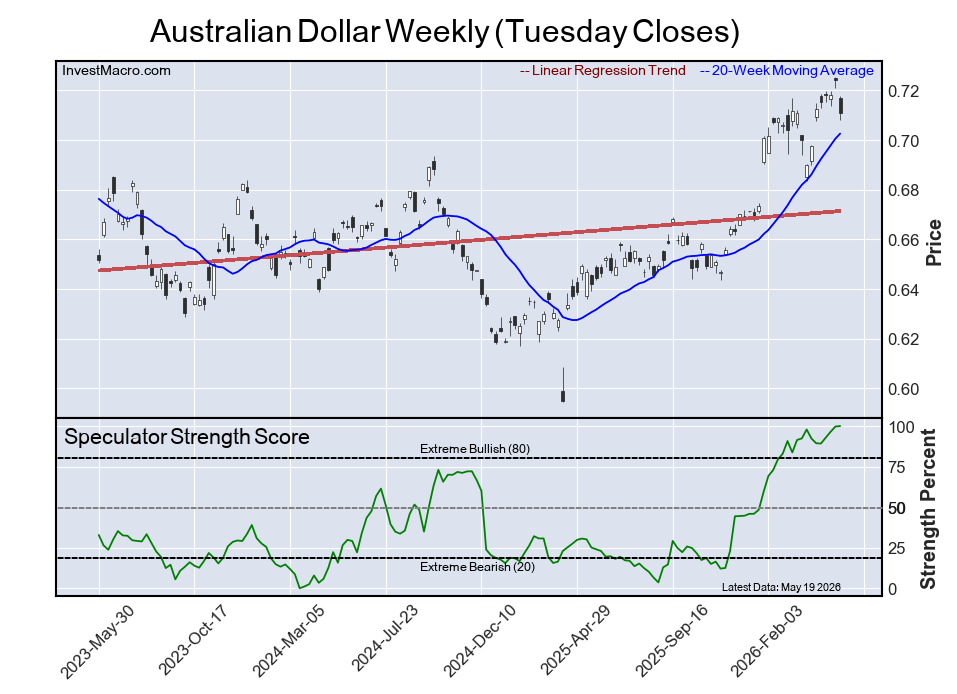
Highlighting this week’s Currency market speculator positioning is the Australian Dollar’s continued speculator strength. The currency speculators raised their Australian Dollar bets very modestly by just 654 contracts, but have now pushed AUD bets higher for a fourth consecutive week—and for the 20th time out of the past 24 weeks—illustrating the recent strength for speculators in the Australian Dollar. In these past 24 weeks, the Australian Dollar has surged by almost +170,000 net contracts, going from a total position of -83,393 contracts on December 2nd to this week’s position of +85,644 net contracts. This week’s position is now the highest level for the Australian Dollar standing since 2013 and not far off from the all-time record, which was a total of 103,376 contracts on December 11th of 2012. In the Forex markets, the Australian Dollar against the US Dollar has recently traded at four-year highs but has now dipped for two consecutive weeks. Currently, the AUD is trading at 0.7135, with major support at 0.7100 sitting below while recent highs were capped by resistance above around 0.7270.
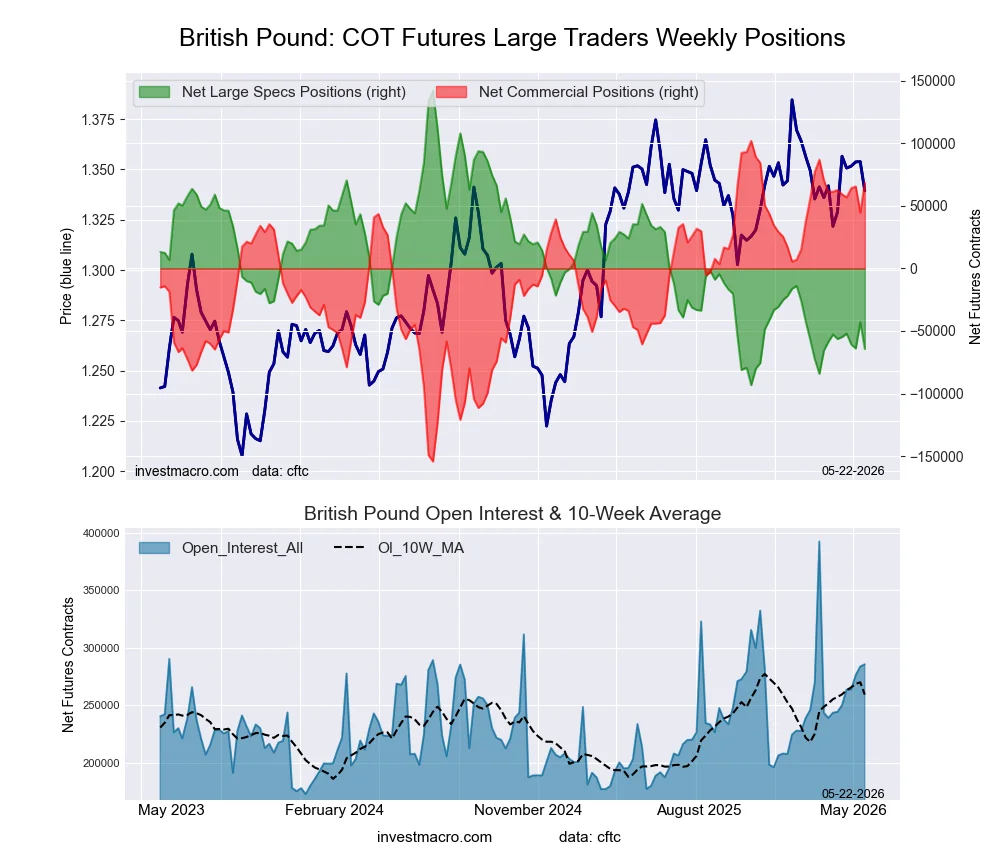
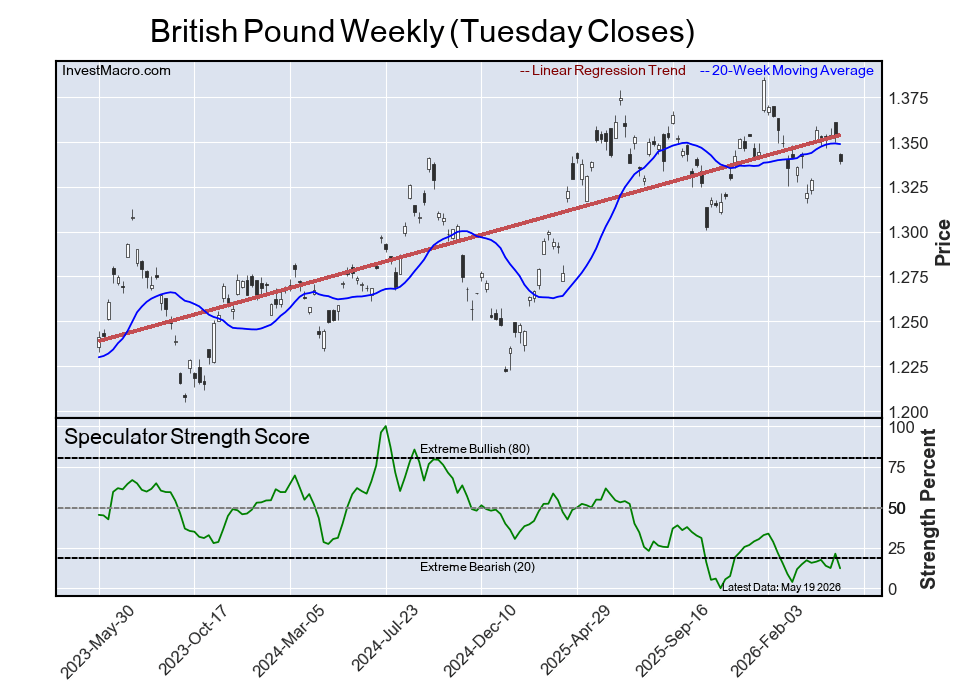
The British Pound Sterling fell sharply this week by over -21,000 contracts, and has now has fallen for three out of the past four weeks. This weakness has pushed the overall net speculator position to the most bearish level of the past nine weeks. In the Foreign Exchange market, the GBPUSD currency pair has been consolidating in sideways trading action for over a year against the USD, with support at the 1.3030 level and overhead resistance at the 1.3700 level. Currently, the price is right in the middle of that sideways channel at about 1.3447.
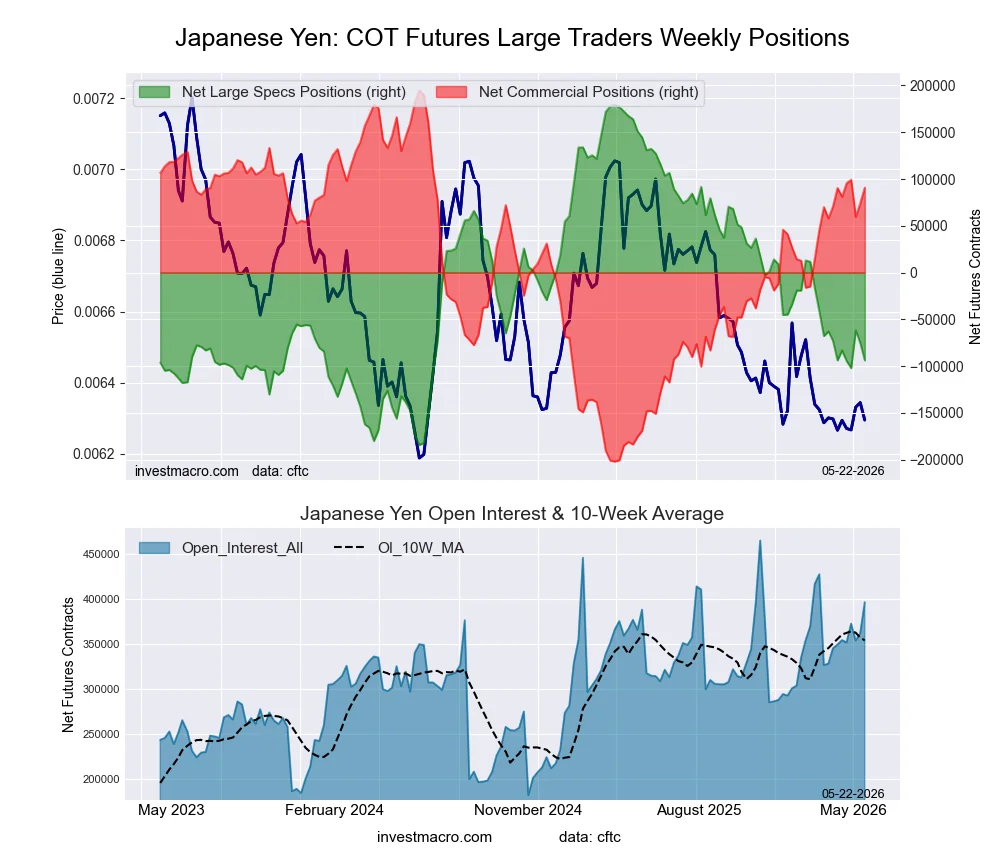
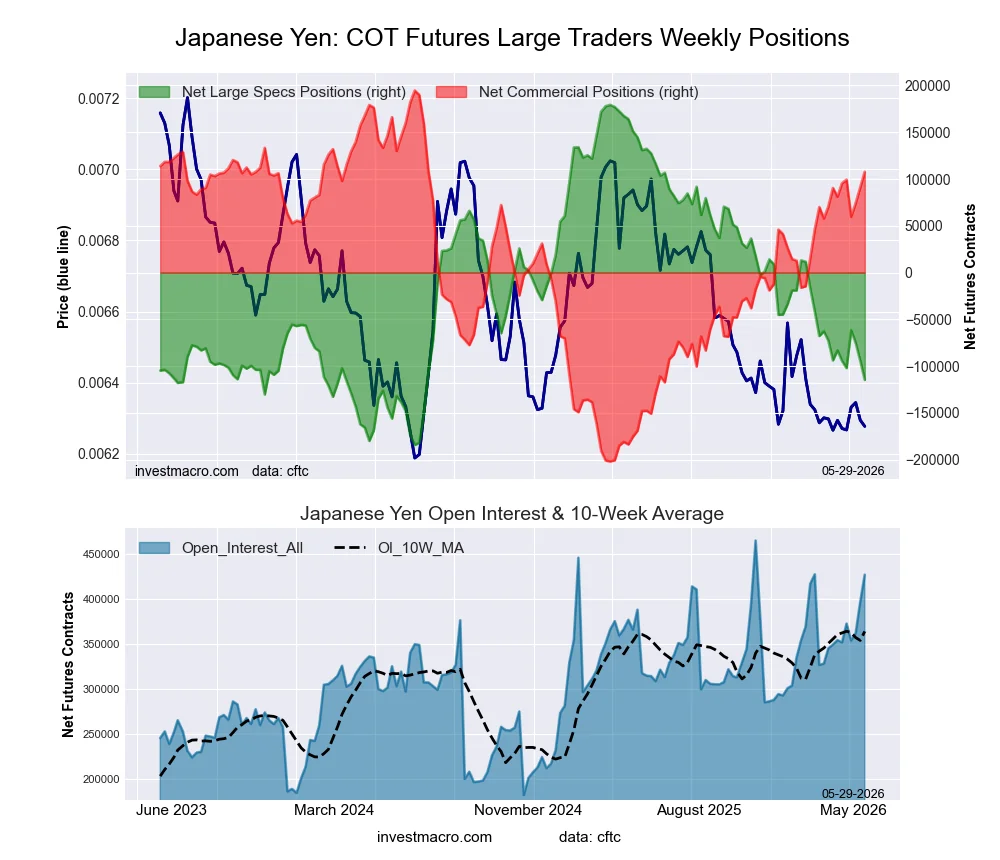
The Japanese Yen also saw lower levels in speculator bets this week by over -18,000 contracts. The speculator position for the Yen has been deteriorating since having a couple of weeks in bullish territory in February and has now seen speculator positions fall in 10 out of the past 13 weeks, with this week’s net speculator standing totaling -93,905 contracts. In the Foreign Exchange market, the Yen has fallen for three consecutive weeks following the Bank of Japan’s intervention to prop up the Yen in late April. The price is approaching those same levels where the BOJ intervened, and it will be interesting looking forward as the market tests the BOJ resolve once again.
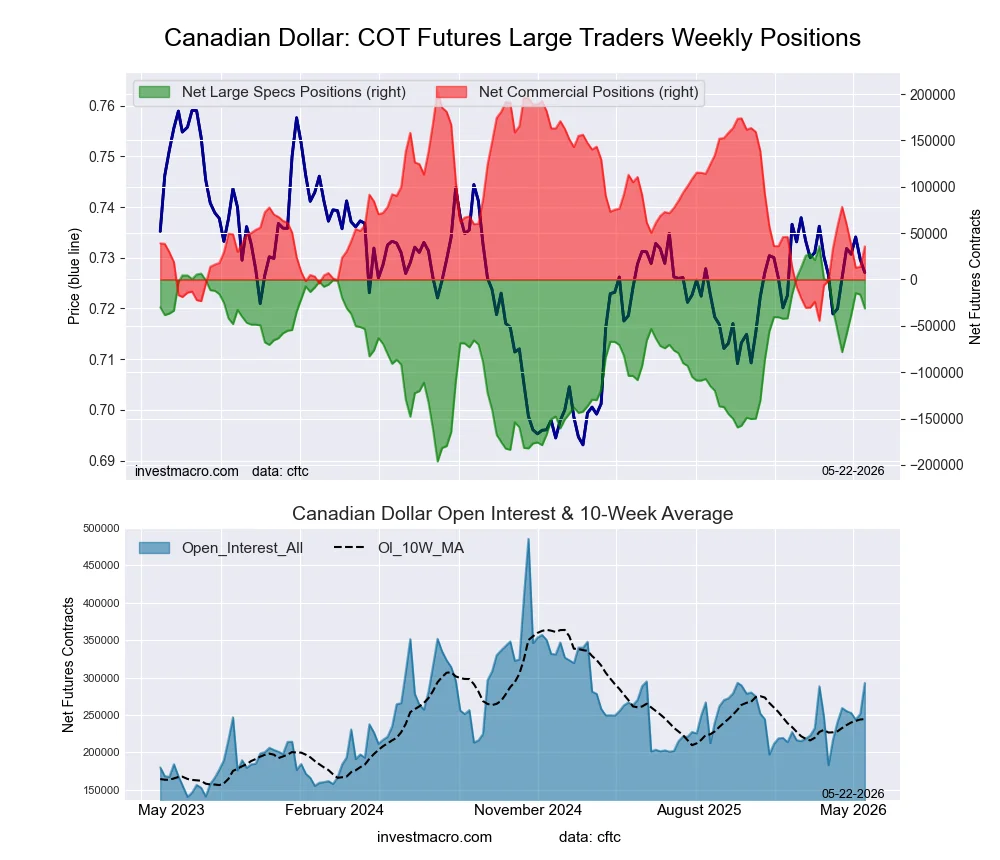
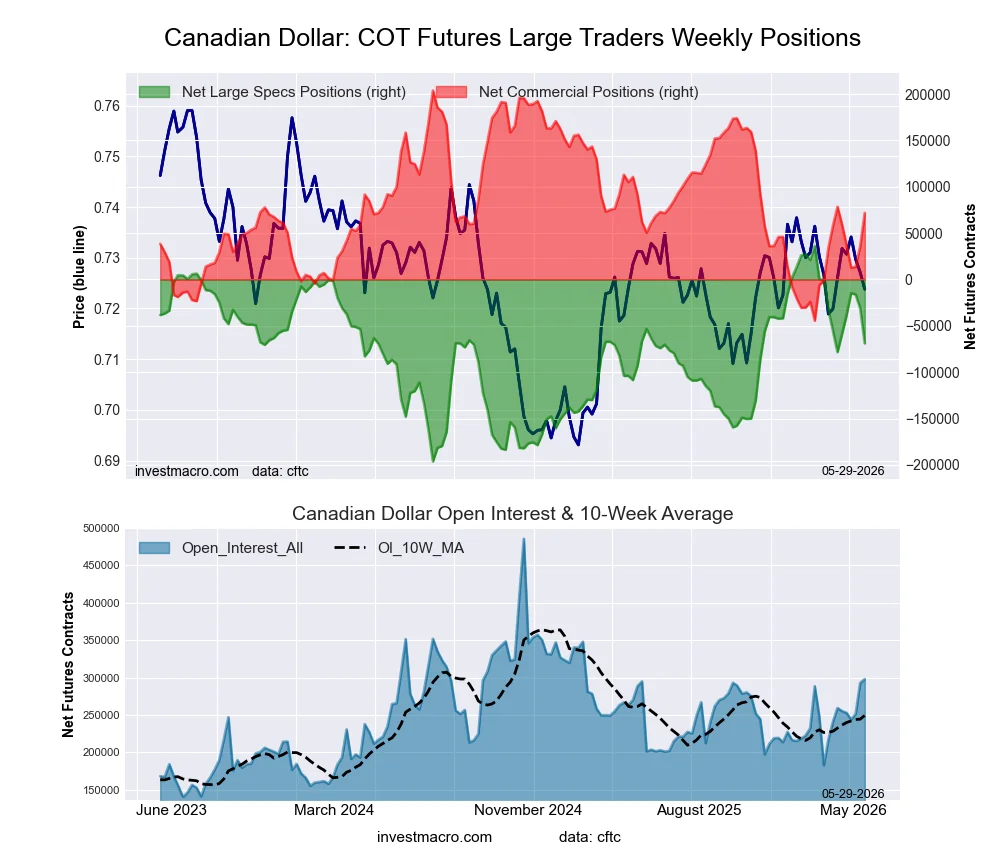
The Canadian Dollar speculator bets fell this week by over -14,000 contracts and have fallen for two straight weeks. The CAD speculator position has now fallen in seven out of the past 10 weeks and right now, the Canadian Dollar’s overall speculator standing sits at -31,231 net contracts. In the Forex markets, the Canadian Dollar has declined for three consecutive weeks against the US Dollar and has fallen below its 200-weekly moving average. The CAD, however, continues to trade in an ascending triangle pattern, which has not broken to the downside or the upside yet and will likely resolve itself in the coming weeks.
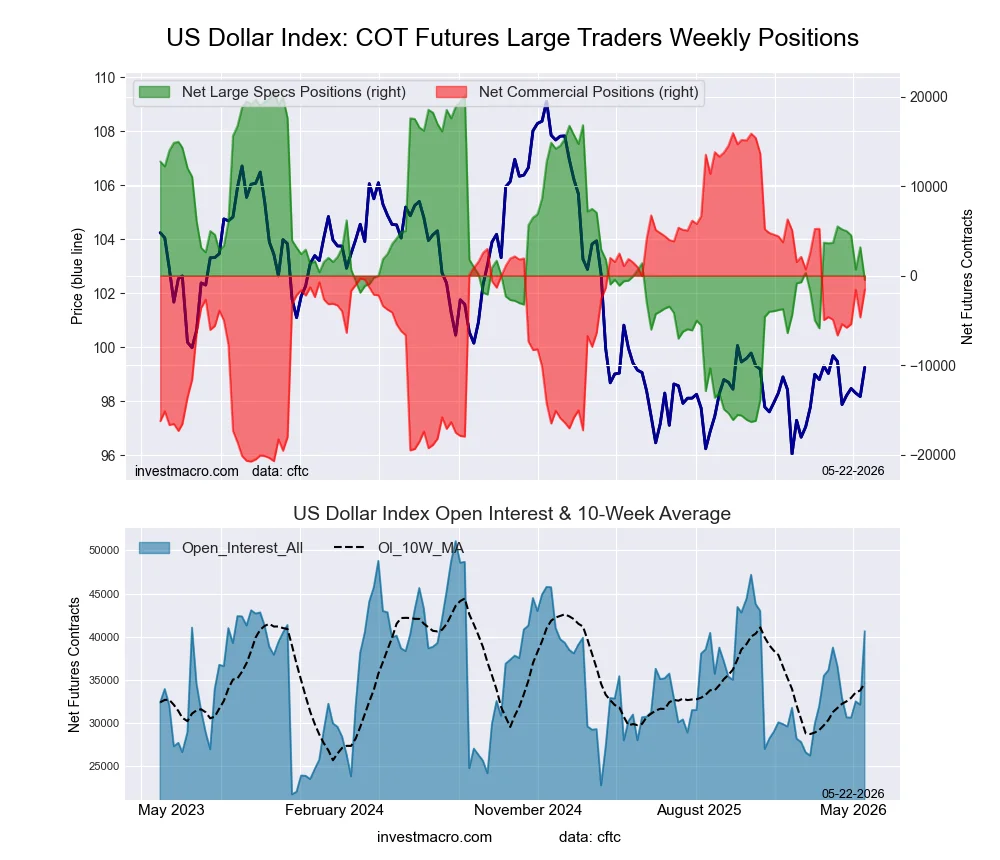
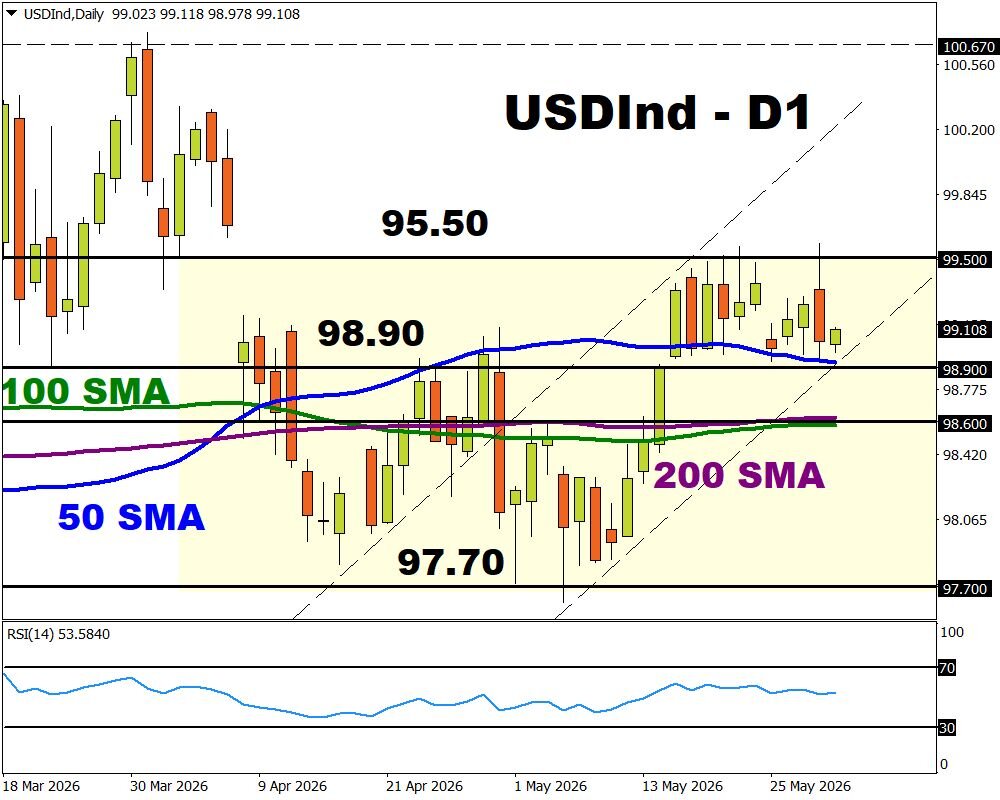
The US Dollar Index speculator positions dropped this week by -3,666 contracts. This has flipped the US Dollar speculative position into an overall bearish position. This small bearish level represents the first bearish position since March 10th, a span of 10 weeks and signals an overall neutral position in the big scheme of things. In the Foreign Exchange markets, the US Dollar Index has remained in its trading range for basically one full year with a price of 100.00 on the upside and a lower support level of 96.50 representing the bottom of the trading range. At the moment, the US Dollar Index positioning is closer the top of the trading range at a closing price on the week of 99.01.
The British Pound Sterling topped Currency Market price performance.
Price performances for the Currency Markets on the week were led by the British Pound, which rose by almost 1% with a 0.94% 5-Day increase. The Brazilian Real came in second with a 0.72% rise and was followed by the New Zealand Dollar, which saw an uptick by 0.33%.
Next up, the Swiss Franc was modestly higher by 0.30% and was followed by the Mexican Peso, which rounded out the gainers with a 0.18% rise.
On the downside, the Australian Dollar and the US Dollar Index were virtually unchanged with a -0.01% decline for each of those markets. The Japanese Yen was lower by -0.08%, followed by the Euro, which dipped by -0.16%, and the Canadian Dollar fell by -0.52%. The biggest decliner on the week was Bitcoin, which fell by -1.99%.
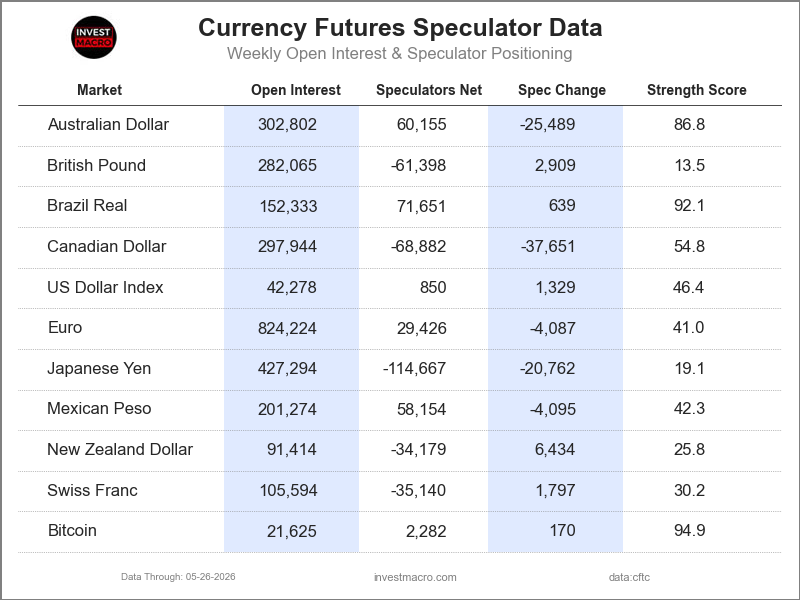
Currencies Data:
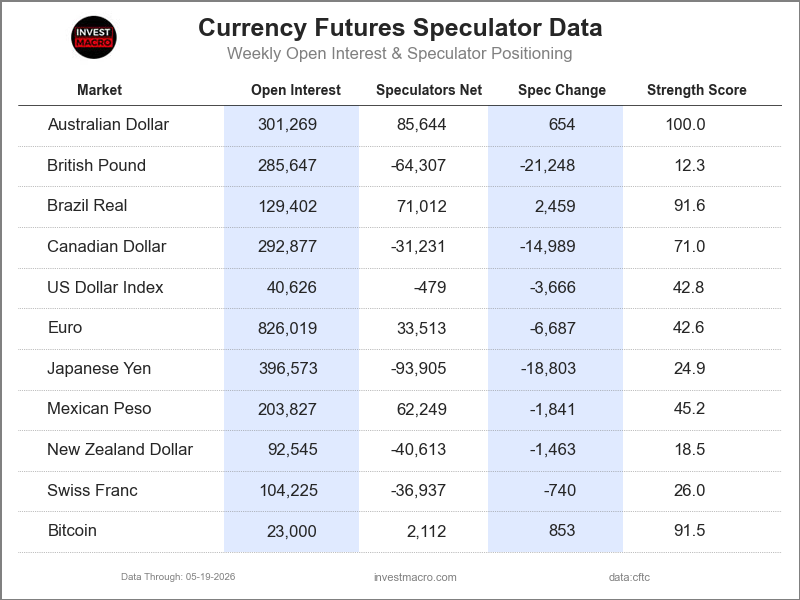
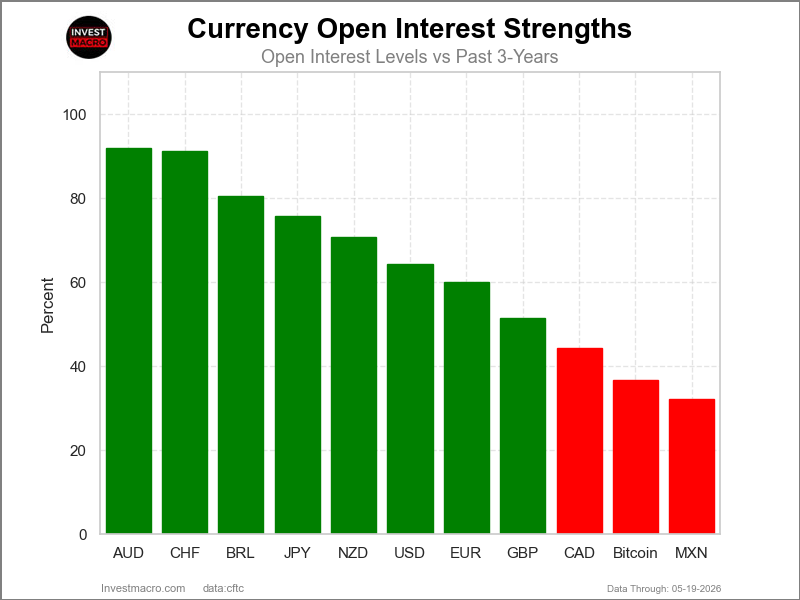
Legend: Open Interest | Speculators Current Net Position | Weekly Specs Change | Specs Strength Score compared to last 3-Years (0-100 range)
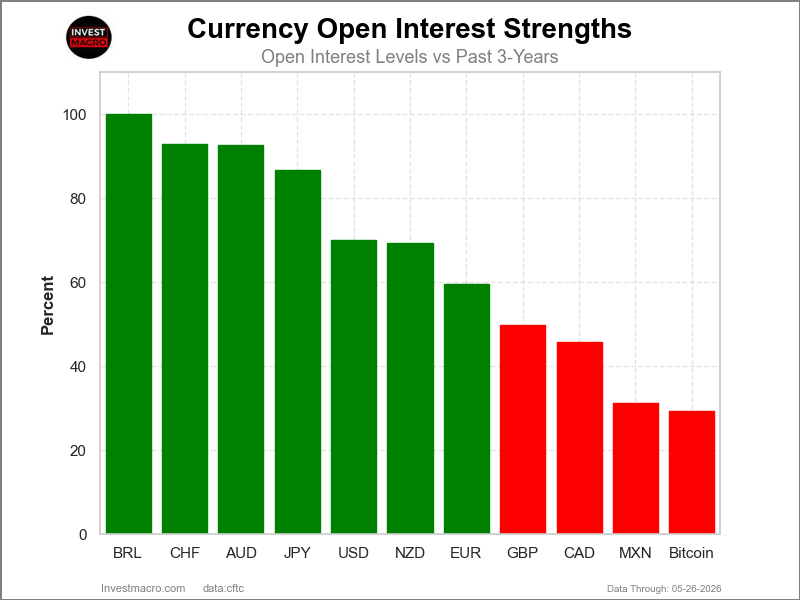
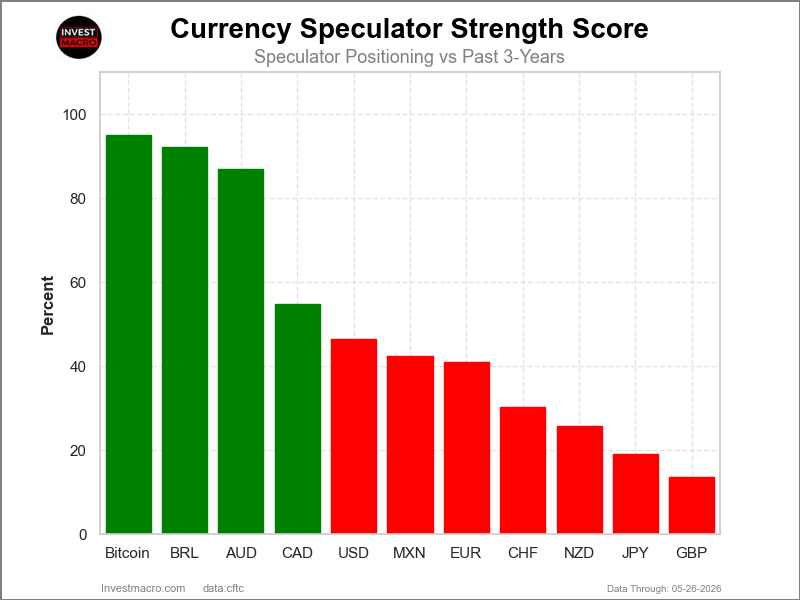
Strength Scores led by Australian Dollar & Brazilian Real
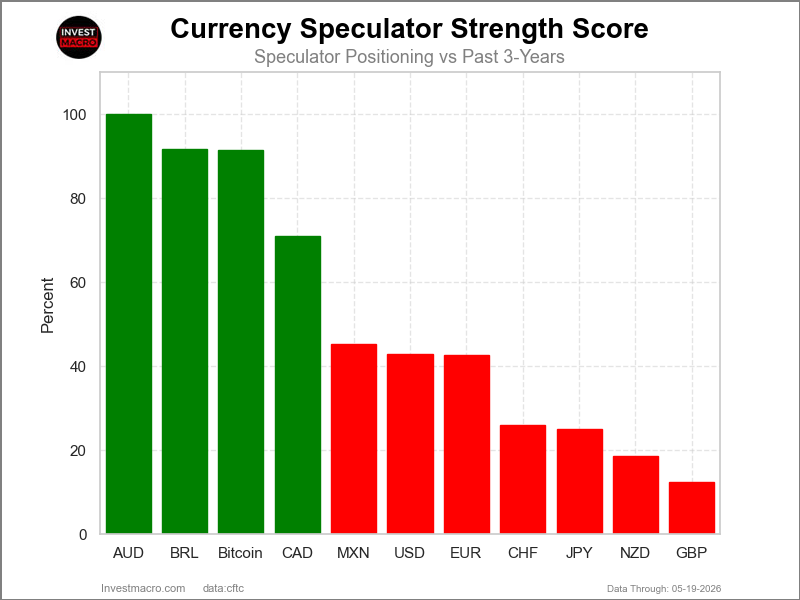
COT Strength Scores (a normalized measure of Speculator positions over a 3-Year range, from 0 to 100 where above 80 is Extreme-Bullish and below 20 is Extreme-Bearish) showed that the Australian Dollar (100 percent) and the Brazilian Real (92 percent) lead the currency markets this week. Bitcoin (91 percent) and the Canadian Dollar (71 percent) come in as the next highest in the weekly strength scores.
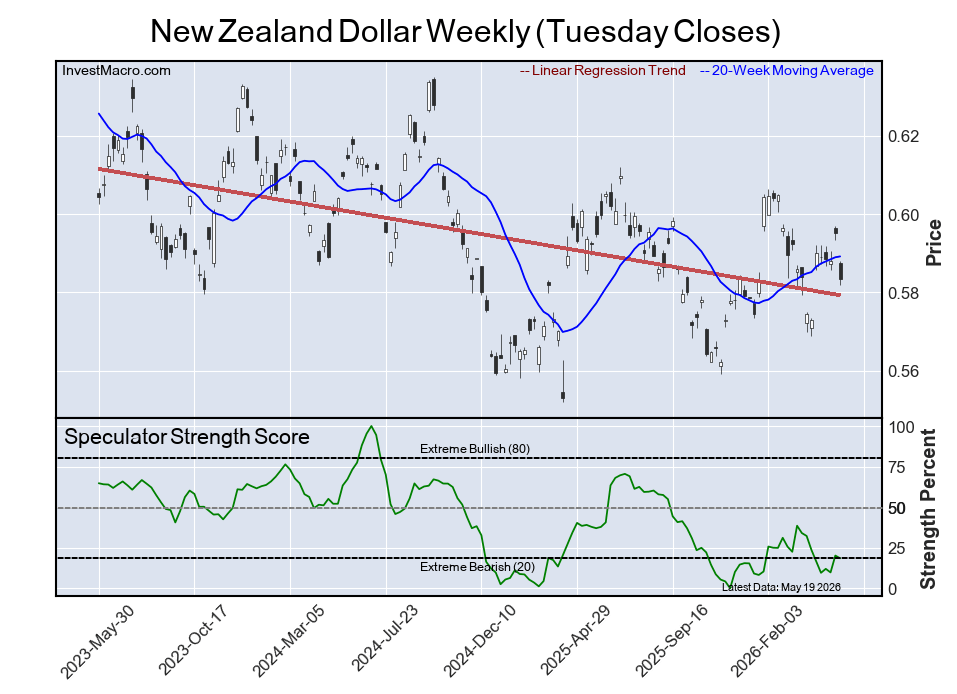
On the downside, the British Pound (12 percent) and the New Zealand Dollar (18 percent) come in at the lowest strength levels currently and are in Extreme-Bearish territory (below 20 percent). The next lowest strength scores are the Japanese Yen (25 percent) and the Swiss Franc (26 percent).
3-Year Strength Statistics:
US Dollar Index (42.8 percent) vs US Dollar Index previous week (52.7 percent)
EuroFX (42.6 percent) vs EuroFX previous week (45.2 percent)
British Pound Sterling (12.3 percent) vs British Pound Sterling previous week (21.3 percent)
Japanese Yen (24.9 percent) vs Japanese Yen previous week (30.0 percent)
Swiss Franc (26.0 percent) vs Swiss Franc previous week (27.5 percent)
Canadian Dollar (71.0 percent) vs Canadian Dollar previous week (77.5 percent)
Australian Dollar (100.0 percent) vs Australian Dollar previous week (99.7 percent)
New Zealand Dollar (18.5 percent) vs New Zealand Dollar previous week (20.1 percent)
Mexican Peso (45.2 percent) vs Mexican Peso previous week (46.5 percent)
Brazilian Real (91.6 percent) vs Brazilian Real previous week (89.8 percent)
Bitcoin (91.5 percent) vs Bitcoin previous week (74.5 percent)
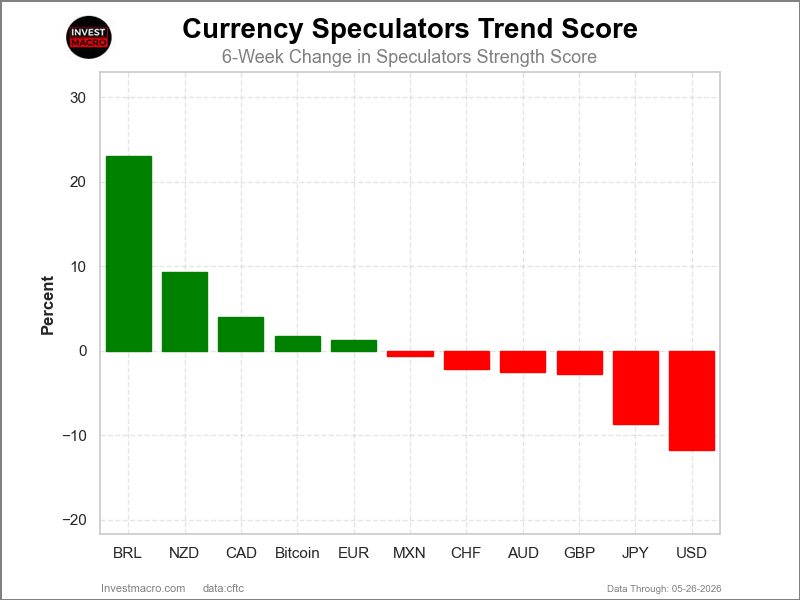
Brazilian Real & EuroFX top the 6-Week Strength Trends
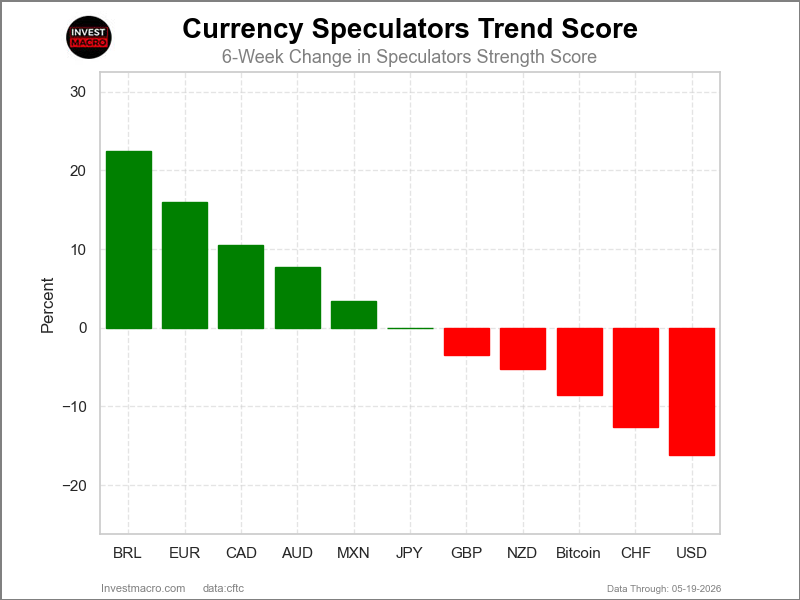
COT Strength Score Trends (or move index, calculates the 6-week changes in strength scores) showed that the Brazilian Real (22 percent) and the EuroFX (16 percent) lead the past six weeks trends for the currencies. The Canadian Dollar (11 percent), the Australian Dollar (8 percent) and the Mexican Peso (3 percent) are the next highest positive movers in the 3-Year trends data.
The US Dollar Index (-16 percent) leads the downside trend scores currently with the Swiss Franc (-13 percent), Bitcoin (-9 percent) and the New Zealand Dollar (-5 percent) following next with lower trend scores.
3-Year Strength Trends:
US Dollar Index (-16.2 percent) vs US Dollar Index previous week (-1.3 percent)
EuroFX (16.0 percent) vs EuroFX previous week (15.5 percent)
British Pound Sterling (-3.4 percent) vs British Pound Sterling previous week (4.1 percent)
Japanese Yen (-0.0 percent) vs Japanese Yen previous week (-0.6 percent)
Swiss Franc (-12.6 percent) vs Swiss Franc previous week (-12.8 percent)
Canadian Dollar (10.5 percent) vs Canadian Dollar previous week (7.1 percent)
Australian Dollar (7.7 percent) vs Australian Dollar previous week (1.8 percent)
New Zealand Dollar (-5.2 percent) vs New Zealand Dollar previous week (-12.1 percent)
Mexican Peso (3.4 percent) vs Mexican Peso previous week (4.5 percent)
Brazilian Real (22.5 percent) vs Brazilian Real previous week (11.5 percent)
Bitcoin (-8.5 percent) vs Bitcoin previous week (-19.8 percent)
Individual COT Forex Markets:
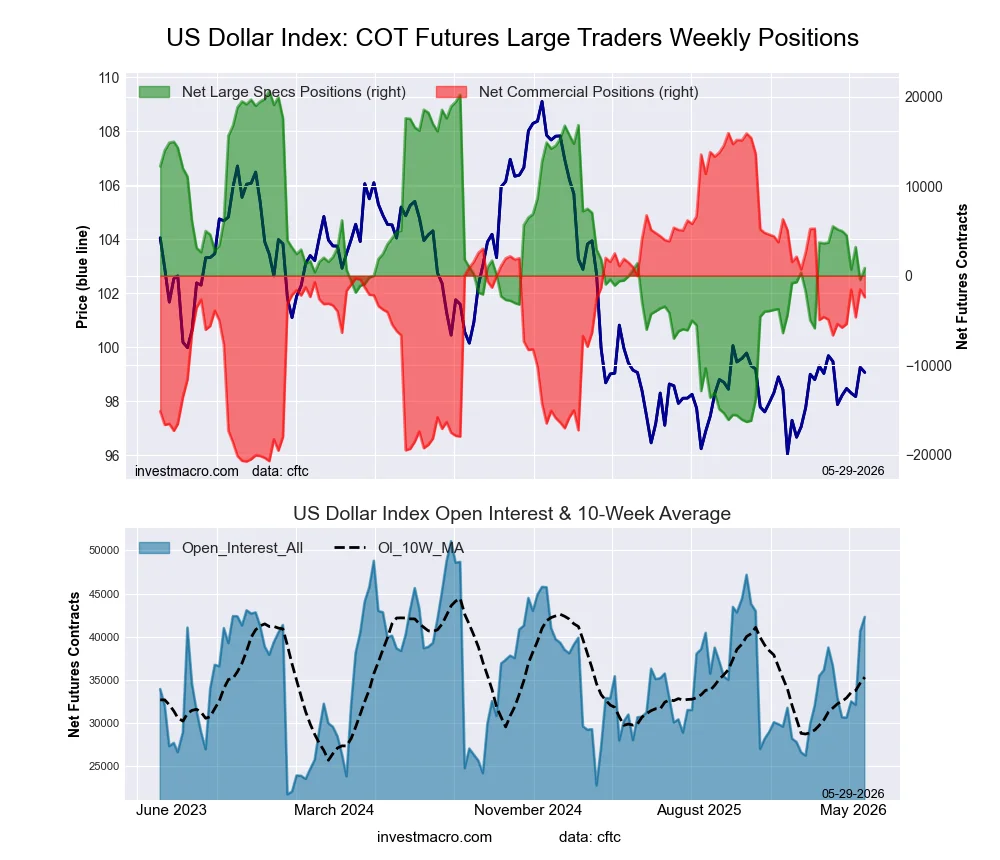
US Dollar Index Futures:
 Positioning Notes:
- US Dollar Index large speculator standing this week reached a net position of -479 contracts in the data reported through Tuesday.
- Weekly Speculator position decline of -3,666 contracts from the previous week which had a total of 3,187 net contracts.
- This week’s current strength score (range over the past 3 years, measured from 0 to 100) shows the speculators are currently Bearish with a score of 42.8 percent.
- The Commercials are Bullish with a score of 52.4 percent.
- The Small Traders (not shown in chart) are Bullish with a score of 74.5 percent.
Price Trend-Following Model: Uptrend
Our weekly trend-following model classifies the current market price position as: Uptrend.
| US DOLLAR INDEX Statistics | SPECULATORS | COMMERCIALS | SMALL TRADERS |
| – Percent of Open Interest Longs: | 52.7 | 34.3 | 9.3 |
| – Percent of Open Interest Shorts: | 53.9 | 38.1 | 4.3 |
| – Net Position: | -479 | -1,551 | 2,030 |
| – Gross Longs: | 21,403 | 13,920 | 3,791 |
| – Gross Shorts: | 21,882 | 15,471 | 1,761 |
| – Long to Short Ratio: | 1.0 to 1 | 0.9 to 1 | 2.2 to 1 |
| NET POSITION TREND: | | | |
| – Strength Index Score (3 Year Range Pct): | 42.8 | 52.4 | 74.5 |
| – Strength Index Reading (3 Year Range): | Bearish | Bullish | Bullish |
| NET POSITION MOVEMENT INDEX: | | | |
| – 6-Week Change in Strength Index: | -16.2 | 14.0 | 15.1 |
Euro Currency Futures:
 Positioning Notes:
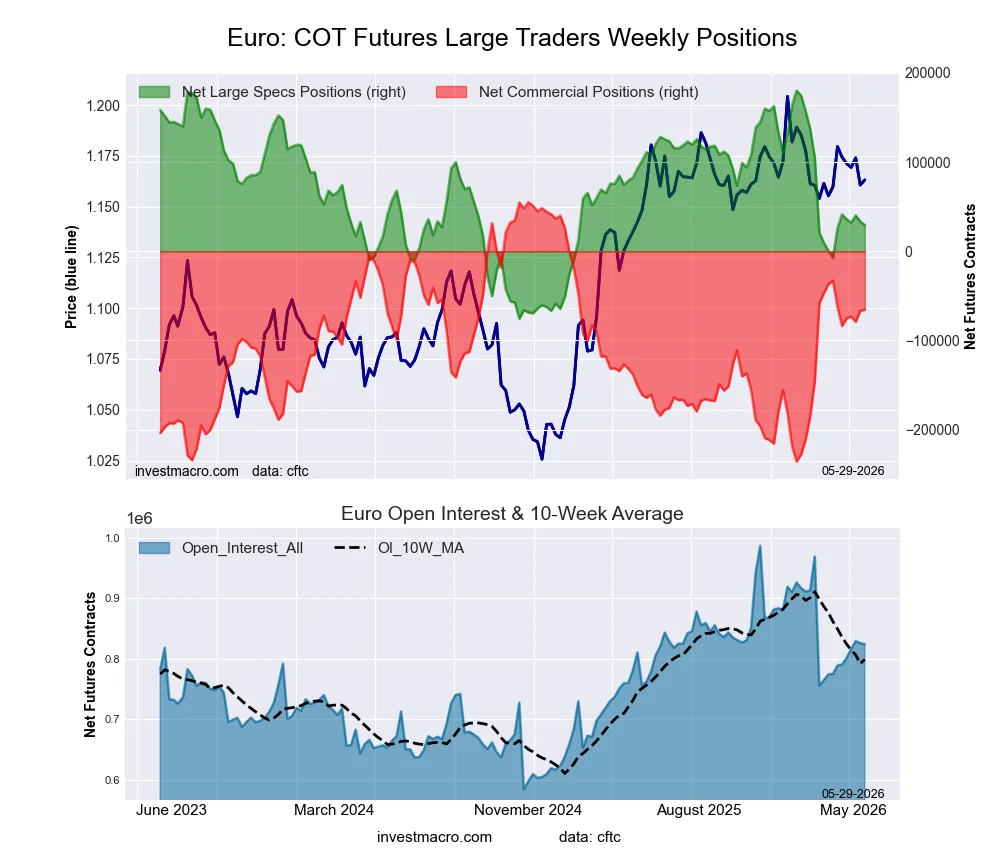
- Euro Currency large speculator standing this week reached a net position of 33,513 contracts in the data reported through Tuesday.
- Weekly Speculator position decrease of -6,687 contracts from the previous week which had a total of 40,200 net contracts.
- This week’s current strength score (range over the past 3 years, measured from 0 to 100) shows the speculators are currently Bearish with a score of 42.6 percent.
- The Commercials are Bullish with a score of 58.2 percent.
- The Small Traders (not shown in chart) are Bearish with a score of 44.2 percent.
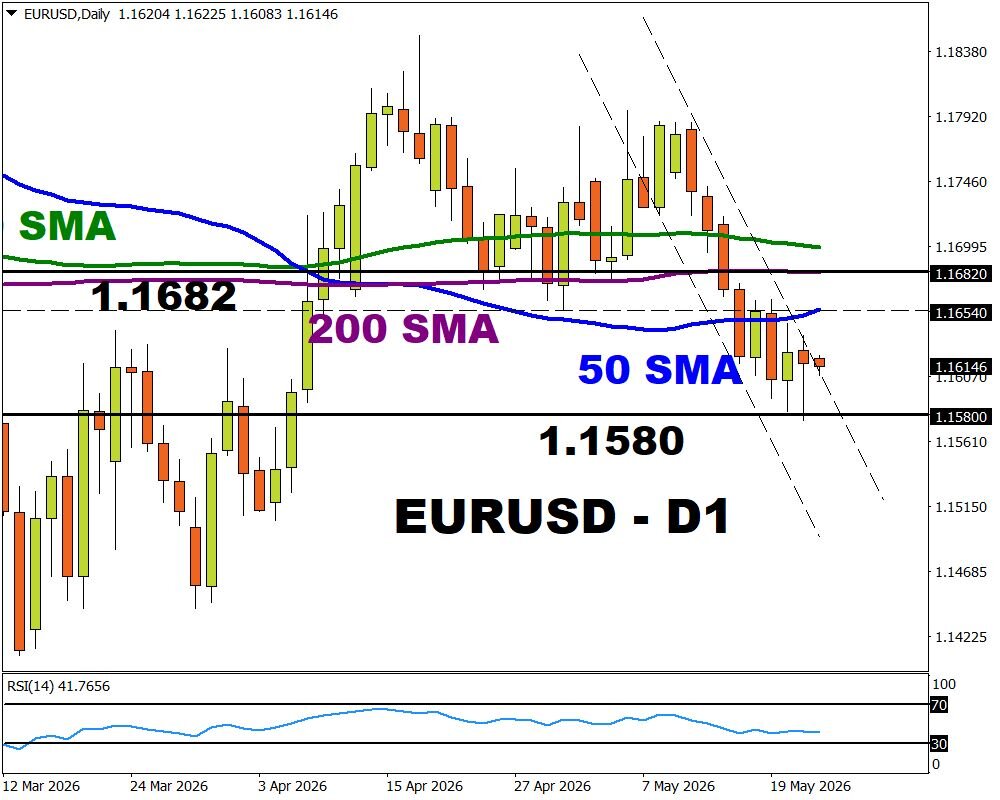
Price Trend-Following Model: Downtrend
Our weekly trend-following model classifies the current market price position as: Downtrend.
| EURO Currency Statistics | SPECULATORS | COMMERCIALS | SMALL TRADERS |
| – Percent of Open Interest Longs: | 28.2 | 57.1 | 10.4 |
| – Percent of Open Interest Shorts: | 24.2 | 65.1 | 6.4 |
| – Net Position: | 33,513 | -66,535 | 33,022 |
| – Gross Longs: | 233,251 | 471,453 | 86,082 |
| – Gross Shorts: | 199,738 | 537,988 | 53,060 |
| – Long to Short Ratio: | 1.2 to 1 | 0.9 to 1 | 1.6 to 1 |
| NET POSITION TREND: | | | |
| – Strength Index Score (3 Year Range Pct): | 42.6 | 58.2 | 44.2 |
| – Strength Index Reading (3 Year Range): | Bearish | Bullish | Bearish |
| NET POSITION MOVEMENT INDEX: | | | |
| – 6-Week Change in Strength Index: | 16.0 | -11.5 | -16.2 |
British Pound Sterling Futures:
 Positioning Notes:
- British Pound Sterling large speculator standing this week reached a net position of -64,307 contracts in the data reported through Tuesday.
- Weekly Speculator position decrease of -21,248 contracts from the previous week which had a total of -43,059 net contracts.
- This week’s current strength score (range over the past 3 years, measured from 0 to 100) shows the speculators are currently Bearish-Extreme with a score of 12.3 percent.
- The Commercials are Bullish-Extreme with a score of 87.0 percent.
- The Small Traders (not shown in chart) are Bearish with a score of 41.8 percent.
Price Trend-Following Model: Downtrend
Our weekly trend-following model classifies the current market price position as: Downtrend.
| BRITISH POUND Statistics | SPECULATORS | COMMERCIALS | SMALL TRADERS |
| – Percent of Open Interest Longs: | 23.8 | 66.6 | 8.8 |
| – Percent of Open Interest Shorts: | 46.3 | 42.6 | 10.3 |
| – Net Position: | -64,307 | 68,698 | -4,391 |
| – Gross Longs: | 68,075 | 190,244 | 25,040 |
| – Gross Shorts: | 132,382 | 121,546 | 29,431 |
| – Long to Short Ratio: | 0.5 to 1 | 1.6 to 1 | 0.9 to 1 |
| NET POSITION TREND: | | | |
| – Strength Index Score (3 Year Range Pct): | 12.3 | 87.0 | 41.8 |
| – Strength Index Reading (3 Year Range): | Bearish-Extreme | Bullish-Extreme | Bearish |
| NET POSITION MOVEMENT INDEX: | | | |
| – 6-Week Change in Strength Index: | -3.4 | 2.3 | 5.1 |
Japanese Yen Futures:
 Positioning Notes:
- Japanese Yen large speculator standing this week reached a net position of -93,905 contracts in the data reported through Tuesday.
- Weekly Speculator position lowering of -18,803 contracts from the previous week which had a total of -75,102 net contracts.
- This week’s current strength score (range over the past 3 years, measured from 0 to 100) shows the speculators are currently Bearish with a score of 24.9 percent.
- The Commercials are Bullish with a score of 73.8 percent.
- The Small Traders (not shown in chart) are Bearish with a score of 44.8 percent.
Price Trend-Following Model: Downtrend
Our weekly trend-following model classifies the current market price position as: Downtrend.
| JAPANESE YEN Statistics | SPECULATORS | COMMERCIALS | SMALL TRADERS |
| – Percent of Open Interest Longs: | 26.9 | 57.1 | 10.0 |
| – Percent of Open Interest Shorts: | 50.6 | 34.3 | 9.2 |
| – Net Position: | -93,905 | 90,766 | 3,139 |
| – Gross Longs: | 106,603 | 226,613 | 39,648 |
| – Gross Shorts: | 200,508 | 135,847 | 36,509 |
| – Long to Short Ratio: | 0.5 to 1 | 1.7 to 1 | 1.1 to 1 |
| NET POSITION TREND: | | | |
| – Strength Index Score (3 Year Range Pct): | 24.9 | 73.8 | 44.8 |
| – Strength Index Reading (3 Year Range): | Bearish | Bullish | Bearish |
| NET POSITION MOVEMENT INDEX: | | | |
| – 6-Week Change in Strength Index: | -0.0 | 0.1 | -0.5 |
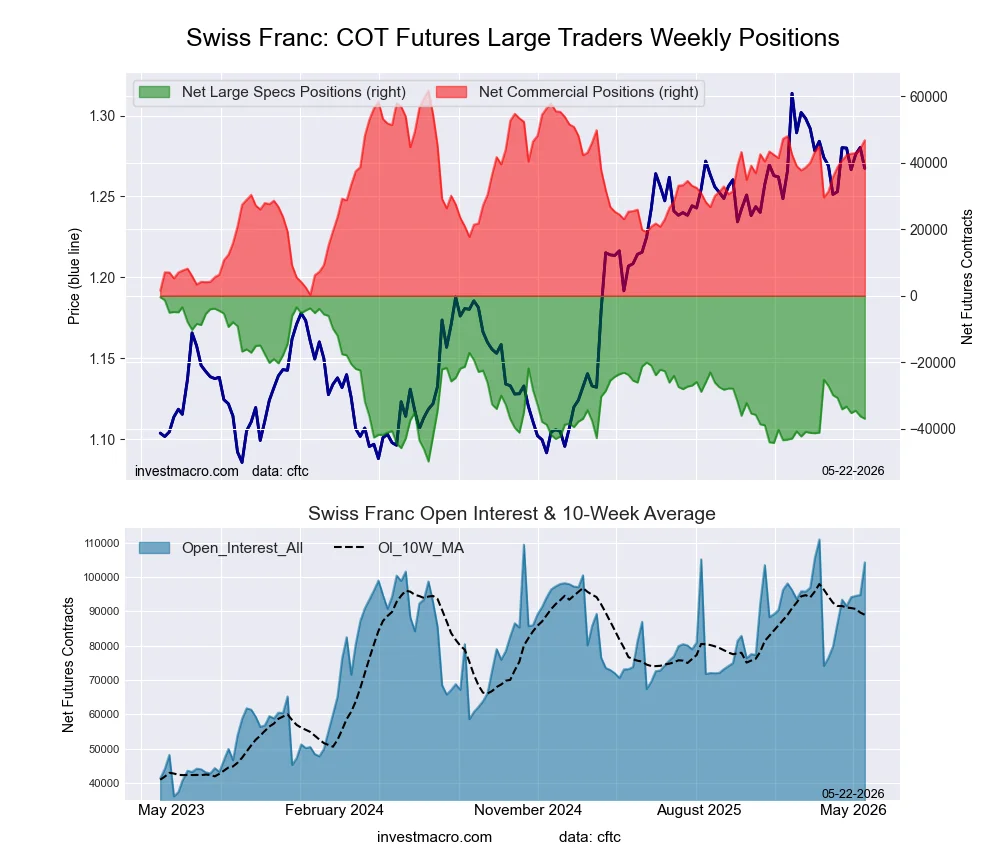
Swiss Franc Futures:
 Positioning Notes:
- Swiss Franc large speculator standing this week reached a net position of -36,937 contracts in the data reported through Tuesday.
- Weekly Speculator position reduction of -740 contracts from the previous week which had a total of -36,197 net contracts.
- This week’s current strength score (range over the past 3 years, measured from 0 to 100) shows the speculators are currently Bearish with a score of 26.0 percent.
- The Commercials are Bullish with a score of 75.7 percent.
- The Small Traders (not shown in chart) are Bearish with a score of 37.1 percent.
Price Trend-Following Model: Downtrend
Our weekly trend-following model classifies the current market price position as: Downtrend.
| SWISS FRANC Statistics | SPECULATORS | COMMERCIALS | SMALL TRADERS |
| – Percent of Open Interest Longs: | 6.0 | 83.0 | 10.7 |
| – Percent of Open Interest Shorts: | 41.5 | 38.1 | 20.2 |
| – Net Position: | -36,937 | 46,775 | -9,838 |
| – Gross Longs: | 6,284 | 86,464 | 11,198 |
| – Gross Shorts: | 43,221 | 39,689 | 21,036 |
| – Long to Short Ratio: | 0.1 to 1 | 2.2 to 1 | 0.5 to 1 |
| NET POSITION TREND: | | | |
| – Strength Index Score (3 Year Range Pct): | 26.0 | 75.7 | 37.1 |
| – Strength Index Reading (3 Year Range): | Bearish | Bullish | Bearish |
| NET POSITION MOVEMENT INDEX: | | | |
| – 6-Week Change in Strength Index: | -12.6 | 13.2 | -7.8 |
Canadian Dollar Futures:
 Positioning Notes:
- Canadian Dollar large speculator standing this week reached a net position of -31,231 contracts in the data reported through Tuesday.
- Weekly Speculator position decline of -14,989 contracts from the previous week which had a total of -16,242 net contracts.
- This week’s current strength score (range over the past 3 years, measured from 0 to 100) shows the speculators are currently Bullish with a score of 71.0 percent.
- The Commercials are Bearish with a score of 32.3 percent.
- The Small Traders (not shown in chart) are Bearish with a score of 32.8 percent.
Price Trend-Following Model: Weak Uptrend
Our weekly trend-following model classifies the current market price position as: Weak Uptrend.
| CANADIAN DOLLAR Statistics | SPECULATORS | COMMERCIALS | SMALL TRADERS |
| – Percent of Open Interest Longs: | 24.8 | 59.8 | 9.6 |
| – Percent of Open Interest Shorts: | 35.5 | 47.6 | 11.2 |
| – Net Position: | -31,231 | 35,724 | -4,493 |
| – Gross Longs: | 72,674 | 175,009 | 28,192 |
| – Gross Shorts: | 103,905 | 139,285 | 32,685 |
| – Long to Short Ratio: | 0.7 to 1 | 1.3 to 1 | 0.9 to 1 |
| NET POSITION TREND: | | | |
| – Strength Index Score (3 Year Range Pct): | 71.0 | 32.3 | 32.8 |
| – Strength Index Reading (3 Year Range): | Bullish | Bearish | Bearish |
| NET POSITION MOVEMENT INDEX: | | | |
| – 6-Week Change in Strength Index: | 10.5 | -9.0 | -5.9 |
Australian Dollar Futures:
 Positioning Notes:
- Australian Dollar large speculator standing this week reached a net position of 85,644 contracts in the data reported through Tuesday.
- Weekly Speculator position lift of 654 contracts from the previous week which had a total of 84,990 net contracts.
- This week’s current strength score (range over the past 3 years, measured from 0 to 100) shows the speculators are currently Bullish-Extreme with a score of 100.0 percent.
- The Commercials are Bearish-Extreme with a score of 1.0 percent.
- The Small Traders (not shown in chart) are Bullish-Extreme with a score of 90.5 percent.
Price Trend-Following Model: Uptrend
Our weekly trend-following model classifies the current market price position as: Uptrend.
| AUSTRALIAN DOLLAR Statistics | SPECULATORS | COMMERCIALS | SMALL TRADERS |
| – Percent of Open Interest Longs: | 50.3 | 33.3 | 13.7 |
| – Percent of Open Interest Shorts: | 21.9 | 69.7 | 5.7 |
| – Net Position: | 85,644 | -109,572 | 23,928 |
| – Gross Longs: | 151,583 | 100,426 | 41,158 |
| – Gross Shorts: | 65,939 | 209,998 | 17,230 |
| – Long to Short Ratio: | 2.3 to 1 | 0.5 to 1 | 2.4 to 1 |
| NET POSITION TREND: | | | |
| – Strength Index Score (3 Year Range Pct): | 100.0 | 1.0 | 90.5 |
| – Strength Index Reading (3 Year Range): | Bullish-Extreme | Bearish-Extreme | Bullish-Extreme |
| NET POSITION MOVEMENT INDEX: | | | |
| – 6-Week Change in Strength Index: | 7.7 | -5.3 | -5.5 |
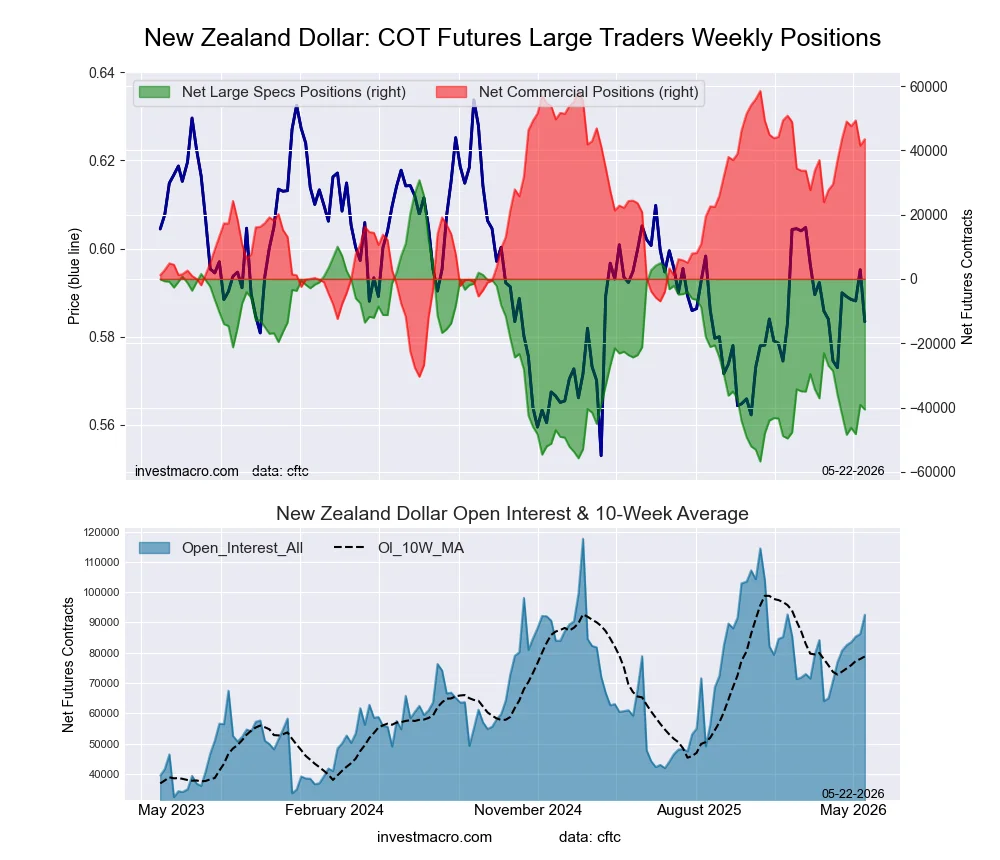
New Zealand Dollar Futures:
 Positioning Notes:
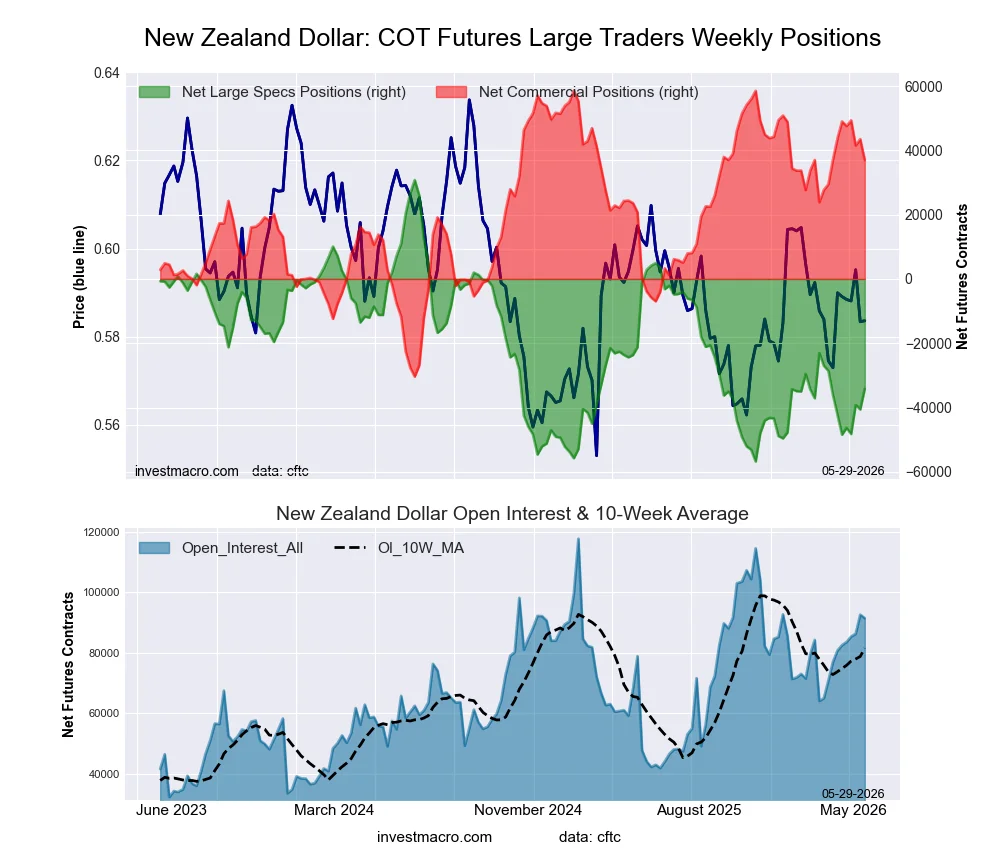
- New Zealand Dollar large speculator standing this week reached a net position of -40,613 contracts in the data reported through Tuesday.
- Weekly Speculator position lowering of -1,463 contracts from the previous week which had a total of -39,150 net contracts.
- This week’s current strength score (range over the past 3 years, measured from 0 to 100) shows the speculators are currently Bearish-Extreme with a score of 18.5 percent.
- The Commercials are Bullish-Extreme with a score of 83.0 percent.
- The Small Traders (not shown in chart) are Bearish-Extreme with a score of 14.8 percent.
Price Trend-Following Model: Downtrend
Our weekly trend-following model classifies the current market price position as: Downtrend.
| NEW ZEALAND DOLLAR Statistics | SPECULATORS | COMMERCIALS | SMALL TRADERS |
| – Percent of Open Interest Longs: | 13.3 | 83.1 | 3.1 |
| – Percent of Open Interest Shorts: | 57.2 | 36.1 | 6.2 |
| – Net Position: | -40,613 | 43,497 | -2,884 |
| – Gross Longs: | 12,319 | 76,920 | 2,879 |
| – Gross Shorts: | 52,932 | 33,423 | 5,763 |
| – Long to Short Ratio: | 0.2 to 1 | 2.3 to 1 | 0.5 to 1 |
| NET POSITION TREND: | | | |
| – Strength Index Score (3 Year Range Pct): | 18.5 | 83.0 | 14.8 |
| – Strength Index Reading (3 Year Range): | Bearish-Extreme | Bullish-Extreme | Bearish-Extreme |
| NET POSITION MOVEMENT INDEX: | | | |
| – 6-Week Change in Strength Index: | -5.2 | 7.2 | -24.6 |
Mexican Peso Futures:
 Positioning Notes:
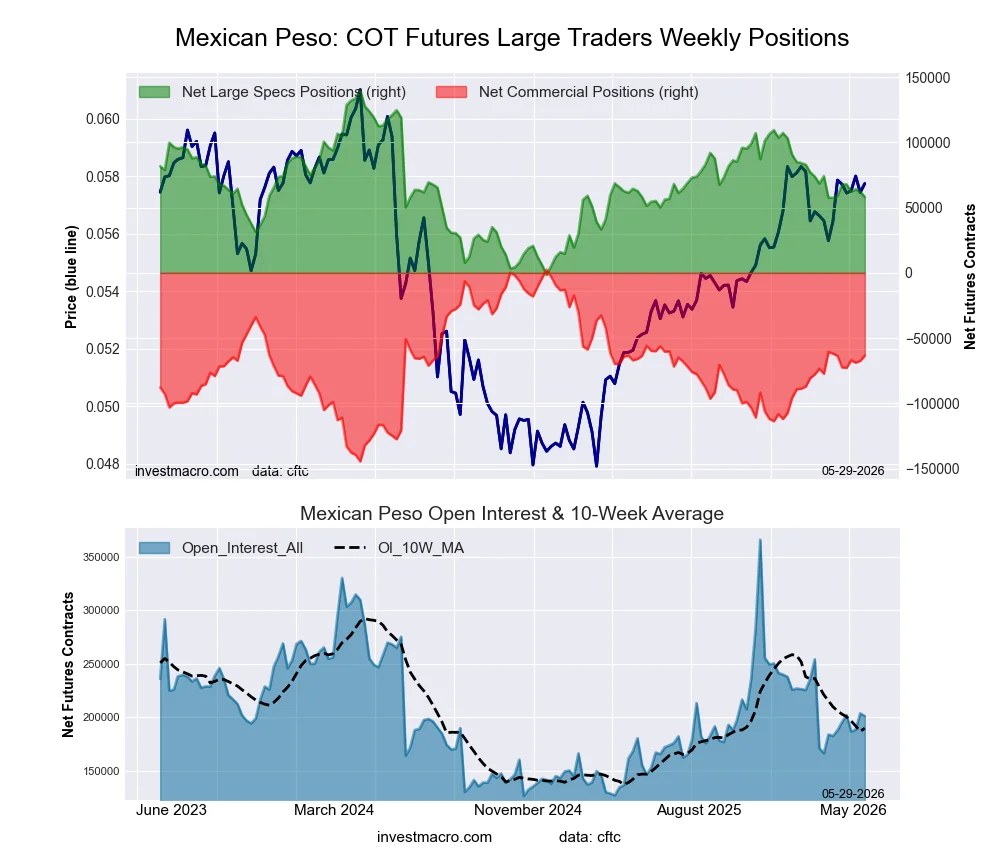
- Mexican Peso large speculator standing this week reached a net position of 62,249 contracts in the data reported through Tuesday.
- Weekly Speculator position decrease of -1,841 contracts from the previous week which had a total of 64,090 net contracts.
- This week’s current strength score (range over the past 3 years, measured from 0 to 100) shows the speculators are currently Bearish with a score of 45.2 percent.
- The Commercials are Bullish with a score of 52.5 percent.
- The Small Traders (not shown in chart) are Bullish with a score of 50.8 percent.
Price Trend-Following Model: Strong Uptrend
Our weekly trend-following model classifies the current market price position as: Strong Uptrend.
| MEXICAN PESO Statistics | SPECULATORS | COMMERCIALS | SMALL TRADERS |
| – Percent of Open Interest Longs: | 46.7 | 48.1 | 4.1 |
| – Percent of Open Interest Shorts: | 16.2 | 81.1 | 1.6 |
| – Net Position: | 62,249 | -67,299 | 5,050 |
| – Gross Longs: | 95,246 | 98,026 | 8,400 |
| – Gross Shorts: | 32,997 | 165,325 | 3,350 |
| – Long to Short Ratio: | 2.9 to 1 | 0.6 to 1 | 2.5 to 1 |
| NET POSITION TREND: | | | |
| – Strength Index Score (3 Year Range Pct): | 45.2 | 52.5 | 50.8 |
| – Strength Index Reading (3 Year Range): | Bearish | Bullish | Bullish |
| NET POSITION MOVEMENT INDEX: | | | |
| – 6-Week Change in Strength Index: | 3.4 | -3.8 | 4.1 |
Brazilian Real Futures:
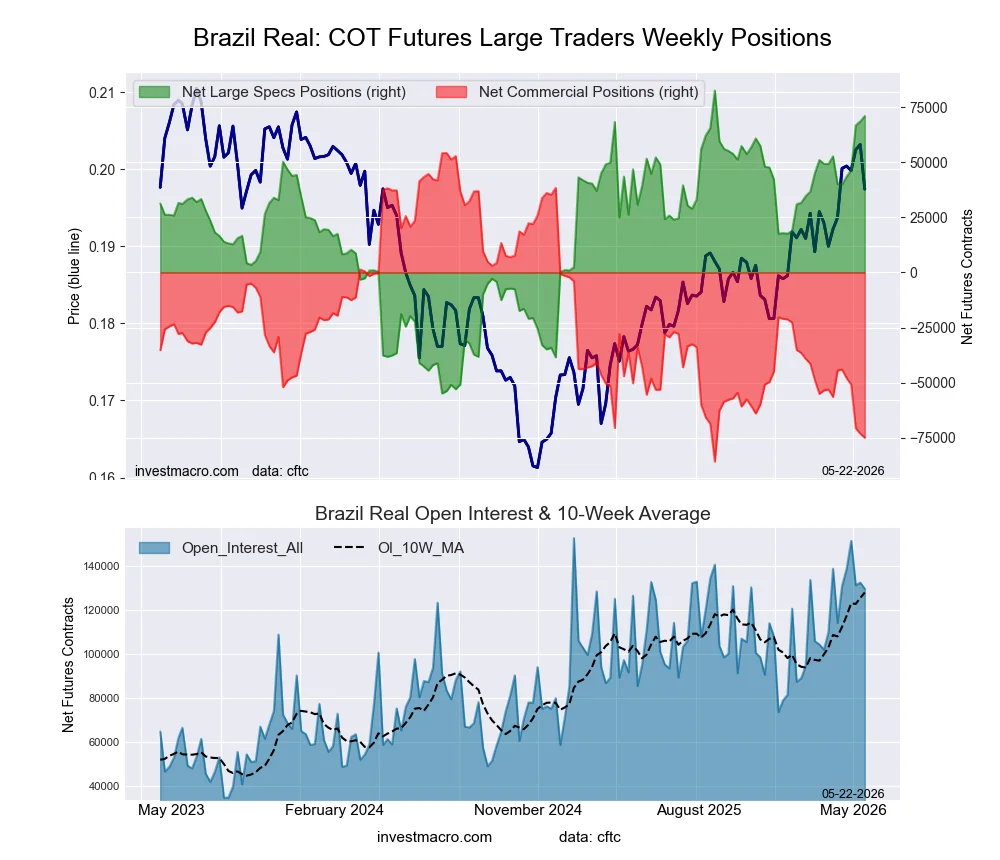 Positioning Notes:
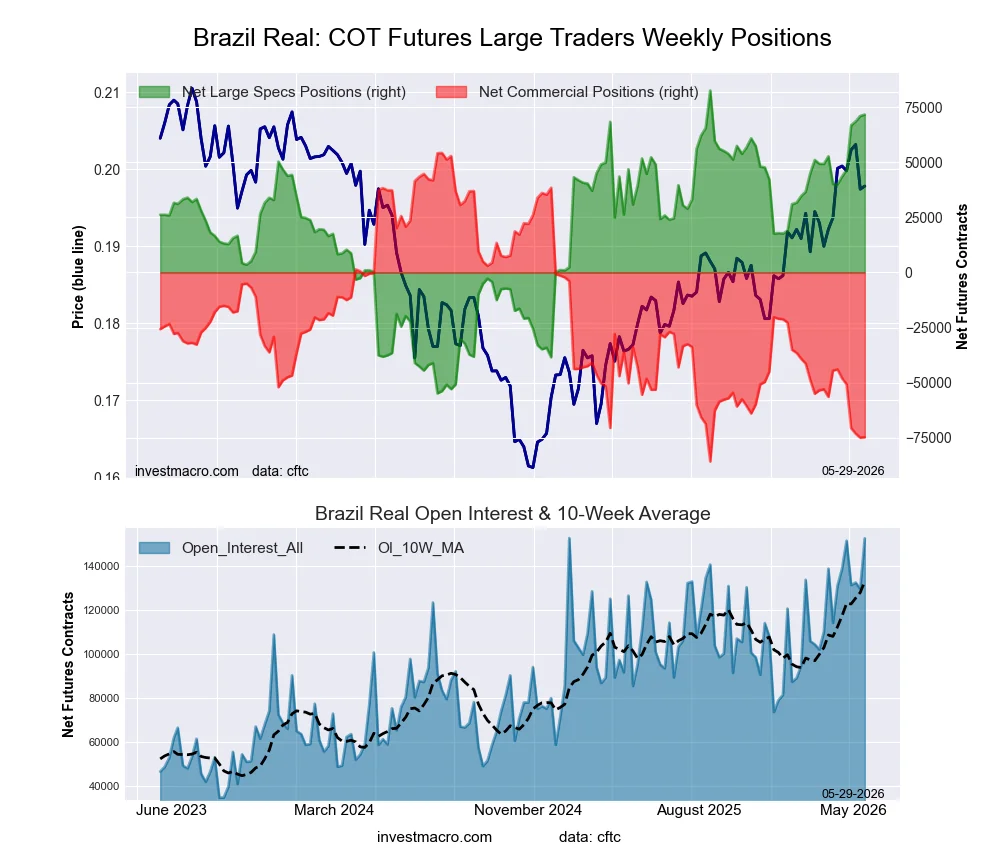
- Brazilian Real large speculator standing this week reached a net position of 71,012 contracts in the data reported through Tuesday.
- Weekly Speculator position gain of 2,459 contracts from the previous week which had a total of 68,553 net contracts.
- This week’s current strength score (range over the past 3 years, measured from 0 to 100) shows the speculators are currently Bullish-Extreme with a score of 91.6 percent.
- The Commercials are Bearish-Extreme with a score of 7.7 percent.
- The Small Traders (not shown in chart) are Bearish with a score of 43.3 percent.
Price Trend-Following Model: Uptrend
Our weekly trend-following model classifies the current market price position as: Uptrend.
| BRAZIL REAL Statistics | SPECULATORS | COMMERCIALS | SMALL TRADERS |
| – Percent of Open Interest Longs: | 73.8 | 21.6 | 3.9 |
| – Percent of Open Interest Shorts: | 18.9 | 79.6 | 0.8 |
| – Net Position: | 71,012 | -74,999 | 3,987 |
| – Gross Longs: | 95,462 | 27,975 | 5,037 |
| – Gross Shorts: | 24,450 | 102,974 | 1,050 |
| – Long to Short Ratio: | 3.9 to 1 | 0.3 to 1 | 4.8 to 1 |
| NET POSITION TREND: | | | |
| – Strength Index Score (3 Year Range Pct): | 91.6 | 7.7 | 43.3 |
| – Strength Index Reading (3 Year Range): | Bullish-Extreme | Bearish-Extreme | Bearish |
| NET POSITION MOVEMENT INDEX: | | | |
| – 6-Week Change in Strength Index: | 22.5 | -21.8 | -2.3 |
Bitcoin Futures:
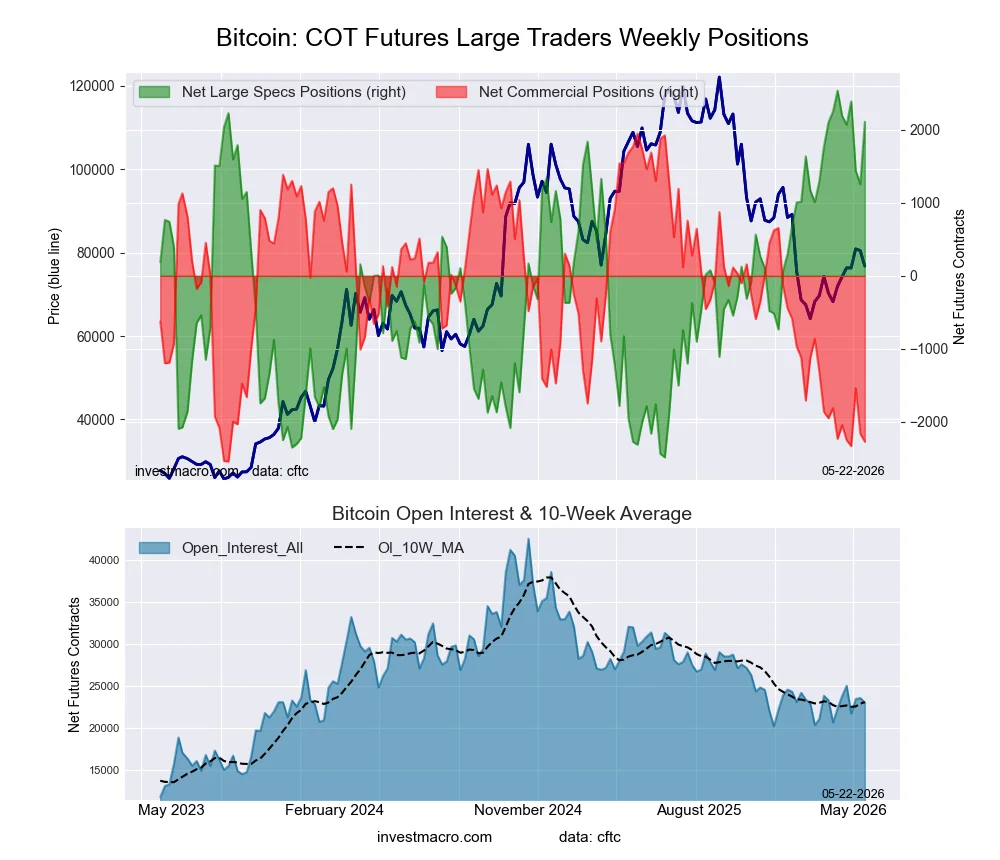 Positioning Notes:
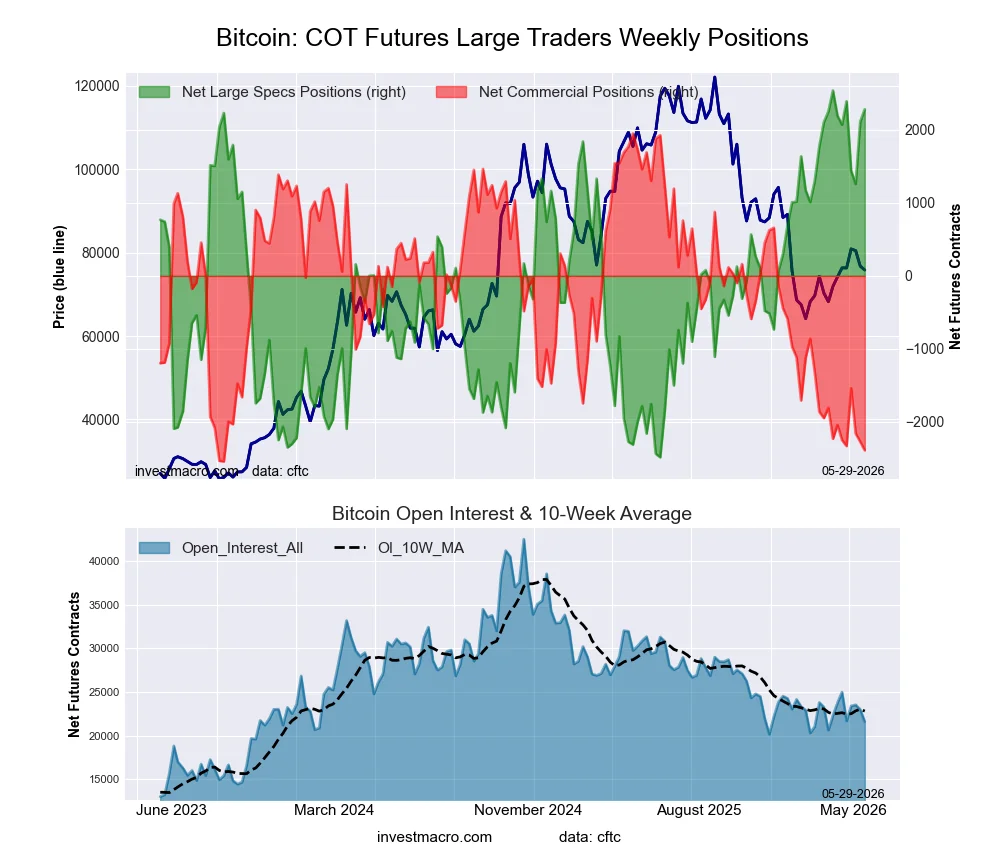
- Bitcoin large speculator standing this week reached a net position of 2,112 contracts in the data reported through Tuesday.
- Weekly Speculator position gain of 853 contracts from the previous week which had a total of 1,259 net contracts.
- This week’s current strength score (range over the past 3 years, measured from 0 to 100) shows the speculators are currently Bullish-Extreme with a score of 91.5 percent.
- The Commercials are Bearish-Extreme with a score of 6.0 percent.
- The Small Traders (not shown in chart) are Bearish with a score of 45.6 percent.
Price Trend-Following Model: Weak Downtrend
Our weekly trend-following model classifies the current market price position as: Weak Downtrend.
| BITCOIN Statistics | SPECULATORS | COMMERCIALS | SMALL TRADERS |
| – Percent of Open Interest Longs: | 77.4 | 0.9 | 5.5 |
| – Percent of Open Interest Shorts: | 68.2 | 10.8 | 4.8 |
| – Net Position: | 2,112 | -2,272 | 160 |
| – Gross Longs: | 17,791 | 212 | 1,262 |
| – Gross Shorts: | 15,679 | 2,484 | 1,102 |
| – Long to Short Ratio: | 1.1 to 1 | 0.1 to 1 | 1.1 to 1 |
| NET POSITION TREND: | | | |
| – Strength Index Score (3 Year Range Pct): | 91.5 | 6.0 | 45.6 |
| – Strength Index Reading (3 Year Range): | Bullish-Extreme | Bearish-Extreme | Bearish |
| NET POSITION MOVEMENT INDEX: | | | |
| – 6-Week Change in Strength Index: | -8.5 | -0.9 | 24.2 |
Article By InvestMacro – Receive our weekly COT Reports by Email
*COT Report: The COT data, released weekly to the public each Friday, is updated through the most recent Tuesday (data is 3 days old) and shows a quick view of how large speculators or non-commercials (for-profit traders) were positioned in the futures markets.
The CFTC categorizes trader positions according to commercial hedgers (traders who use futures contracts for hedging as part of the business), non-commercials (large traders who speculate to realize trading profits) and nonreportable traders (usually small traders/speculators) as well as their open interest (contracts open in the market at time of reporting).See CFTC criteria here.
All information and opinions on this website and contained in this article are for general informational purposes only and do not constitute investment advice.


 Future missions may sample environments that could host life, such as Saturn’s moon Enceladus.


