Archive for Opinions – Page 20

Euro Bets hit 83-week high, US Dollar Index Speculator Bets gain for 3rd Week

By InvestMacro

Speculators OI FX Futures COT ChartHere are the latest charts and statistics for the Commitment of Traders (COT) data published by the Commodities Futures Trading Commission (CFTC).

The latest COT data is updated through Tuesday July 15th and shows a quick view of how large market participants (for-profit speculators and commercial traders) were positioned in the futures markets. All currency positions are in direct relation to the US dollar where, for example, a bet for the euro is a bet that the euro will rise versus the dollar while a bet against the euro will be a bet that the euro will decline versus the dollar.

Weekly Speculator Changes led by EuroFX & US Dollar Index

Speculators Nets FX Futures COT Chart
The COT currency market speculator bets were decisively lower this week as two out of the eleven currency markets we cover had higher positioning while the other nine markets had lower speculator contracts.

Leading the gains for the currency markets was the EuroFX (7,625 contracts) with the US Dollar Index (321 contracts) also showing a positive week.

The currencies seeing declines in speculator bets on the week were the Brazilian Real (-24,798 contracts), the Japanese Yen (-12,573 contracts), the Mexican Peso (-4,956 contracts), the British Pound (-4,003 contracts), the Canadian Dollar (-2,486 contracts), the New Zealand Dollar (-1,286 contracts), the Australian Dollar (-605 contracts), the Swiss Franc (-441 contracts) and with Bitcoin (-50 contracts) also seeing lower bets on the week.

Euro Bets hit 83-week high, US Dollar Index Speculator Bets gain for 3rd Week

Highlighting the week for the currency markets this week was the Euro bets rising higher as well as a modest US Dollar Index comeback over the past three weeks.

The biggest mover with gains in speculative bets was the Euro which advanced for a second straight week and has now risen for eight out of the past ten weeks (for a 10-week improvement by +52,502 contracts). These gains have pushed the net speculator standing (currently at +128,221 contracts) to the highest level in 83-weeks, dating back to December 2023.

The US Dollar Index was the only other gainer in speculative bets on the week and the USD positions have risen for three straight weeks. Despite these gains, the US Dollar Index standing still remains in a small bearish position currently at -3,665 net contracts.

Elsewhere, the Brazilian Real saw a big drop in speculative positions by almost -25,000 contracts. The Brazilian Real positioning has been up and down over the last 10 weeks with big gains and big retreats. Currently, the Brazilian Real still has a positive net speculative position of almost +25,000 contracts.

The Japanese Yen saw another fall in speculator bets this week, with its overall net position standing at +103,582 contracts. This is down from the all-time high that was reached in April near +180,000 contracts. The Yen position has been clearly softening but still remains historically bullish with contracts over +100,000.

FX Price Changes this week

Overall, the Forex markets were pretty subdued in price changes for the week. The US Dollar Index was the only riser on the week and edged higher for a second week, up by approximately 0.70%. The Australian Dollar was the biggest decliner with a fall by over -1% on the week while the Japanese Yen was close to a -1% decline followed by the New Zealand Dollar, which fell by almost -0.75%.

The US Dollar Index has made some gains over the last two weeks but prices stalled out around 98.60 on the upside this week and settled back down to end the week at 98.20. The U.S. Dollar Index is still down by over 10% since the beginning of the year and remains under that 100.00 psychological price level.

The Japanese Yen’s price uptrend has stalled and the currency has now fallen for three straight weeks (vs the USD). Meanwhile, the other currencies like the Euro, British Pound Sterling, Swiss Franc, Canadian Dollar, New Zealand Dollar, Brazilian Real, Mexican Peso and the Australian Dollar all saw slight declines on the week but still trade close to their highest levels of the year.


Currencies Data:

Speculators FX Futures COT Data Table
Legend: Open Interest | Speculators Current Net Position | Weekly Specs Change | Specs Strength Score compared to last 3-Years (0-100 range)
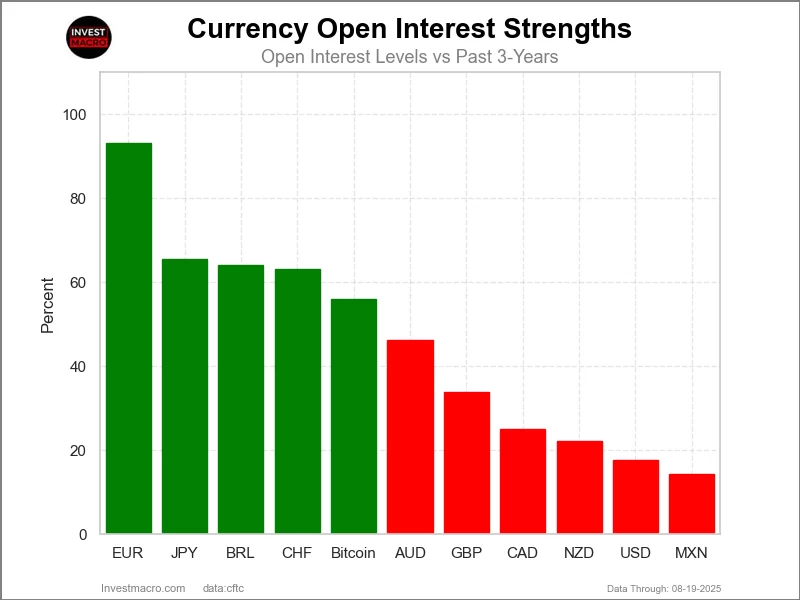

Strength Scores led by Japanese Yen & EuroFX

Speculators Strength Scores FX Futures COT Chart
COT Strength Scores (a normalized measure of Speculator positions over a 3-Year range, from 0 to 100 where above 80 is Extreme-Bullish and below 20 is Extreme-Bearish) showed that the Japanese Yen (79 percent) and the EuroFX (78 percent) lead the currency markets this week. The New Zealand Dollar (69 percent), Brazilian Real (64 percent) and the Swiss Franc (55 percent) come in as the next highest in the weekly strength scores.

On the downside, Bitcoin (0 percent) and the US Dollar Index (5 percent) come in at the lowest strength levels currently and are in Extreme-Bearish territory (below 20 percent). The next lowest strength scores are the Australian Dollar (23 percent) and the British Pound (46 percent).

3-Year Strength Statistics:
US Dollar Index (5.1 percent) vs US Dollar Index previous week (4.4 percent)
EuroFX (77.6 percent) vs EuroFX previous week (74.7 percent)
British Pound Sterling (46.3 percent) vs British Pound Sterling previous week (48.2 percent)
Japanese Yen (79.2 percent) vs Japanese Yen previous week (82.6 percent)
Swiss Franc (55.0 percent) vs Swiss Franc previous week (55.9 percent)
Canadian Dollar (54.8 percent) vs Canadian Dollar previous week (55.9 percent)
Australian Dollar (23.1 percent) vs Australian Dollar previous week (23.6 percent)
New Zealand Dollar (68.7 percent) vs New Zealand Dollar previous week (70.2 percent)
Mexican Peso (54.3 percent) vs Mexican Peso previous week (56.8 percent)
Brazilian Real (64.2 percent) vs Brazilian Real previous week (84.3 percent)
Bitcoin (0.0 percent) vs Bitcoin previous week (1.1 percent)


New Zealand Dollar & EuroFX top the 6-Week Strength Trends

Speculators Trends FX Futures COT Chart
COT Strength Score Trends (or move index, calculates the 6-week changes in strength scores) showed that the New Zealand Dollar (32 percent) and the EuroFX (17 percent) lead the past six weeks trends for the currencies. The Canadian Dollar (15 percent) and the Swiss Franc (7 percent) are the next highest positive movers in the 3-Year trends data.

The Japanese Yen (-13 percent) leads the downside trend scores currently with the US Dollar Index (-9 percent), Australian Dollar (-8 percent) and the Mexican Peso (-7 percent) following next with lower trend scores.

3-Year Strength Trends:
US Dollar Index (-9.2 percent) vs US Dollar Index previous week (-8.4 percent)
EuroFX (17.3 percent) vs EuroFX previous week (15.7 percent)
British Pound Sterling (-2.9 percent) vs British Pound Sterling previous week (-1.0 percent)
Japanese Yen (-13.1 percent) vs Japanese Yen previous week (-13.2 percent)
Swiss Franc (6.9 percent) vs Swiss Franc previous week (6.7 percent)
Canadian Dollar (15.4 percent) vs Canadian Dollar previous week (14.5 percent)
Australian Dollar (-8.3 percent) vs Australian Dollar previous week (-9.3 percent)
New Zealand Dollar (31.6 percent) vs New Zealand Dollar previous week (33.9 percent)
Mexican Peso (-7.3 percent) vs Mexican Peso previous week (-3.2 percent)
Brazilian Real (-5.4 percent) vs Brazilian Real previous week (1.7 percent)
Bitcoin (-3.7 percent) vs Bitcoin previous week (-3.4 percent)


Individual COT Forex Markets:

US Dollar Index Futures:

US Dollar Index Forex Futures COT ChartThe US Dollar Index large speculator standing this week totaled a net position of -3,665 contracts in the data reported through Tuesday. This was a weekly increase of 321 contracts from the previous week which had a total of -3,986 net contracts.

This week’s current strength score (the trader positioning range over the past three years, measured from 0 to 100) shows the speculators are currently Bearish-Extreme with a score of 5.1 percent. The commercials are Bullish-Extreme with a score of 95.4 percent and the small traders (not shown in chart) are Bearish with a score of 20.1 percent.

Price Trend-Following Model: Downtrend

Our weekly trend-following model classifies the current market price position as: Downtrend.

US DOLLAR INDEX StatisticsSPECULATORSCOMMERCIALSSMALL TRADERS
– Percent of Open Interest Longs:46.237.58.7
– Percent of Open Interest Shorts:56.624.910.9
– Net Position:-3,6654,422-757
– Gross Longs:16,26213,1863,065
– Gross Shorts:19,9278,7643,822
– Long to Short Ratio:0.8 to 11.5 to 10.8 to 1
NET POSITION TREND:
– Strength Index Score (3 Year Range Pct):5.195.420.1
– Strength Index Reading (3 Year Range):Bearish-ExtremeBullish-ExtremeBearish
NET POSITION MOVEMENT INDEX:
– 6-Week Change in Strength Index:-9.26.911.3


Euro Currency Futures:

Euro Currency Futures COT ChartThe Euro Currency large speculator standing this week totaled a net position of 128,221 contracts in the data reported through Tuesday. This was a weekly rise of 7,625 contracts from the previous week which had a total of 120,596 net contracts.

This week’s current strength score (the trader positioning range over the past three years, measured from 0 to 100) shows the speculators are currently Bullish with a score of 77.6 percent. The commercials are Bearish-Extreme with a score of 18.4 percent and the small traders (not shown in chart) are Bullish-Extreme with a score of 92.7 percent.

Price Trend-Following Model: Uptrend

Our weekly trend-following model classifies the current market price position as: Uptrend.

EURO Currency StatisticsSPECULATORSCOMMERCIALSSMALL TRADERS
– Percent of Open Interest Longs:29.555.011.9
– Percent of Open Interest Shorts:13.977.55.1
– Net Position:128,221-184,21555,994
– Gross Longs:242,096451,52597,608
– Gross Shorts:113,875635,74041,614
– Long to Short Ratio:2.1 to 10.7 to 12.3 to 1
NET POSITION TREND:
– Strength Index Score (3 Year Range Pct):77.618.492.7
– Strength Index Reading (3 Year Range):BullishBearish-ExtremeBullish-Extreme
NET POSITION MOVEMENT INDEX:
– 6-Week Change in Strength Index:17.3-15.71.0


British Pound Sterling Futures:

British Pound Sterling Futures COT ChartThe British Pound Sterling large speculator standing this week totaled a net position of 29,191 contracts in the data reported through Tuesday. This was a weekly fall of -4,003 contracts from the previous week which had a total of 33,194 net contracts.

This week’s current strength score (the trader positioning range over the past three years, measured from 0 to 100) shows the speculators are currently Bearish with a score of 46.3 percent. The commercials are Bearish with a score of 48.3 percent and the small traders (not shown in chart) are Bullish with a score of 79.6 percent.

Price Trend-Following Model: Uptrend

Our weekly trend-following model classifies the current market price position as: Uptrend.

BRITISH POUND StatisticsSPECULATORSCOMMERCIALSSMALL TRADERS
– Percent of Open Interest Longs:53.926.718.4
– Percent of Open Interest Shorts:38.346.714.0
– Net Position:29,191-37,4818,290
– Gross Longs:100,98049,93234,471
– Gross Shorts:71,78987,41326,181
– Long to Short Ratio:1.4 to 10.6 to 11.3 to 1
NET POSITION TREND:
– Strength Index Score (3 Year Range Pct):46.348.379.6
– Strength Index Reading (3 Year Range):BearishBearishBullish
NET POSITION MOVEMENT INDEX:
– 6-Week Change in Strength Index:-2.94.8-11.5


Japanese Yen Futures:

Japanese Yen Forex Futures COT ChartThe Japanese Yen large speculator standing this week totaled a net position of 103,582 contracts in the data reported through Tuesday. This was a weekly fall of -12,573 contracts from the previous week which had a total of 116,155 net contracts.

This week’s current strength score (the trader positioning range over the past three years, measured from 0 to 100) shows the speculators are currently Bullish with a score of 79.2 percent. The commercials are Bearish with a score of 23.0 percent and the small traders (not shown in chart) are Bullish with a score of 61.1 percent.

Price Trend-Following Model: Weak Uptrend

Our weekly trend-following model classifies the current market price position as: Weak Uptrend.

JAPANESE YEN StatisticsSPECULATORSCOMMERCIALSSMALL TRADERS
– Percent of Open Interest Longs:51.533.813.5
– Percent of Open Interest Shorts:19.368.311.2
– Net Position:103,582-110,8467,264
– Gross Longs:165,444108,74443,283
– Gross Shorts:61,862219,59036,019
– Long to Short Ratio:2.7 to 10.5 to 11.2 to 1
NET POSITION TREND:
– Strength Index Score (3 Year Range Pct):79.223.061.1
– Strength Index Reading (3 Year Range):BullishBearishBullish
NET POSITION MOVEMENT INDEX:
– 6-Week Change in Strength Index:-13.116.3-38.6


Swiss Franc Futures:

Swiss Franc Forex Futures COT ChartThe Swiss Franc large speculator standing this week totaled a net position of -22,637 contracts in the data reported through Tuesday. This was a weekly decrease of -441 contracts from the previous week which had a total of -22,196 net contracts.

This week’s current strength score (the trader positioning range over the past three years, measured from 0 to 100) shows the speculators are currently Bullish with a score of 55.0 percent. The commercials are Bearish with a score of 37.0 percent and the small traders (not shown in chart) are Bullish with a score of 77.2 percent.

Price Trend-Following Model: Uptrend

Our weekly trend-following model classifies the current market price position as: Uptrend.

SWISS FRANC StatisticsSPECULATORSCOMMERCIALSSMALL TRADERS
– Percent of Open Interest Longs:13.466.719.8
– Percent of Open Interest Shorts:43.935.720.3
– Net Position:-22,63723,016-379
– Gross Longs:9,95949,55914,677
– Gross Shorts:32,59626,54315,056
– Long to Short Ratio:0.3 to 11.9 to 11.0 to 1
NET POSITION TREND:
– Strength Index Score (3 Year Range Pct):55.037.077.2
– Strength Index Reading (3 Year Range):BullishBearishBullish
NET POSITION MOVEMENT INDEX:
– 6-Week Change in Strength Index:6.9-4.7-2.4


Canadian Dollar Futures:

The Canadian Dollar large speculator standing this week totaled a net position of -74,094 contracts in the data reported through Tuesday. This was a weekly reduction of -2,486 contracts from the previous week which had a total of -71,608 net contracts.

This week’s current strength score (the trader positioning range over the past three years, measured from 0 to 100) shows the speculators are currently Bullish with a score of 54.8 percent. The commercials are Bearish with a score of 44.5 percent and the small traders (not shown in chart) are Bearish with a score of 47.8 percent.

Price Trend-Following Model: Uptrend

Our weekly trend-following model classifies the current market price position as: Uptrend.

CANADIAN DOLLAR StatisticsSPECULATORSCOMMERCIALSSMALL TRADERS
– Percent of Open Interest Longs:10.869.613.7
– Percent of Open Interest Shorts:47.433.713.1
– Net Position:-74,09472,7661,328
– Gross Longs:21,924141,09327,836
– Gross Shorts:96,01868,32726,508
– Long to Short Ratio:0.2 to 12.1 to 11.1 to 1
NET POSITION TREND:
– Strength Index Score (3 Year Range Pct):54.844.547.8
– Strength Index Reading (3 Year Range):BullishBearishBearish
NET POSITION MOVEMENT INDEX:
– 6-Week Change in Strength Index:15.4-16.010.0


Australian Dollar Futures:

Australian Dollar Forex Futures COT ChartThe Australian Dollar large speculator standing this week totaled a net position of -74,919 contracts in the data reported through Tuesday. This was a weekly lowering of -605 contracts from the previous week which had a total of -74,314 net contracts.

This week’s current strength score (the trader positioning range over the past three years, measured from 0 to 100) shows the speculators are currently Bearish with a score of 23.1 percent. The commercials are Bullish with a score of 73.2 percent and the small traders (not shown in chart) are Bullish with a score of 55.4 percent.

Price Trend-Following Model: Uptrend

Our weekly trend-following model classifies the current market price position as: Uptrend.

AUSTRALIAN DOLLAR StatisticsSPECULATORSCOMMERCIALSSMALL TRADERS
– Percent of Open Interest Longs:14.164.516.0
– Percent of Open Interest Shorts:63.916.314.4
– Net Position:-74,91972,5282,391
– Gross Longs:21,23397,06324,040
– Gross Shorts:96,15224,53521,649
– Long to Short Ratio:0.2 to 14.0 to 11.1 to 1
NET POSITION TREND:
– Strength Index Score (3 Year Range Pct):23.173.255.4
– Strength Index Reading (3 Year Range):BearishBullishBullish
NET POSITION MOVEMENT INDEX:
– 6-Week Change in Strength Index:-8.36.81.1


New Zealand Dollar Futures:

New Zealand Dollar Forex Futures COT ChartThe New Zealand Dollar large speculator standing this week totaled a net position of 3,635 contracts in the data reported through Tuesday. This was a weekly fall of -1,286 contracts from the previous week which had a total of 4,921 net contracts.

This week’s current strength score (the trader positioning range over the past three years, measured from 0 to 100) shows the speculators are currently Bullish with a score of 68.7 percent. The commercials are Bearish with a score of 29.6 percent and the small traders (not shown in chart) are Bullish with a score of 58.1 percent.

Price Trend-Following Model: Uptrend

Our weekly trend-following model classifies the current market price position as: Uptrend.

NEW ZEALAND DOLLAR StatisticsSPECULATORSCOMMERCIALSSMALL TRADERS
– Percent of Open Interest Longs:39.638.210.6
– Percent of Open Interest Shorts:31.047.89.7
– Net Position:3,635-4,003368
– Gross Longs:16,62316,0414,429
– Gross Shorts:12,98820,0444,061
– Long to Short Ratio:1.3 to 10.8 to 11.1 to 1
NET POSITION TREND:
– Strength Index Score (3 Year Range Pct):68.729.658.1
– Strength Index Reading (3 Year Range):BullishBearishBullish
NET POSITION MOVEMENT INDEX:
– 6-Week Change in Strength Index:31.6-31.03.8


Mexican Peso Futures:

Mexican Peso Futures COT ChartThe Mexican Peso large speculator standing this week totaled a net position of 50,122 contracts in the data reported through Tuesday. This was a weekly lowering of -4,956 contracts from the previous week which had a total of 55,078 net contracts.

This week’s current strength score (the trader positioning range over the past three years, measured from 0 to 100) shows the speculators are currently Bullish with a score of 54.3 percent. The commercials are Bearish with a score of 45.3 percent and the small traders (not shown in chart) are Bullish with a score of 56.3 percent.

Price Trend-Following Model: Uptrend

Our weekly trend-following model classifies the current market price position as: Uptrend.

MEXICAN PESO StatisticsSPECULATORSCOMMERCIALSSMALL TRADERS
– Percent of Open Interest Longs:55.738.65.3
– Percent of Open Interest Shorts:25.572.51.7
– Net Position:50,122-56,1736,051
– Gross Longs:92,33263,9818,820
– Gross Shorts:42,210120,1542,769
– Long to Short Ratio:2.2 to 10.5 to 13.2 to 1
NET POSITION TREND:
– Strength Index Score (3 Year Range Pct):54.345.356.3
– Strength Index Reading (3 Year Range):BullishBearishBullish
NET POSITION MOVEMENT INDEX:
– 6-Week Change in Strength Index:-7.35.519.7


Brazilian Real Futures:

Brazil Real Futures COT ChartThe Brazilian Real large speculator standing this week totaled a net position of 24,172 contracts in the data reported through Tuesday. This was a weekly lowering of -24,798 contracts from the previous week which had a total of 48,970 net contracts.

This week’s current strength score (the trader positioning range over the past three years, measured from 0 to 100) shows the speculators are currently Bullish with a score of 64.2 percent. The commercials are Bearish with a score of 34.1 percent and the small traders (not shown in chart) are Bearish with a score of 42.8 percent.

Price Trend-Following Model: Uptrend

Our weekly trend-following model classifies the current market price position as: Uptrend.

BRAZIL REAL StatisticsSPECULATORSCOMMERCIALSSMALL TRADERS
– Percent of Open Interest Longs:63.930.45.0
– Percent of Open Interest Shorts:38.559.90.9
– Net Position:24,172-28,0683,896
– Gross Longs:60,80928,9654,761
– Gross Shorts:36,63757,033865
– Long to Short Ratio:1.7 to 10.5 to 15.5 to 1
NET POSITION TREND:
– Strength Index Score (3 Year Range Pct):64.234.142.8
– Strength Index Reading (3 Year Range):BullishBearishBearish
NET POSITION MOVEMENT INDEX:
– 6-Week Change in Strength Index:-5.44.74.3


Bitcoin Futures:

Bitcoin Crypto Futures COT ChartThe Bitcoin large speculator standing this week totaled a net position of -2,486 contracts in the data reported through Tuesday. This was a weekly lowering of -50 contracts from the previous week which had a total of -2,436 net contracts.

This week’s current strength score (the trader positioning range over the past three years, measured from 0 to 100) shows the speculators are currently Bearish-Extreme with a score of 0.0 percent. The commercials are Bullish-Extreme with a score of 99.5 percent and the small traders (not shown in chart) are Bullish with a score of 66.3 percent.

Price Trend-Following Model: Strong Uptrend

Our weekly trend-following model classifies the current market price position as: Strong Uptrend.

BITCOIN StatisticsSPECULATORSCOMMERCIALSSMALL TRADERS
– Percent of Open Interest Longs:77.67.35.2
– Percent of Open Interest Shorts:85.51.13.4
– Net Position:-2,4861,927559
– Gross Longs:24,2822,2871,629
– Gross Shorts:26,7683601,070
– Long to Short Ratio:0.9 to 16.4 to 11.5 to 1
NET POSITION TREND:
– Strength Index Score (3 Year Range Pct):0.099.566.3
– Strength Index Reading (3 Year Range):Bearish-ExtremeBullish-ExtremeBullish
NET POSITION MOVEMENT INDEX:
– 6-Week Change in Strength Index:-3.7-0.510.2


Article By InvestMacroReceive our weekly COT Newsletter

*COT Report: The COT data, released weekly to the public each Friday, is updated through the most recent Tuesday (data is 3 days old) and shows a quick view of how large speculators or non-commercials (for-profit traders) were positioned in the futures markets.

The CFTC categorizes trader positions according to commercial hedgers (traders who use futures contracts for hedging as part of the business), non-commercials (large traders who speculate to realize trading profits) and nonreportable traders (usually small traders/speculators) as well as their open interest (contracts open in the market at time of reporting). See CFTC criteria here.

Speculator Extremes: Nasdaq, Silver & Lean Hogs lead weekly Bullish Positions

By InvestMacro 

The latest update for the weekly Commitment of Traders (COT) report was released by the Commodity Futures Trading Commission (CFTC) on Friday for data ending on July 15th.

This weekly Extreme Positions report highlights the Most Bullish and Most Bearish Positions for the speculator category. Extreme positioning in these markets can foreshadow strong moves in the underlying market.

To signify an extreme position, we use the Strength Index (also known as the COT Index) of each instrument, a common method of measuring COT data. The Strength Index is simply a comparison of current trader positions against the range of positions over the previous 3 years. We use over 80 percent as extremely bullish and under 20 percent as extremely bearish. (Compare Strength Index scores across all markets in the data table or cot leaders table)


Extreme Bullish Speculator Table


Here Are This Week’s Most Bullish Speculator Positions:

Nasdaq

Extreme Bullish Leader

The Nasdaq speculator position comes in as the most bullish extreme standing this week with the Nasdaq-Mini speculator level now at a 93 percent score of its 3-year range.

The six-week trend for the percent strength score was a rise of 31 percentage points this week. The overall speculator position registered 34,892 net contracts this week with a weekly gain of 3,681 contracts in speculator bets.


Speculators or Non-Commercials Notes:

Speculators, classified as non-commercial traders by the CFTC, are made up of large commodity funds, hedge funds and other significant for-profit participants. The Specs are generally regarded as trend-followers in their behavior towards price action – net speculator bets and prices tend to go in the same directions. These traders often look to buy when prices are rising and sell when prices are falling. To illustrate this point, many times speculator contracts can be found at their most extremes (bullish or bearish) when prices are also close to their highest or lowest levels.

These extreme levels can be dangerous for the large speculators as the trade is most crowded, there is less trading ammunition still sitting on the sidelines to push the trend further and prices have moved a significant distance. When the trend becomes exhausted, some speculators take profits while others look to also exit positions when prices fail to continue in the same direction. This process usually plays out over many months to years and can ultimately create a reverse effect where prices start to fall and speculators start a process of selling when prices are falling.


Silver

Extreme Bullish Leader
The Silver speculator position comes up number two in the extreme standings this week. The Silver speculator level is at a 90 percent score of its 3-year range.

The six-week trend for the speculator strength score totaled a change of -2 points this week. The overall speculator position was 59,448 net contracts this week with a small increase by 927 contracts in the speculator bets.


Lean Hogs

Extreme Bullish Leader
The Lean Hogs speculator position comes in next this week in the extreme standings as the Lean Hogs speculator level resides at 90 percent score of its 3-year range.

The six-week trend for the speculator strength score came in at a rise of 12 percentage points this week. The overall speculator position was 82,803 net contracts this week with a change of -8,097 contracts in the weekly speculator bets.


MSCI EAFE MINI

Extreme Bullish Leader
The MSCI EAFE MINI speculator position shows up next in this week’s bullish extreme standings. The MSCI EAFE-Mini speculator level sits at a 88 percent score of its 3-year range. The six-week trend for the speculator strength score was a decline of -4 points this week.

The speculator position was -873 net contracts this week with a drop by -3,971 contracts in the weekly speculator bets.


Ultra U.S. Treasury Bonds


The Ultra U.S. Treasury Bonds speculator position rounds out the top scores in this week’s bullish extreme standings. The Ultra Long T-Bond speculator level sits at a 85 percent score of its 3-year range. The six-week trend for the speculator strength score showed no change this week.

The speculator position was -228,618 net contracts this week with a decline of -5,794 contracts in the weekly speculator bets.


Extreme Bearish Speculator Table


This Week’s Most Bearish Speculator Positions:

Bitcoin

Extreme Bearish Leader
The Bitcoin speculator position comes in as the most bearish extreme standing this week. The Bitcoin speculator level is at a 0 percent score of its 3-year range.

The six-week trend for the speculator strength score was a dip by -4 points this week. The overall speculator position was -2,486 net contracts this week with a dip of -50 contracts in the speculator bets. With the Bitcoin price hitting all-time highs, the weak speculator positioning indicates that speculators may be hedging contracts in the futures market to protect themselves from price declines.


5-Year Bond

Extreme Bearish Leader
The 5-Year Bond speculator position comes in next for the most bearish extreme standing on the week with the 5-Year speculator level is at just 1 percent score of its 3-year range.

The six-week trend for the speculator strength score was a decline by -5 points this week. The speculator position was -2,505,528 net contracts this week with a rise of 11,259 contracts in the weekly speculator bets.


Soybean Meal

Extreme Bearish Leader
The Soybean Meal speculator position comes in as third most bearish extreme standing of the week. The Soybean Meal speculator level resides at a 3 percent score of its 3-year range.

The six-week trend for the speculator strength score was a decrease by -10 percentage points this week. The overall speculator position was -79,742 net contracts this week with an increase by 5,859 contracts in the speculator bets.


Sugar

Extreme Bearish Leader
The Sugar speculator position comes in as this week’s fourth most bearish extreme standing. The Sugar speculator level is at a 4 percent score of its 3-year range.

The six-week trend for the speculator strength score was -14 percentage points this week. The speculator position was -52,099 net contracts this week with a boost of 8,352 contracts in the weekly speculator bets.


US Dollar Index

Extreme Bearish Leader
Next, the US Dollar Index speculator position comes in as the fifth most bearish extreme standing for this week. The USD Index speculator level is at a 5 percent score of its 3-year range.

The six-week trend for the speculator strength score was -9 percentage points this week. The speculator position was -3,665 net contracts this week with an edge higher by 321 contracts in the weekly speculator bets.


Ultra 10-Year


Finally, the Ultra 10-Year speculator position comes in as the next most bearish extreme standing for this week. The Ultra 10-Year speculator level is at just a 7 percent score of its 3-year range.

The six-week trend for the speculator strength score was a dip by -2 percentage points this week while the speculator position was -379,116 net contracts this week with a jump of 29,162 contracts in the weekly speculator bets.


Article By InvestMacroReceive our weekly COT Reports by Email

*COT Report: The COT data, released weekly to the public each Friday, is updated through the most recent Tuesday (data is 3 days old) and shows a quick view of how large speculators or non-commercials (for-profit traders) were positioned in the futures markets.

The CFTC categorizes trader positions according to commercial hedgers (traders who use futures contracts for hedging as part of the business), non-commercials (large traders who speculate to realize trading profits) and nonreportable traders (usually small traders/speculators) as well as their open interest (contracts open in the market at time of reporting).See CFTC criteria here.

All information and opinions on this website and contained in this article are for general informational purposes only and do not constitute investment advice.

Week Ahead: Alphabet & Tesla in focus as “MAG 7” earnings kick off

By ForexTime 

  • 2 of ‘Magnificent 7’ set to publish earnings on Wednesday 
  • Alphabet ↑ 4% month-to-date, 11% away from ATH
  • Tesla ↓ 21% year-to-date
  • Alphabet: Shares could move 5.3% ↑ or ↓ post earnings
  • Tesla: Shares could move 5.6% ↑ or ↓ post earnings

The week ahead is stacked with high-impact events and corporate earnings from the largest companies in the world:

Sunday, 20th July 

  • JP225: Japan upper house election

Monday, 21st July 

  • CN50: China loan prime rates
  • NZD: New Zealand CPI
  • UK100: UK Prime Minister Keir Starmer speech
  • USDInd: US Conference Board leading index

Tuesday, 22nd July

  • AUD: RBA meeting minutes
  • NZD: New Zealand trade
  • NGN: Nigeria rate decision
  • TWN: Taiwan export orders, jobless rate
  • US500: US Richmond Fed manufacturing index, Fed Chair Jerome Powell speech

Wednesday, 23rd July

  • EUR: Eurozone consumer confidence
  • TWN: Taiwan industrial production
  • USDInd: US existing home sales
  • NAS100: Alphabet, Tesla earnings
  • President Donald Trump speech on A.I.

Thursday, 24th July

  • CAD: Canada retail sales
  • EUR: ECB rate decision, Germany PMI & Consumer confidence
  • JPY: Japan S&P Global Manufacturing PMI
  • UK100: UK S&P Global Manufacturing PMI, Gfk Consumer Confidence
  • US500: Initial jobless claims, S&P Global Manufacturing PMI, Intel earnings

Friday, 25th July

  • GER40: Germany IFO business climate, Volkswagen earnings
  • UK100: UK retail sales
  • EUR: ECB survey of professional forecasters
  • JPY: Japan Tokyo CPI
  • SG20: Singapore industrial production

Earnings season is in full swing with US banks reporting strong results. Next up will be results from big tech companies, which may inject fresh volatility into US equity markets.

Two of the so-called ‘Magnificent 7’ tech titans will be under the spotlight.


1)  Alphabet

Alphabet, the parent company of Google reports its second-quarter earnings on Wednesday 23rd July after US markets close. 

Its shares gained 14% in Q2 amid strong AI product demand and growth in the cloud business. However, bulls may need a fresh catalyst to push Alphabet’s year-to-date gains out of the red. 

This could come in the form of strong earnings and robust advertising revenue growth.

Beyond earnings, updates on its cloud, ad business and AI innovations will be in focus. 

Markets are forecasting a 5.3% move, either up or down, for Alphabet stocks post earnings.

Imagen
Alphabet

2) Tesla

Tesla is also set to release its second-quarter earnings on Wednesday after the close of US trading.

It’s been a rough year for the EV maker thanks to the political drama between Elon Musk and Donald Trump. Earlier this month, Trump threatened to withdraw government subsidies from Elon Musk’s companies – further weighing on Tesla shares.

Tesla is down over 20% year-to-date and could extend losses if its latest quarterly results are below market expectations.

Markets are forecasting a 5.6% move, either up or down, for Tesla stocks post-earnings.

Imagen
Tesla


What does this mean for FXTM’s NAS100

  • FXTM’s NAS100 tracks the underlying benchmark Nasdaq 100 index.
  • Alphabet and Tesla are part of the top 10 constituents, making up just over 10% of its weight. 
  • The index is up 10% since the start of 2025, recently hitting a fresh all-time high above 23100.
  •  Key levels of interest can be found at 23500, 23000 & 22600.
Imagen
NAS100
 

Forex-Time-LogoArticle by ForexTime

ForexTime Ltd (FXTM) is an award winning international online forex broker regulated by CySEC 185/12 www.forextime.com

TSMC hits record high ahead of earnings release

By ForexTime 

  • US-listed TSMC shares ↑ 20% YTD 
  • Shares hit new all-time highs on Tuesday
  • Forward guidance for Q3 in focus
  • TSMC makes up over 20% of FXTM’s TWN index
  • Technical levels for TSMC – $240, $225 and $218

US-listed shares of Taiwan Semiconductor Manufacturing (TSMC) surged to a fresh all-time high on Tuesday!

Note: TSMC shares can be traded on the Taiwan Stock Exchange (TWSE) and New York Stock Exchange (NYSE).

These gains have further solidified TSMC’s trillion-dollar valuation with sentiment firmly bullish after revenues rose a better-than-anticipated 39% in Q2.  Its shares are up 20% year-to-date, adding to the 90% gains secured in 2024.

Most importantly, the chipmaker is a key supplier to Nvidia, which has achieved a $4 trillion market valuation. This welcome development, along with a positive earnings report could push the company’s stock to fresh records. 


When will earnings be published?

  • TSMC will report second-quarter earnings on Thursday 17th before US markets open.


Market expectations

  • The chipmaker is expected to post earnings of $2.50 per share, with Q2 revenues rising to $31.70 billion from $20.82 billion in the prior year, marking a 52% increase.


What to watch out for

  • TSMC remains exposed to Trump’s tariff drama, with Taiwan hit with a steep tariff of 32% effective from August 1st.
  • Although Taiwan is said to be entering the final stages of a trade deal with the United States, the clock is ticking. The CEO of TSMC stated that tariffs had some impact on TSMC but not directly because tariffs are imposed on importers not exporters.
  • It will also be interesting to see if anything is mentioned about Nvidia winning approval from the Trump administration to sell its AI chips to China. 


What does this mean for FXTM’s TWN index.

  • FXTM’s TWN index tracks the underlying FTSE Taiwan RIC Capped Index. 
  • And TSMC makes up just over 20% of the index weight, meaning that the upcoming earnings could result in heightened volatility.
  • The index is up nearly 3% this month but still flat year-to-date. Prices have been trending higher in recent weeks with the all-time high roughly 7% away at 2049. 
  • Key levels of interest can be found at 1970, 1900 and 1830.
Imagen
TWNn

How will TSMC shares react?

  • Markets are forecasting a 1.5% move, either up or down, for TSMC stocks on Thursday post earnings.


Technical picture

TSMC shares are firmly bullish on the daily charts with prices trading above the 50, 100 and 200-day SMA. However, the Relative Strength Index (RSI) is near 70 – signaling that prices may be overbought.

  • A decline below $225.00 may see prices test $218 and the 50-day SMA at $206.
  • Should $225 prove to be reliable support, this may open a path toward fresh all-time highs at $240 and beyond.
Imagen
TSMmm

Forex-Time-LogoArticle by ForexTime

ForexTime Ltd (FXTM) is an award winning international online forex broker regulated by CySEC 185/12 www.forextime.com

Week Ahead: Looming “golden cross” teases US30 bulls

By ForexTime 

  • US30 ↑ roughly 5% year-to-date, less than 2% away from ATH
  • Trump tariff drama + US CPI + big bank earnings = volatility?
  • JPMorgan & Goldman Sachs = almost 14% of US30 weight 
  • US30 forecasted to move ↑ 0.8% or ↓ 1.4% post CPI 
  • Technical levels: 45000, 44200 & 44000

A flurry of high-risk events may pump FXTM’s US30 with fresh volatility next week.

Prices have been in a range since the start of July amid the ongoing uncertainty around Trump’s tariffs. Just yesterday, Trump threatened Canada with 35% tariffs and 15% to 20% blanket levies on most trade partners.

Note: FXTM’s US30 tracks the benchmark Dow Jones Industrial Average index.

Top-tier data, including the US inflation report and earnings from big US banks, could present new trading opportunities:

Monday, 14th July 

  • CN50: China trade
  • JP225: Japan machinery orders, industrial production
  • BITCOIN: Crypto week kicks off

Tuesday, 15th July 

  • CN50: China GDP, retail sales, industrial production
  • AUD: Australia Westpac consumer confidence
  • CAD: Canada CPI, housing starts
  • GER40: Germany ZEW survey expectations
  • GBP: BOE Governor Andrew Bailey speech
  • US30: US June CPI, Empire State Manufacturing, JPMorgan Chase earnings, Fed speech
  • US500: Wells Fargo, Citigroup earnings

Wednesday, 16th July

  • ZAR: South Africa retail sales
  • UK100: UK CPI
  • US30: US PPI, industrial production, Goldman Sachs earnings, Fed Beige book, Fed speech
  • US500: Bank of America, Morgan Stanley earnings

Thursday, 17th July 

  • AUD: Australia unemployment
  • EUR: Eurozone CPI, ECB blackout period
  • NZD: New Zealand food prices
  • GBP: UK jobless claims, unemployment
  • US30: US retail sales, initial jobless claims, Philadelphia Fed factory index, business inventories
  • TWN: TSMC earnings

Friday, 18th July  

  • JPY: Japan CPI
  • USDInd: US housing starts, University of Michigan consumer sentiment

FXTM’s US30 is up roughly 5% year-to-date, with prices trading less than 2% away from the all-time high at 45156.2.

Imagen
US30 - W1


Here are 3 factors that may rock the US30:


1) US bank earnings

Second-quarter earnings season unofficially kicks off on Tuesday 15th July, led by banking giants JPMorgan, Citigroup and Wells Fargo. Goldman Sachs, Bank of America, and Morgan Stanley report their earnings the day after.

US banks are expected to report strong earnings amid relaxed capital requirements, an increase in trading revenues and high interest rates.

It is worth noting that financials make up almost 27% of the US30’s weight with JPMorgan and Goldman Sachs accounting for nearly 14%!

So, the upcoming earnings from US banks are a big deal for the index.

  • Markets are forecasting a 3.2% move, either Up or Down, for JPMorgan Chase stocks post-earnings
  • Markets are forecasting a 3.5% move, either Up or Down, for Goldman Sachs stocks post-earnings.


2) US June CPI report – Tuesday 15th July

The incoming US Consumer Price Index (CPI) may impact bets around Fed cuts in the second half of this year.

Markets are forecasting:

  • CPI year-on-year (July 2025 vs. July 2024) to rise 2.6% from 2.4% in the prior month.
  • Core CPI year-on-year to rise 2.9% from 2.8%.
  • CPI month-on-month (July 2025 vs June 2024) to rise 0.3% from 0.1%
  • Core CPI month-on-month to rise 0.3% from 0.1% in the prior month

Signs of rising inflation pressures may shave bets around the Fed cutting interest rates.

Note: Speeches from various Fed officials and key US data, including PPI, retail sales, and the Beige Book, may impact the US30 after the CPI report on Tuesday. 

US30 is forecast to move 0.8% up or 1.4% down in a 6-hour window after the US CPI report.


3) Technical forces

The US30 remains bullish on the daily charts with a potential “golden cross” pattern in the making.

This is A technical event, when an asset’s 50-day simple moving average (SMA) crosses above its 200-day SMA. Such a development is seen as a bullish sign that prices will rise further. 

Nevertheless, the Relative Strength Index (RSI) is trading near oversold territory. 

  • Should 44200/44000 prove reliable support regions, prices may rebound back toward 45000 and the all-time high at 45156.
  • Sustained weakness below 44000 may open a path back toward 43500.
Imagen
US30    d1

Forex-Time-LogoArticle by ForexTime

ForexTime Ltd (FXTM) is an award winning international online forex broker regulated by CySEC 185/12 www.forextime.com

Does Gold Have Much Farther To Run?

Source: Clive Maund (7/10/25)

Technical Analyst Clive Maund shares his thoughts on where he believes gold is headed. 

Gold has made impressive gains so far this year, but when it spiked up to touch $3500 in the middle of April it become heavily overbought which is why it then went into a rectangular consolidation pattern that has given time for the overbought condition to fully unwind, as shown by the MACD indicator on its 6-month chart below, and has also allowed its moving averages to catch up, especially the 50-day which has now fully closed the gap with the price.

Because there is still a considerable gap with the 200-day it means that there is room for the price to break down from the Rectangle and correct back towards or to this average. In attempting to weigh the probability of this happening versus the price instead breaking out upside from the Rectangle, we need to inspect the volume pattern and volume indicators, which normally provide valuable clues in a situation like this.

However, volume and volume indicators are no longer provided by Stockcharts for the metals but we can get around this problem by using a chart for the same time period for reliable gold proxy SPDR Gold Shares, whose chart is almost identical, which does show volume and volume indicators.

So, on the 6-month chart for SPDR Gold Shares, we see that, while the volume pattern is a little hard to decipher, the Accumulation line has continued to trend higher from the April peak as the price has tracked sideways and has even made new highs in recent days.

This is bullish and implies that, rather than breaking lower into a correction, GLD and thus gold itself will instead break higher into a new upleg. If it does break lower a likely scenario is that a short, sharp drop is followed by a rapid reversal to the upside.

Zooming out now to look at gold on a longer-term 6-year log scale chart we see that it broke out early last year from a big trading range to commence a powerful uptrend — an uptrend that remains very much in force, with the price still well above the lower rail of the channel — even if it broke down from the Rectangle shown on the chart above and dropped to the $3100 level it would not violate this channel.

On this chart, we can better see just how overbought gold got last April, hence the trading range that has since formed that we looked at above.

Zooming out again via a very long-term log-scale chart going all the way back to the start of the millennium, i.e., to the year 2000, affords us an overall Big Picture perspective.

This chart makes clear that the breakout early last year from the large trading range that started to form in the middle of 2020 actually marked the breakout from the Handle of a gigantic Cup & Handle continuation pattern that started to form as far back as 2012.

This is a truly enormous consolidation pattern that certainly has the capability to support a correspondingly big bull market and as we are only about 16 months into this major new bull market, it clearly has much further to run.

In conclusion, we are looking for a breakout from the current rectangular trading range that has formed from April into another major upleg. If gold should instead break down from this range and correct back towards or to its rising 200-day moving average and the lower rail of its uptrend channel, it should then reverse back to the upside into a vigorous uptrend.

Volume indicators are suggesting that the former scenario — a breakout into another upleg from the trading range without any further corrective action first — is more likely to prevail.


Important Disclosures:

  1. Statements and opinions expressed are the opinions of the author and not of Streetwise Reports, Street Smart, or their officers. The author is wholly responsible for the accuracy of the statements. Streetwise Reports was not paid by the author to publish or syndicate this article. Streetwise Reports requires contributing authors to disclose any shareholdings in, or economic relationships with, companies that they write about. Any disclosures from the author can be found  below. Streetwise Reports relies upon the authors to accurately provide this information and Streetwise Reports has no means of verifying its accuracy.
  2. This article does not constitute investment advice and is not a solicitation for any investment. Streetwise Reports does not render general or specific investment advice and the information on Streetwise Reports should not be considered a recommendation to buy or sell any security. Each reader is encouraged to consult with his or her personal financial adviser and perform their own comprehensive investment research. By opening this page, each reader accepts and agrees to Streetwise Reports’ terms of use and full legal disclaimer. Streetwise Reports does not endorse or recommend the business, products, services or securities of any company.

For additional disclosures, please click here.

Clivemaund.com Disclosures

The quoted article represents the opinion and analysis of Mr. Maund, based on data available to him, at the time of writing. Mr. Maund’s opinions are his own, and are not a recommendation or an offer to buy or sell securities. As trading and investing in any financial markets may involve serious risk of loss, Mr. Maund recommends that you consult with a qualified investment advisor, one licensed by appropriate regulatory agencies in your legal jurisdiction and do your own due diligence and research when making any kind of a transaction with financial ramifications. Although a qualified and experienced stock market analyst, Clive Maund is not a Registered Securities Advisor. Therefore Mr. Maund’s opinions on the market and stocks cannot be  only be construed as a recommendation or solicitation to buy and sell securities.

The Index Almost No One Is Watching . . . But Should Be

Source: John Newell (7/7/25) 

John Newell of John Newell & Associates explains why he thinks more people should be looking at the S&P/TSX Venture Composite Index (CDNX).

There’s an old market adage: “Stocks go down in an elevator and up in a staircase.”

That sums up the S&P/TSX Venture Composite Index (CDNX) over the last 15 years, except this time, it didn’t just go down in an elevator. It got trapped in the basement, and every breakout attempt was met with rejection.

Now, it’s not just climbing, it’s breaking out. And hardly anyone’s paying attention.

The CDNX, Canada’s benchmark for early-stage resource and technology companies, has emerged from one of the longest and most painful sideways-to-down periods in its history. For over a decade, it’s been ignored by the mainstream, starved of capital, and left for dead by speculators who moved on to crypto, cannabis, AI, or just gave up.

But that’s changed. The long-term technicals are flashing green. Capital is rotating back into exploration. And the macro story, anchored by gold, copper, and the metals that power the global shift to electrification, is stronger than it’s been in years.

The Setup: Same Way Down, Same Way Up?

Pull up the long-term CDNX chart and you’ll see a dramatic elevator drop from the 2011 highs.

What followed was a decade-long churn that wore out all but the most patient investors. But the pattern that’s forming now? It looks a lot like the mirror image of the move down.

Same way down, same way up?

On the weekly chart, price has broken above long-term moving averages and resistance levels.

Technical targets are activating at 775, 1025, 1325, and 1480. And the long-term Big picture target?

3550, the level where everything started to unravel more than a decade ago.

This isn’t guesswork. It’s price memory. And markets never forget.

Amazon had 20% Corrections Too

Worried about volatility? Looking for the perfect entry? Consider Amazon.com Inc. (AMZN:NASDAQ).

Since the early 2000s, Amazon has gone through more than 15 corrections of 20% or more. Some were over 50%. That’s the price of conviction. And most investors can’t pay it.

If you want generational wealth, you don’t sit in the stands waving pom-poms, you put the pads on and step onto the field.

We celebrate Amazon, Microsoft, and Home Depot as legendary compounders. But almost no one held them through all the turbulence.

Now compare that to junior mining.

You’re not holding for 20 years, waiting on a trillion-dollar valuation. You’re hunting for a discovery, a single drill hole, or deal, that re-rates a company’s valuation in weeks. These aren’t slow burns.

They’re liftoff points.

This Isn’t Just a Rebound. It’s a Rotation.

The CDNX is heavily weighted toward the materials sector, about 40–50%, with gold and silver explorers doing most of the lifting. Base metals like copper and uranium are gaining momentum as investors wake up to the structural shortfalls in global supply.

This index doesn’t move unless real capital is coming back into exploration. And it is.

With gold now holding above $3,300 and copper emerging from a massive base, this isn’t just a bounce, it’s a rotation back to real assets. And junior miners, most of which are still trading near historic lows, are still early in that rotation.

The Venture Exchange is where the rerates happen first.

The Opportunity in One Chart

The index tells us capital is starting to flow. But if you want a more visceral example, take a look at what just happened with ArcWest Exploration Inc. (AWX:TSX.V).

In December 2024, the company was trading at $0.06 with a market cap of ~$5.5 million.

Then, in early July, they announced a $4 million drill program funded by a major.

The stock surged to $0.25 in three days, a revaluation to $22.5 million.

No results, no new resource, no discovery, just a funded drill commitment.

That’s what this part of the market can do.

At the risk of cherry-picking, Arc West shows how fast capital can reprice a stock when sentiment flips. And we’re starting to see more examples like this appear, quietly, for those paying attention.

Final Word

You hear it all the time: “If I’d just held Amazon, I’d be rich.” Sure. But how many did?

Junior mining is different. You don’t need to hold for decades. You just need to spot when a forgotten corner of the market is waking up and be early.

The TSX Venture Index is waking up. Few are watching. But for those willing to take a contrarian position, with eyes wide open, this may be the most explosive setup in the market today.

Like all great trades, it rewards action, not comfort.


Important Disclosures:

  1. John Newell: I, or members of my immediate household or family, own securities of: None. My company has a financial relationship with: None. My company has purchased stocks mentioned in this article for my management clients: None. I determined which companies would be included in this article based on my research and understanding of the sector.
  2. Statements and opinions expressed are the opinions of the author and not of Streetwise Reports, Street Smart, or their officers. The author is wholly responsible for the accuracy of the statements. Streetwise Reports was not paid by the author to publish or syndicate this article. Streetwise Reports requires contributing authors to disclose any shareholdings in, or economic relationships with, companies that they write about. Any disclosures from the author can be found  below. Streetwise Reports relies upon the authors to accurately provide this information and Streetwise Reports has no means of verifying its accuracy.
  3.  This article does not constitute investment advice and is not a solicitation for any investment. Streetwise Reports does not render general or specific investment advice and the information on Streetwise Reports should not be considered a recommendation to buy or sell any security. Each reader is encouraged to consult with his or her personal financial adviser and perform their own comprehensive investment research. By opening this page, each reader accepts and agrees to Streetwise Reports’ terms of use and full legal disclaimer. Streetwise Reports does not endorse or recommend the business, products, services or securities of any company.

For additional disclosures, please click here.

John Newell Disclaimer

As always it is important to note that investing in precious metals like silver carries risks, and market conditions can change violently with shock and awe tactics, that we have seen over the past 20 years. Before making any investment decisions, it’s advisable consult with a financial advisor if needed. Also the practice of conducting thorough research and to consider your investment goals and risk tolerance.

US Copper hits records on Trump’s 50% tariff threat

By ForexTime 

  • US copper hits fresh all-time highs 
  • Trump announces 50% tariffs on copper imports
  • Prices firmly bullish on D1, but RSI overbought 

Copper futures in New York surged to records on Tuesday after Trump announced a higher-than-expected 50% tariff on copper imports.

Prices jumped as high as $5.818, pushing 2025 gains to more than 36%.

Note: FXTM Copper tracks Copper futures on the New York Mercantile Exchange’s COMEX division.

The prospect of steep tariffs may fuel more buying of copper before the levies officially come into effect. However, no date has been confirmed yet. 

Still, this development could spark major supply-chain ripples through global metal markets. This is already being reflected in LME copper, which has dropped as much as 2% before later rebounding.

Note: LME (London Metal Exchange) copper serves as a global benchmark for copper prices. 

Copper prices are firmly bullish, but the Relative Strength Index (RSI) is heavily overbought.

  • BULLISH – Should $5.4 prove to be reliable support, prices may push back toward the all-time high at $5.8183 and the next psychological level at $6.0.
  • BEARISH – Weakness below $5.4 could trigger a decline back toward $5.12.
Imagen
copper 5
 

Forex-Time-LogoArticle by ForexTime

ForexTime Ltd (FXTM) is an award winning international online forex broker regulated by CySEC 185/12 www.forextime.com

From glass and steel to rare earth metals, new materials have changed society throughout history

By Peter Mullner, Boise State University 

Many modern devices – from cellphones and computers to electric vehicles and wind turbines – rely on strong magnets made from a type of minerals called rare earths. As the systems and infrastructure used in daily life have turned digital and the United States has moved toward renewable energy, accessing these minerals has become critical – and the markets for these elements have grown rapidly.

Modern society now uses rare earth magnets in everything from national defense, where magnet-based systems are integral to missile guidance and aircraft, to the clean energy transition, which depends on wind turbines and electric vehicles.

The rapid growth of the rare earth metal trade and its effects on society isn’t the only case study of its kind. Throughout history, materials have quietly shaped the trajectory of human civilization. They form the tools people use, the buildings they inhabit, the devices that mediate their relationships and the systems that structure economies. Newly discovered materials can set off ripple effects that shape industries, shift geopolitical balances and transform people’s daily habits.

Materials science is the study of the atomic structure, properties, processing and performance of materials. In many ways, materials science is a discipline of immense social consequence.

As a materials scientist, I’m interested in what can happen when new materials become available. Glass, steel and rare earth magnets are all examples of how innovation in materials science has driven technological change and, as a result, shaped global economies, politics and the environment.

A diagram showing red arrows, labeled 'politics in' 'society in' 'environment in' 'technology in' etc, leading to a box labeled 'innovation' with arrows pointing away from that box with the same labels but 'out' instead of 'in.'
How innovation shapes society: Pressures from societal and political interests (orange arrows) drive the creation of new materials and the technologies that such materials enable (center). The ripple effects resulting from people using these technologies change the entire fabric of society (blue arrows).
Peter Mullner

Glass lenses and the scientific revolution

In the early 13th century, after the sacking of Constantinople, some excellent Byzantine glassmakers left their homes to settle in Venice – at the time a powerful economic and political center. The local nobility welcomed the glassmakers’ beautiful wares. However, to prevent the glass furnaces from causing fires, the nobles exiled the glassmakers – under penalty of death – to the island of Murano.

Murano became a center for glass craftsmanship. In the 15th century, the glassmaker Angelo Barovier experimented with adding the ash from burned plants, which contained a chemical substance called potash, to the glass.

The potash reduced the melting temperature and made liquid glass more fluid. It also eliminated bubbles in the glass and improved optical clarity. This transparent glass was later used in magnifying lenses and spectacles.

Johannes Gutenberg’s printing press, completed in 1455, made reading more accessible to people across Europe. With it came a need for reading glasses, which grew popular among scholars, merchants and clergy – enough that spectacle-making became an established profession.

By the early 17th century, glass lenses evolved into compound optical devices. Galileo Galilei pointed a telescope toward celestial bodies, while Antonie van Leeuwenhoek discovered microbial life with a microscope.

A large round, convex glass lens mounted on a metal stand, with a technician wearing scrubs looking at it.
The glass lens of the Vera Rubin Observatory, which surveys the night sky.
Large Synoptic Survey Telescope/Vera Rubin Observatory, CC BY

Lens-based instruments have been transformative. Telescopes have redefined long-standing cosmological views. Microscopes have opened entirely new fields in biology and medicine.

These changes marked the dawn of empirical science, where observation and measurement drove the creation of knowledge. Today, the James Webb Space Telescope and the Vera C. Rubin Observatory continue those early telescopes’ legacies of knowledge creation.

Steel and empires

In the late 18th and 19th centuries, the Industrial Revolution created demand for stronger, more reliable materials for machines, railroads, ships and infrastructure. The material that emerged was steel, which is strong, durable and cheap. Steel is a mixture of mostly iron, with small amounts of carbon and other elements added.

Countries with large-scale steel manufacturing once had outsized economic and political power and influence over geopolitical decisions. For example, the British Parliament intended to prevent the colonies from exporting finished steel with the iron act of 1750. They wanted the colonies’ raw iron as supply for their steel industry in England.

Benjamin Huntsman invented a smelting process using 3-foot tall ceramic vessels, called crucibles, in 18th-century Sheffield. Huntsman’s crucible process produced higher-quality steel for tools and weapons.

One hundred years later, Henry Bessemer developed the oxygen-blowing steelmaking process, which drastically increased production speed and lowered costs. In the United States, figures such as Andrew Carnegie created a vast industry based on Bessemer’s process.

The widespread availability of steel transformed how societies built, traveled and defended themselves. Skyscrapers and transit systems made of steel allowed cities to grow, steel-built battleships and tanks empowered militaries, and cars containing steel became staples in consumer life.

Bright hot metal pouring out of a large metal furnace.
White-hot steel pouring out of an electric arc furnace in Brackenridge, Penn.
Alfred T. Palmer/U.S. Library of Congress

Control over steel resources and infrastructure made steel a foundation of national power. China’s 21st-century rise to steel dominance is a continuation of this pattern. From 1995 to 2015, China’s contribution to the world steel production increased from about 10% to more than 50%. The White House responded in 2018 with massive tariffs on Chinese steel.

Rare earth metals and global trade

Early in the 21st century, the advance of digital technologies and the transition to an economy based on renewable energies created a demand for rare earth elements.

A wind turbine with three thin blades rising out of the water.
Offshore turbines use several tons of rare earth magnets to transform wind into electricity.
Hans Hillewaert/Wikimedia Commons, CC BY-SA

Rare earth elements are 17 chemically very similar elements, including neodymium, dysprosium, samarium and others. They occur in nature in bundles and are the ingredients that make magnets super strong and useful. They are necessary for highly efficient electric motors, wind turbines and electronic devices.

Because of their chemical similarity, separating and purifying rare earth elements involves complex and expensive processes.

China controls the majority of global rare earth processing capacity. Political tensions between countries, especially around trade tariffs and strategic competition, can risk shortages or disruptions in the supply chain.

The rare earth metals case illustrates how a single category of materials can shape trade policy, industrial planning and even diplomatic alliances.

Six small piles of rock
Mining rare earth elements has allowed for the widespread adoption of many modern technologies.
Peggy Greb, USDA

Technological transformation begins with societal pressure. New materials create opportunities for scientific and engineering breakthroughs. Once a material proves useful, it quickly becomes woven into the fabric of daily life and broader systems. With each innovation, the material world subtly reorganizes the social world — redefining what is possible, desirable and normal.

Understanding how societies respond to new innovations in materials science can help today’s engineers and scientists solve crises in sustainability and security. Every technical decision is, in some ways, a cultural one, and every material has a story that extends far beyond its molecular structure.The Conversation

About the Author:

Peter Mullner, Distinguished Professor in Materials Science and Engineering, Boise State University

This article is republished from The Conversation under a Creative Commons license. Read the original article.

Gold: From Ancient Treasures to Tomorrow’s Wealth Standard

Source: Brian Hicks (7/7/25) 

Brian Hicks of Wealth Daily shares his thoughts on gold’s importance and how he believes NatGold Digital Ltd. represents a great opportunity to capitalize on gold.

Throughout human history, great societies have constructed their wealth upon golden foundations — from Roman vaults and imperial Chinese treasuries to Spanish vessels during the golden age of exploration.

In our modern era, gold transcends mere ornaments or ingots; it represents global power dynamics, international reserve banking, and a stabilizing force against currency uncertainty. Within this unfolding narrative, my bold projection — $16,402 per ounce — reflects both historical patterns and calculated foresight.

Let me explain why precious metal markets are poised for an unprecedented upward trajectory, examining the evidence. . .

Financial Titan’s Resource Stockpiling

Investment legend Ray Dalio, who established Bridgewater Associates, consistently advocates for gold as protection against monetary devaluation and institutional vulnerabilities. His Bridgewater funds recently expanded physical gold holdings substantially, directing $319 million during the year’s first quarter alone.

His reasoning stems from historical understanding: tracking gold’s evolution. Dalio’s perspective aligns perfectly with our analysis: Gold’s thousand-year journey now intersects with dollar weakness, mounting international liabilities, and transforming global hierarchies. His guiding principle resonates: Gold exists “independent of any one nation’s economy.”

Wealthy Investors Securing Mining Interests

This precious metal pursuit extends beyond major investment firms. Ultra-wealthy individuals are claiming their stakes.

  • John Paulson — renowned from the 2008 financial meltdown — anticipates $5,000 gold within three years. He’s invested $1 billion into Alaska’s Donlin Gold venture, targeting one of Earth’s richest undeveloped reserves. His analysis suggests that central banking institutions pivoting from traditional currencies drives this movement.
  • Thomas Kaplan — mining entrepreneur and Donlin participant through NovaGold Resources Inc. (NG:TSX; NG:NYSE.MKT) — supports this optimistic outlook. His Kaplan Doctrine advises investing in premium, expandable deposits within secure jurisdictions. This pattern reveals a broader shift: Financial elites transitioning from passive bullion ownership to enhanced exposure via mining operations.

I’m thoroughly convinced my $16,402 price target isn’t mere speculation — it’s a calculated strategy.

Reserve Banks: Contemporary Gold Guardians

National reserve institutions propel gold’s market ascension. A January 2025 HSBC survey spanning 72 central banks discovered over one-third planned to boost gold reserves — with none indicating reductions.

Bloomberg confirms: “Central banks will keep buying gold in a push to diversify away from paper currencies amid political and economic upheaval.”

BRICS nations (Brazil, Russia, India, China, South Africa) spearhead this accumulation. Russia has amassed reserves since its 2022 asset confiscation — a cautionary lesson about traditional currency risks. China and India, culturally connected to gold, have expanded both national reserves and domestic bullion demand. As one market observer noted, gold increasingly serves as the “de-dollarization tool” against Western financial influence.

BRICS Alliance and Gold-Centered Economic Systems

The BRICS coalition represents more than trade partnerships and political alignment — it signals monetary strategy evolution. India, China, Russia, and additional members explore de-dollarized trade settlements, potentially incorporating gold-backed frameworks. While a formal “gold-based currency” partnership remains aspirational, the momentum grows undeniably.

BRICS participants actively expand gold reserves for financial security. A popular phrase circulates among their strategists: “When U.S. paper whispers, BRICS gold roars.” As international power structures evolve, gold assumes a transformative role in global finance.

The Weakening Foundation: Diminishing American Currency

The inverse relationship between gold and dollar values follows predictable patterns — yet accelerates now. The dollar confronts:

  • Exploding federal obligations (approaching 140% of GDP)
  • Persistent government shortfalls
  • Federal Reserve independence challenges, heightening inflation worries
  • Recurring international commerce disputes, undermining dollar confidence

These circumstances create ideal conditions for gold’s ascendancy. Our $16,402 forecast depends on continued dollar deterioration — a narrative seemingly shared by Dalio, Paulson, and monetary authorities worldwide.

Eastern Hemisphere’s Consumer Gold Enthusiasm

Asia — the global gold epicenter — maintains impressive momentum. Singapore Bullion Market Association reporting emphasizes regional consumer appetite. Yet our pathway toward $16,402 isn’t fantasy—it’s a narrative where:

Our $16,402 projection captures gold’s multifaceted convergence, representing more than mere valuation but fundamental significance. Amid currency vulnerability and global transformation, gold transcends simple hedging — it embodies historical continuity.

Now, considering gold’s trajectory toward $16,402 per ounce (many analysts project even higher valuations), NatGold Digital Ltd. represents exceptional opportunity.

Consider this crucial point: As gold appreciates, its fundamental worth increases. However, extraction expenses remain relatively stable, meaning NatGold token values will skyrocket dramatically . . . alongside your investment returns.

Let me elaborate…

How NatGold Tokens Enable Ownership Before Wall Street’s Discovery

Imagine obtaining shares in America’s subterranean gold wealth — before extraction begins. Imagine preceding Wall Street, exchange listings, and media coverage. And imagine this investment representing not just precious metal . . . but American prosperity itself.

This embodies NatGold Tokens — pioneering blockchain-secured gold certificates directly linked to verified, untouched, domestic gold deposits within American borders. This isn’t conventional stock ownership, exchange-traded funds, or another digital currency. It represents digital gold’s evolutionary leap — and following recent American economic policy shifts, could soon become central to national financial strategy.

Presidential Initiative: Establishing $12 Trillion National Investment Fund

Earlier this year, Executive Order 14241 received presidential authorization, enabling development across 640 million federal acres containing approximately $100 trillion in untapped mineral resources.

This encompasses substantial copper, uranium, rare earth elements, and crucially: gold reserves.

The presidential vision?

Creating an American Sovereign Wealth Fund utilizing tokenized natural assets — finally monetizing underground national treasures without decades-long permitting delays.

Simply stated, America is beginning to digitize its inherent wealth, with NatGold pioneering this transformation.

Digitizing Inaccessible Resources: Major Deposits Nationwide

For generations, America has possessed some earth’s most valuable — yet unavailable — gold deposits.

  • Northern Dynasty Minerals Ltd.’s (NDM:TSX; NAK:NYSE.MKT) Pebble Creek (Alaska) — Among the world’s largest undeveloped gold-copper resources, delayed through environmental regulatory challenges.
  • Nova Gold Resources Inc.’s (NG:NYSE) Donlin Gold (Alaska) — Contains over 39 million gold ounces, with regulatory hurdles preventing development across decades.
  • Ruth, Nevada — Premium gold concentration zone with billions in buried assets, largely abandoned through outdated extraction regulations.

These represent merely several “stranded resources” NatGold aims to unlock, not through physical extraction but digital tokenization. Each NatGold Token is supported by an authentic geological assessment verified through NI 43-101 protocols, providing token holders with a legal interest in these assets. This represents gold ownership without equipment, permits, or litigation, and zero environmental impact.

Gold: Returning as American Monetary Foundation

Since 1971, American currency has operated independently, without gold backing. Yet historical patterns often circle back. With global debt expansion, persistent inflation, and competing economies like BRICS planning gold-backed currencies, America quietly reintroduces gold into economic discussions.

Presidential conversations have included potential new gold standards — utilizing blockchain technology. Consequently, gold ownership becomes not merely prudent, but potentially fundamental to the American fiscal framework. Through NatGold Tokens, everyday investors participate before institutional recognition.


Important Disclosures:

  1. As of the date of this article, officers and/or employees of Streetwise Reports LLC (including members of their household) own securities of NatGold Digital Ltd.
  2. Brian Hicks: I, or members of my immediate household or family, own securities of: NatGold Digital Ltd. My company has a financial relationship with: None. My company has purchased stocks mentioned in this article for my management clients: None. I determined which companies would be included in this article based on my research and understanding of the sector.
  3. Statements and opinions expressed are the opinions of the author and not of Streetwise Reports, Street Smart, or their officers. The author is wholly responsible for the accuracy of the statements. Streetwise Reports was not paid by the author to publish or syndicate this article. Streetwise Reports requires contributing authors to disclose any shareholdings in, or economic relationships with, companies that they write about. Any disclosures from the author can be found  below. Streetwise Reports relies upon the authors to accurately provide this information and Streetwise Reports has no means of verifying its accuracy.
  4.  This article does not constitute investment advice and is not a solicitation for any investment. Streetwise Reports does not render general or specific investment advice and the information on Streetwise Reports should not be considered a recommendation to buy or sell any security. Each reader is encouraged to consult with his or her personal financial adviser and perform their own comprehensive investment research. By opening this page, each reader accepts and agrees to Streetwise Reports’ terms of use and full legal disclaimer. Streetwise Reports does not endorse or recommend the business, products, services or securities of any company.

For additional disclosures, please click here.