­

Archive for Opinions – Page 2

The push to restore semiconductor manufacturing faces a labor crisis − can the US train enough workers in time?

By Michael Moats, Missouri University of Science and Technology 

Semiconductors power nearly every aspect of modern life – cars, smartphones, medical devices and even national defense systems. These tiny but essential components make the information age possible, whether they’re supporting lifesaving hospital equipment or facilitating the latest advances in artificial intelligence.

It’s easy to take them for granted, until something goes wrong. That’s exactly what happened when the COVID-19 pandemic exposed major weaknesses in the global semiconductor supply chain. Suddenly, to name just one consequence, new vehicles couldn’t be finished because chips produced abroad weren’t being delivered. The semiconductor supply crunch disrupted entire industries and cost hundreds of billions of dollars.

The crisis underscored a hard reality: The U.S. depends heavily on foreign countries – including China, a geopolitical rival – to manufacture semiconductors. This isn’t just an economic concern; it’s widely recognized as a national security risk.

That’s why the U.S. government has taken steps to invest in semiconductor production through initiatives such as the CHIPS and Science Act, which aims to revitalize American manufacturing and was passed with bipartisan support in 2022. While President Donald Trump has criticized the CHIPS and Science Act recently, both he and his predecessor, Joe Biden, have touted their efforts to expand domestic chip manufacturing in recent years.

Yet, even with bipartisan support for new chip plants, a major challenge remains: Who will operate them?

Minding the workforce gap

The push to bring semiconductor manufacturing back to the U.S. faces a significant hurdle: a shortage of skilled workers. The semiconductor industry is expected to need 300,000 engineers by 2030 as new plants are built. Without a well-trained workforce, these efforts will fall short, and the U.S. will remain dependent on foreign suppliers.

This isn’t just a problem for the tech sector – it affects every industry that relies on semiconductors, from auto manufacturing to defense contractors. Virtually every military communication, monitoring and advanced weapon system relies on microchips. It’s not sustainable or safe for the U.S. to rely on foreign nations – especially adversaries – for the technology that powers its military.

For the U.S. to secure supply chains and maintain technological leadership, I believe it would be wise to invest in education and workforce development alongside manufacturing expansion.

Building the next generation of semiconductor engineers

Filling this labor gap will require a nationwide effort to train engineers and technicians in semiconductor research, design and fabrication. Engineering programs across the country are taking up this challenge by introducing specialized curricula that combine hands-on training with industry-focused coursework.

Future semiconductor workers will need expertise in chip design and microelectronics, materials science and process engineering, and advanced manufacturing and clean room operations. To meet this demand, it will be important for universities and colleges to work alongside industry leaders to ensure students graduate with the skills employers need. Offering hands-on experience in semiconductor fabrication, clean-room-based labs and advanced process design will be essential for preparing a workforce that’s ready to contribute from Day 1.

At Missouri University of Science of Technology, where I am the chair of the materials science and engineering department, we’re launching a multidisciplinary bachelor’s degree in semiconductor engineering this fall. Other universities across the U.S. are also expanding their semiconductor engineering options amid strong demand from both industry and students.

A historic opportunity for economic growth

Rebuilding domestic semiconductor manufacturing isn’t just about national security – it’s an economic opportunity that could benefit millions of Americans. By expanding training programs and workforce pipelines, the U.S. can create tens of thousands of high-paying jobs, strengthening the economy and reducing reliance on foreign supply chains.

And the race to secure semiconductor supply chains isn’t just about stability – it’s about innovation. The U.S. has long been a global leader in semiconductor research and development, but recent supply chain disruptions have shown the risks of allowing manufacturing to move overseas.

If the U.S. wants to remain at the forefront of technological advancement in artificial intelligence, quantum computing and next-generation communication systems, it seems clear to me it will need new workers – not just new factories – to gain control of its semiconductor production.The Conversation

About the Author:

Michael Moats, Professor of Metallurgical Engineering, Missouri University of Science and Technology

This article is republished from The Conversation under a Creative Commons license. Read the original article.


Week Ahead: USDJPY set for Wednesday showdown

By ForexTime 

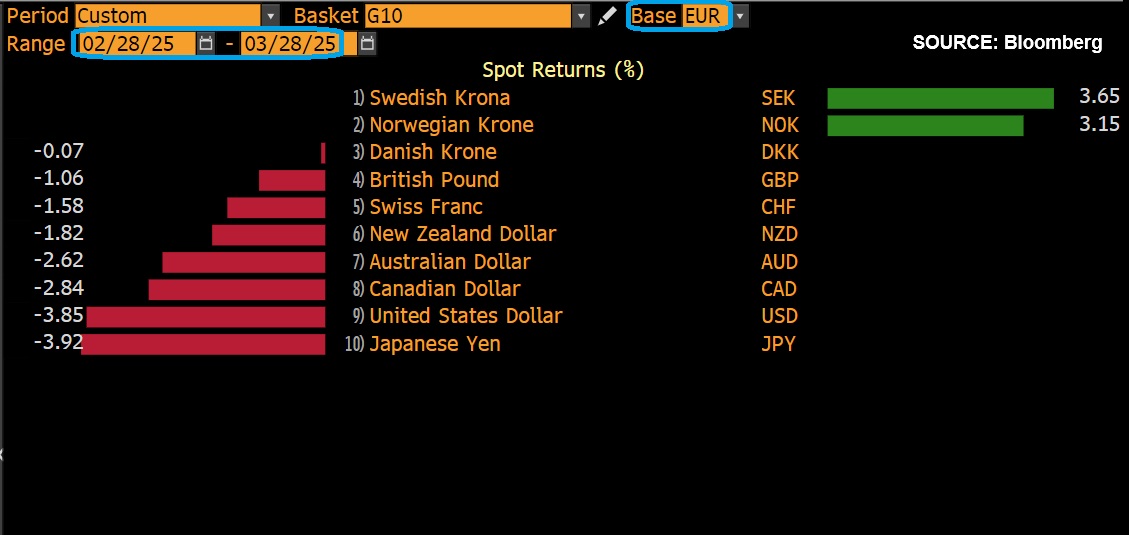
  • Yen expected to be one of the most volatile in G10 space vs USD
  • BoJ and Fed seen holding rates, but policy hints could spark volatility
  • Over past year BoJ triggered moves of ↑ 1.4% & ↓ 1.5%
  • Over past year Fed triggered moves of ↑ 0.7% & ↓ 1.2%
  • Bloomberg FX model: USDJPY has 72% of trading within 146.26 – 151.17 over 1-week period

A flurry of major central bank meetings could present fresh trading opportunities.

The Japanese Yen is expected to be one of the most volatile G10 currencies versus the USD over the next one-week.

This could be based on the Bank of Japan and the Federal Reserve holding policy meetings on the same day!

Beyond central banks, top-tier economic data and global trade developments will be in focus:

Monday, 17th March 

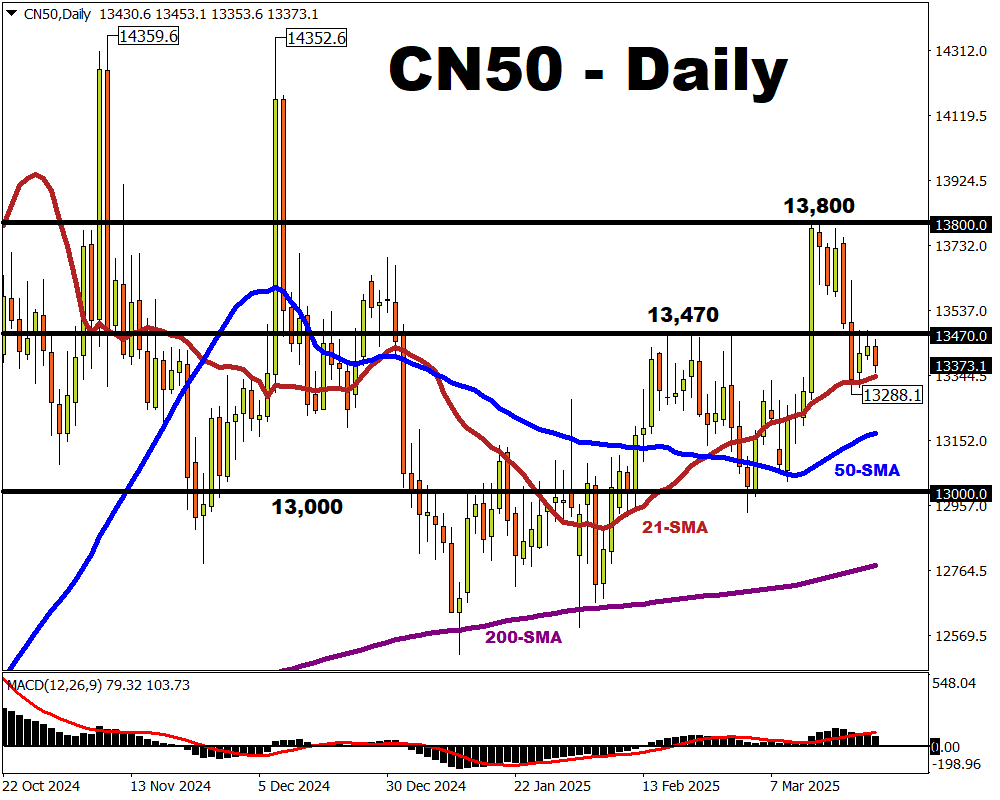
  • CN50: China property prices, retail sales, industrial production
  • CAD: Canada housing starts, existing home sales
  • US500: US retail sales, Empire manufacturing
  • OECD report – prospects for global economy

Tuesday, 18th March

  • CAD: Canada CPI
  • GER40: Germany ZEW survey expectations
  • JP225: Japan tertiary index
  • USDInd: US housing starts, industrial production

Wednesday, 19th March 

  • CHINAH: Tencent earnings
  • EU50: Eurozone CPI
  • ZAR: South Africa retail sales, CPI
  • JPY: BoJ rate decision, industrial production, trade
  • USDInd: Fed rate decision

Thursday, 20th March 

  • AUD: Australia unemployment
  • CN50: China loan prime rates
  • ZAR: SARB rate decision
  • SEK: Riksbank rate decision 
  • CHF: SNB rate decision
  • GBP: BoE rate decision, jobless claims, unemployment
  • RUS2000: US Philadelphia Fed factory index, jobless claims

Friday, 21st  March 

  • CAD: Canada retail sales
  • EUR: Eurozone consumer confidence
  • JPY: Japan CPI
  • NZD: New Zealand trade

At the time of writing, the  Yen depreciated across the board despite Japan’s largest labour union – Rengo securing a 5.46% average gain, its largest pay hike since 1991. This could be a “sell the news” scenario with prices stabilizing down the line.

Nevertheless, the Yen is the 3rd best performing G10 currency versus the dollar year-to-date. These gains are on the back of global trade fears and growing bets around the BoJ hiking rates sooner rather than later.

Looking at the weekly charts, the USDJPY is respecting a bearish channel – but support can be seen at 146.50. 

With all the above said, here is why the USDJPY is set for a big week:

    1 – Trump’s trade war

President Donald Trump’s aggressive stance on trade has roiled markets, sending investors rushing toward safe-haven assets.

Trump recently threatened a 200% tariff on European alcohol after the EU imposed tariffs on US-produced whiskey. 

  • Escalating trade tensions could boost the Japanese Yen – dragging the USDJPY lower. 
  • Signs of easing trade tensions may lift the market mood – pushing the USDJPY higher as the Yen weakens.


    2- BoJ rate decision

Markets widely expect the BoJ to leave interest rates unchanged at its meeting on Wednesday 19th March. 

But if the BoJ hints at a potential hike as soon as May or in the first half of 2025 in the face of higher wages, this could move the Yen.

To be clear, traders are currently pricing in a 16% probability of a 25-basis point hike by May with this jumping to 48% by June. 

Over the past 12 months, the BoJ decision has triggered upside moves as much as 1.4% or declines of 1.5% in a 6-hour window post-release.

Note: Beyond the BoJ decision, Japan’s latest inflation print later in the week could influence BoJ hike bets – moving the Yen as a result.

  • The USDJPY could tumble if the BoJ hints that rates will be hiked in May or June.
  • Should the BoJ strike a dovish tone, this could push the USDJPY higher as the Yen weakens.


    3 – Fed rate decision

The Federal Reserve is seen leaving interest rates unchanged at its meeting on Wednesday, 19th March.

So, all eyes will be on Fed Chair Jerome Powell’s press conference for clues on future policy moves. Last Friday, Powell stated that the US economy was in a good place despite the elevated levels of uncertainty. However, investors remain fearful of Trump’s trade war hitting the US economy.

Traders are currently pricing in a 35% probability of a 25-basis point cut by May with a move fully priced in by June. 

Over the past 12 months, the Fed decision has triggered upside moves as much as 0.7% or declines of 1.2% in a 6-hour window post-release.

  • If Powell strikes a cautious tone towards rate hikes, the USDJPY may slip.
  • Should Powell signal higher rates down the road, this could push the USDJPY higher.


    4 – Technical forces

The USDJPY has shed over 1% month-to-date with prices trading below the 50, 100 and 200-day SMA.

  • A breakout and daily close above 149.00 may signal a move toward 150.80 and 151.17 – the upper limit of the Bloomberg FX model.
  • Sustained weakness below 149.00 could trigger a selloff back toward 146.50 and 146.26 – the lower limit of the Bloomberg FX model.

Bloomberg’s FX model forecasts a 73% chance that USDJPY will trade within the 146.26 – 151.17 range, using current levels as a base, over the next one-week period.


Forex-Time-LogoArticle by ForexTime

ForexTime Ltd (FXTM) is an award winning international online forex broker regulated by CySEC 185/12 www.forextime.com

Gold vs. the Dow: The 100-Year Truth Investors Overlook

Source: John Newell (3/3/25)

John Newell of John Newell & Associates shares his thoughts on where the gold market is headed. Newell also updates us on two stocks he has previously spoken about.

For decades, the Dow Jones Industrial Average has been hailed as the ultimate benchmark for long-term investing success. Investors, analysts, and financial media constantly praise its performance, often portraying it as the premier wealth-building vehicle. But there’s a catch: unlike gold, the Dow is not a constant.

Over the past century, underperforming companies in the Dow have been quietly removed and replaced with stronger performers. Once-prominent names like Union Carbide and Massey Ferguson were left behind as the index evolved to maintain its upward trajectory. This constant reshuffling ensures the Dow always reflects a select group of thriving businesses, making it seem like an unbeatable long-term investment.

Now, let’s compare that to gold. Unlike the Dow, gold doesn’t change. It has been a store of value for thousands of years, immune to corporate failures, economic shifts, and index rebalancing tricks.

Yet, despite all the noise about the Dow’s strength, gold has actually performed just as well, if not better, over the past 100 years.

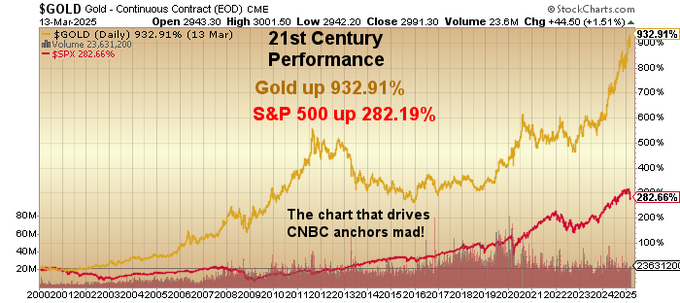
The attached chart above illustrates a remarkable reality: gold has kept pace with the Dow over the long run despite being dismissed as a relic by mainstream finance. From its fixed price of $20.67 per ounce in the early 1900s, before President Roosevelt changed the fix in 1933 to $35.00 and prohibited U.S. investors from holding gold, savvy investors responded by doing the next best thing: investing in gold properties north of the border, in Canada’s prolific goldfields. This wave of capital helped fuel exploration booms that led to some of the most significant gold discoveries in North America.

That represents a move of over 10,000%, comparable to the Dow’s ascent, without the benefit of removing underperformers along the way. The narrative that gold is an “old-fashioned” or a “pet rock” investment, while the Dow represents the future, simply doesn’t hold up to scrutiny.

This begs the question: If gold has matched the performance of an ever-evolving index, what happens when gold’s true monetary role reasserts itself in an era of extreme money printing, debt expansion, and de-dollarization?

With gold prices at record highs and institutional investors taking notice, we may be entering a new phase where gold not only keeps pace with the Dow but decisively outperforms it.

Update on Goliath Resources (See Previous Article Here)

Goliath Resources Ltd. (GOT:TSX.V; GOTRF:OTCQB; B4IF; FSE) is a junior resource exploration company advancing high-grade precious metal projects in the prolific Golden Triangle and northwestern areas of British Columbia.

The company is on track with a new discovery of a large high-grade gold system at its Golddigger property. The Surebet discovery, previously covered by glaciers and permanent snowpack, has now been exposed and drilled for the first time. The project is located in a world-class geological setting and mining-friendly jurisdiction. The Golddigger property sits on tidewater and has excellent infrastructure, including a permitted mill site in Kitsault nearby.

Significant shareholders include Crescat Capital, Eric Sprott, Rob McEwen, and a global commodity group based in Singapore. Dr. Quinton Hennigh serves as a technical advisor. Since our last article on Goliath Resources Ltd. (GOT.V), the company has exceeded its first price target of $2.25, demonstrating strong technical and fundamental performance. The breakout from its long-term downtrend and the series of higher lows have reinforced its upward momentum. The stock is now advancing toward its second target of $4.10, with an ultimate big-picture target of $11.50.

The company’s fundamentals remain robust, driven by high-grade gold discoveries and increasing investor interest in the junior mining sector. While pullbacks are natural in any bull run, Goliath’s technical setup continues to support further upside, making it a compelling stock to watch in the gold exploration space.

Update on First Nordic Minerals (See Previous Article Here )

First Nordic Metals Corp. (FNM:TSX; FNMCF:OTCQB) is a Canadian-based gold exploration company consolidating assets in Sweden and Finland to create Europe’s next major gold camp. The company’s flagship asset in northern Sweden is the Barsele Gold Project, a joint venture with senior gold producer Agnico Eagle Mines Limited. Surrounding Barsele, First Nordic owns a 100% district-scale land package that includes the Paubäcken and Storjuktan projects, covering 104,000 hectares on the Gold Line Belt. Additionally, in northern Finland, First Nordic owns the entire Oijärvi Greenstone Belt, including the Kylmäkangas Au-Ag deposit, the largest known gold occurrence in the region.

“2024 was a defining year for First Nordic as we laid the groundwork to become a leading gold explorer and developer. Receiving the TSX Venture 50 award is a testament to our team’s execution on driving growth through strategic acquisitions and project advancements, as well as the support of key shareholders and industry partners. Sweden and Finland globally rank among the most attractive, underexplored, and exciting regions for mineral exploration right now. With a strong resource base and a fully funded, extensive drill program on multiple high-potential targets, we are poised for an exciting 2025 as we continue to advance Europe’s next gold camp.”

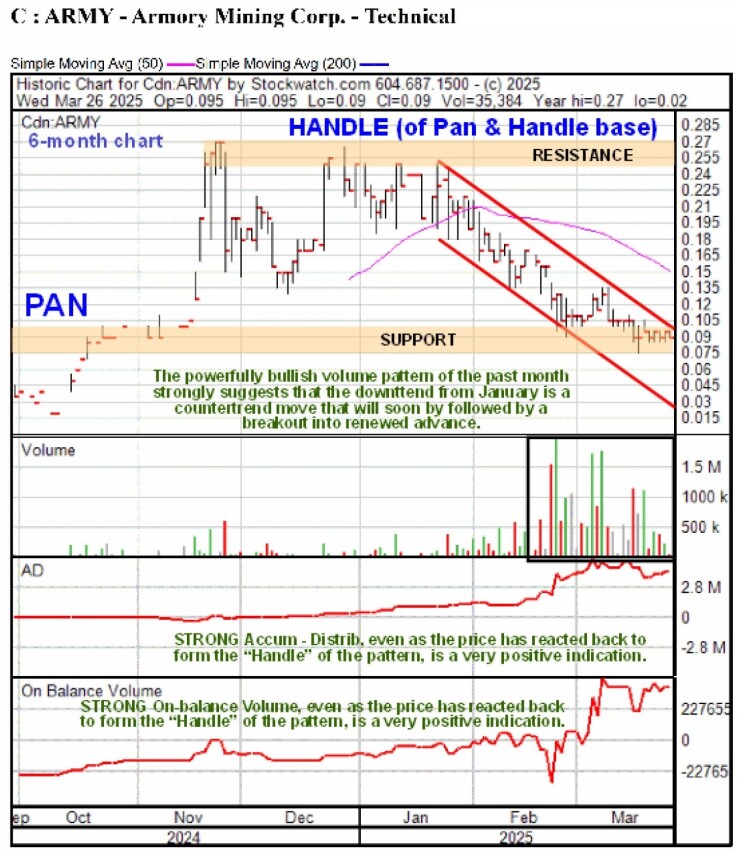
First Nordic Metals has also shown significant progress, coming close to achieving its first target of $0.70. The stock has successfully broken out of its long-term downtrend, confirming a bullish reversal pattern. Higher lows and increasing volume indicate strong accumulation, setting the stage for continued gains.

With a combined historical market capitalization of approximately $300 million, First Nordic has substantial upside potential. The next targets of $1.25 and $1.60 remain well within reach, supported by improving sentiment in the gold sector and the company’s expanding exploration portfolio.

Are Investors Ready for This Reality?

At $3,000 per ounce, we might just see the public dipping pie plates into gold-bearing streams across this great land called Canada. The stage is set for a renewed gold rush, and those paying attention to the junior mining sector could be positioned for substantial gains.

As history has shown, when the gold market heats up, Canadian junior exploration companies have the potential to deliver exponential returns. Investors who understand this cycle and position themselves accordingly may find that gold stocks offer not only a hedge against inflation but also a path to significant wealth creation in the years ahead.


Important Disclosures:

  1. John Newell: I determined which companies would be included in this article based on my research and understanding of the sector.
  2. Statements and opinions expressed are the opinions of the author and not of Streetwise Reports, Street Smart, or their officers. The author is wholly responsible for the accuracy of the statements. Streetwise Reports was not paid by the author to publish or syndicate this article. Streetwise Reports requires contributing authors to disclose any shareholdings in, or economic relationships with, companies that they write about. Any disclosures from the author can be found  below. Streetwise Reports relies upon the authors to accurately provide this information and Streetwise Reports has no means of verifying its accuracy.
  3.  This article does not constitute investment advice and is not a solicitation for any investment. Streetwise Reports does not render general or specific investment advice and the information on Streetwise Reports should not be considered a recommendation to buy or sell any security. Each reader is encouraged to consult with his or her personal financial adviser and perform their own comprehensive investment research. By opening this page, each reader accepts and agrees to Streetwise Reports’ terms of use and full legal disclaimer. Streetwise Reports does not endorse or recommend the business, products, services or securities of any company.

For additional disclosures, please click here.

John Newell Disclaimer

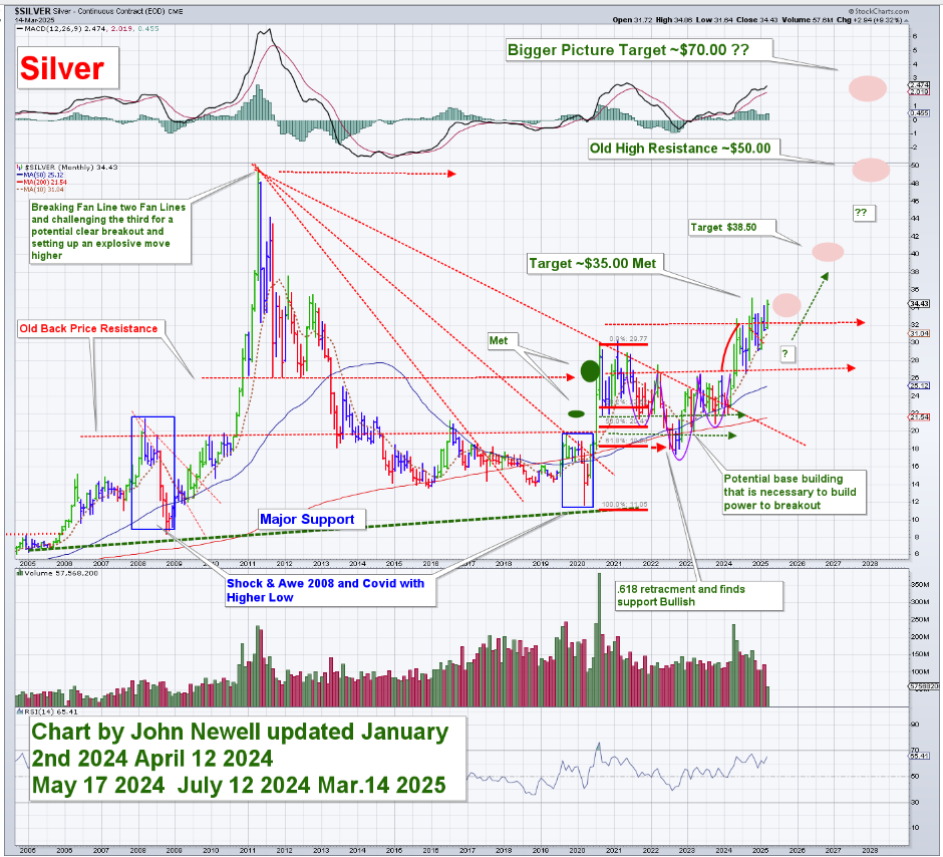
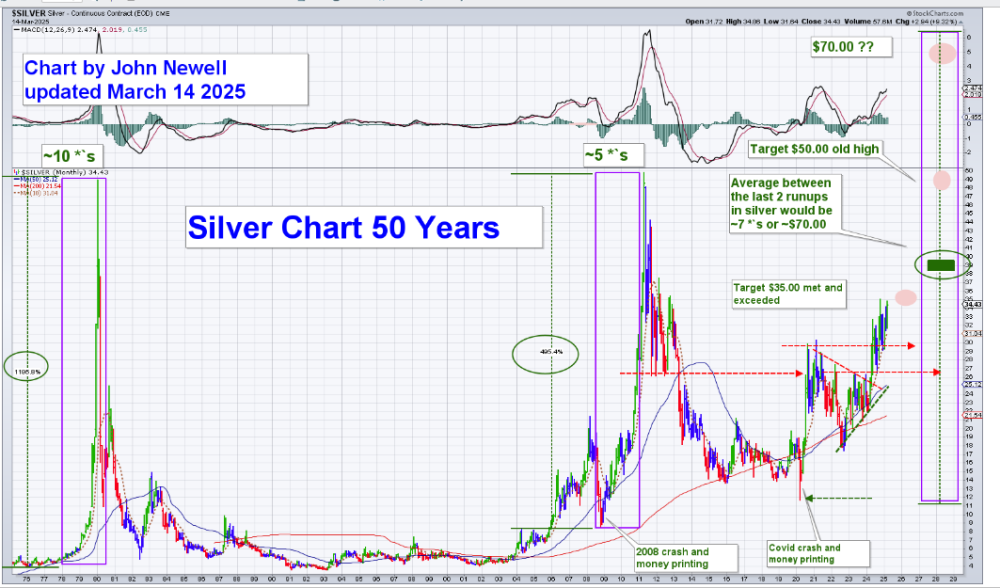
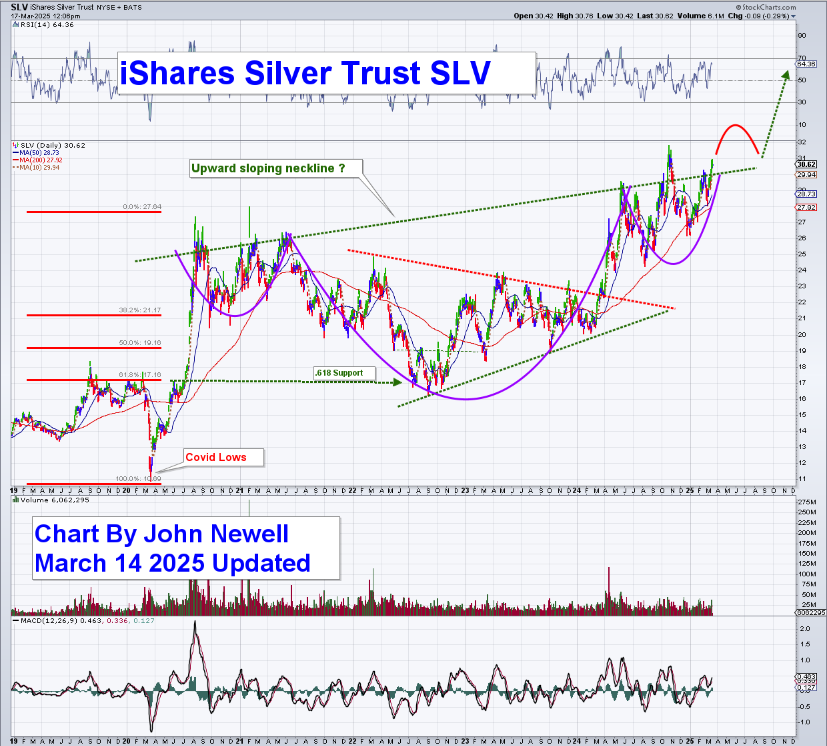
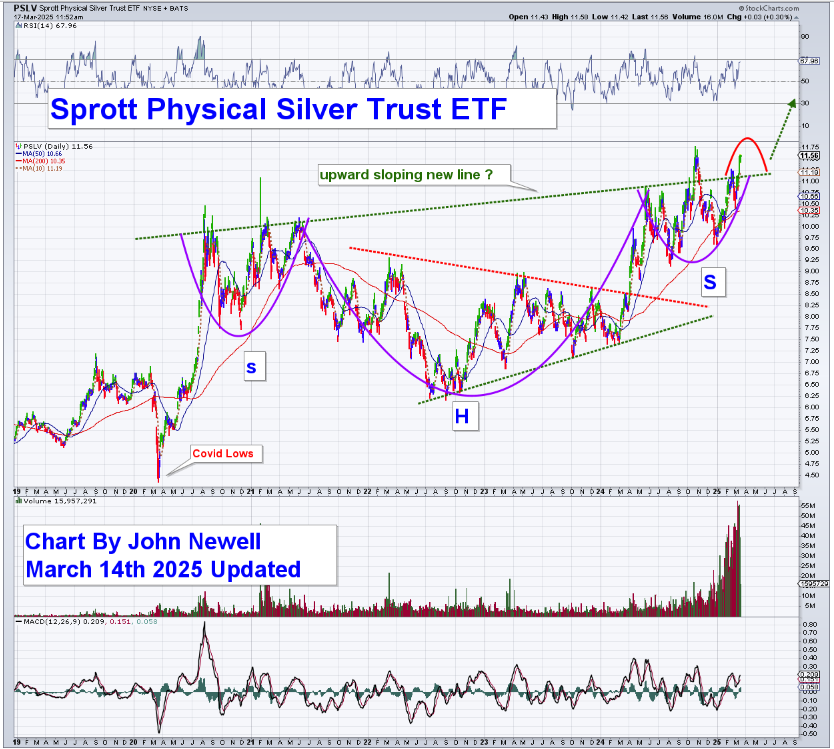
As always it is important to note that investing in precious metals like silver carries risks, and market conditions can change violently with shock and awe tactics, that we have seen over the past 20 years. Before making any investment decisions, it’s advisable consult with a financial advisor if needed. Also the practice of conducting thorough research and to consider your investment goals and risk tolerance.

Source: https://www.streetwisereports.com/article/2025/03/03/gold-vs-the-dow-the-100-year-truth-investors-overlook.html?m_t=2025_03_03_10_37_20

Top Companies on Stocks Watchlist include Industrials & Utilities

By InvestMacro Research

The first quarter of 2025 is cruising along and we wanted to highlight some recent companies that have been added to our Cosmic Rays Watchlist, according to earnings data from last quarter. This week’s companies include a few industrial companies as well as a utility and a consumer discretionary stock.

The Cosmic Rays Watchlist is the output from our proprietary fundamental analysis algorithm. The algo examines company fundamental metrics, earnings trends and overall sector strength trends. The aim is identify quality dividend-paying companies on the NYSE and Nasdaq stock exchanges. If a company scores over 50, it gets added to our Watchlist for further analysis.

We use this system as a stock market ideas generator and to update our Watchlist every quarter. However, be aware the fundamental system does not take the stock price as a direct element in our rating so one must compare each idea with their current stock prices (this is not a timing tool).

Many studies are consistently showing overvalued markets and that has to be taken into consideration with any stock market idea. As with all investment ideas, past performance does not guarantee future results. A stock added to our list is not a recommendation to buy or sell the security.

Here we go with 5 Stocks scored in 2025:


Travel + Leisure Co. (TNL):

Travel + Leisure Co. (Symbol: TNL) was recently added to our Cosmic Rays WatchList. TNL scored a 55 in our fundamental rating system on February 20th.

At time of writing, only 7.93% of stocks have scored a 50 or better out of a total of 11,665 scores in our earnings database. This stock has made our Watchlist a total of 6 times over the years and rose by 9 system points from our last update. TNL is a Medium Cap stock and part of the Consumer Cyclical sector. The industry focus for TNL is Travel Services.

TNL has beat earnings-per-share expectations for four consecutive quarters and has a dividend of close to 3.50 percent with a payout ratio near 35 percent. The TNL stock price has outperformed the Consumer Discretionary Sector benchmark over the past 52 weeks with a 36.91 percent rise compared to the 24.92 benchmark return.

Company Description (courtesy of SEC.gov):

Travel + Leisure Co., together with its subsidiaries, provides hospitality services and products in the United States and internationally. The company operates in two segments, Vacation Ownership; and Travel and Membership. The Vacation Ownership segment develops, markets, and sells vacation ownership interests (VOIs) to individual consumers; provides consumer financing in connection with the sale of VOIs; and property management services at resorts. The Travel and Membership segment operates various travel businesses, including three vacation exchange brands, travel technology platforms, travel memberships, and direct-to-consumer rentals.

Company Website: https://www.travelandleisureco.com


Asset vs Sector Benchmark:*P/E Ratio (TTM)*52-Week Price Return*Beta (S&P500)
– Stock: Travel + Leisure Co. (TNL)7.2236.911.66
– Benchmark Symbol: XLY28.1324.92


* Data through February 21, 2025


Duke Energy Corporation (DUK):

Duke Energy Corporation (Symbol: DUK) made our Watchlist with a 65 score on February 14th.

At time of writing, only 4.60% of stocks have scored a 60 or better out of a total of 11,665 scores in our earnings database. This stock has made our Watchlist a total of 3 times and rose by 33 system points from our last update. DUK is a Large Cap stock and part of the Utilities sector. The industry focus for DUK is Regulated Electric.

DUK met the earnings-per-share expectations in the latest quarter after beating eps two out of the past three quarters (with one miss). DUKE Energy has a dividend of close to 3.75 percent with a payout ratio near 70 percent. The DUK stock price has slightly under-performed the Utilities Sector benchmark over the past 52 weeks with a 24.2 percent return compared to the 30.56 benchmark return.

Company Description (courtesy of SEC.gov):

Duke Energy Corporation, together with its subsidiaries, operates as an energy company in the United States. It operates through three segments: Electric Utilities and Infrastructure, Gas Utilities and Infrastructure, and Commercial Renewables.

Company Website: https://www.duke-energy.com


Asset vs Sector Benchmark:*P/E Ratio (TTM)*52-Week Price Return*Beta (S&P500)
– Stock: Duke Energy Corporation (DUK)20.2824.20.46
– Benchmark Symbol: XLU21.0230.56


* Data through February 21, 2025


Global Payments Inc. (GPN):

Global Payments Inc. (Symbol: GPN) was added to our Cosmic Rays WatchList with a 60 score on February 14th.

At time of writing, only 4.60% of stocks have scored a 60 or better out of a total of 11,665 scores in our earnings database. This stock is on our Watchlist for the first time. GPN is a Large Cap stock and part of the Industrials sector (some sites have this stock in the Financial Services sector). The industry focus for GPN is Specialty Business Services.

GPN has beaten earnings-per-share expectations in two out of the past four quarters (although missed the past two) and has a dividend of close to 0.95 percent with a payout ratio near 16 percent. The GPN stock price has majorly under-performed the Industrials Sector benchmark over the past 52 weeks with a -20.43 percent decline compared to the 15.59 benchmark return.

Company Description (courtesy of SEC.gov):

Global Payments Inc. provides payment technology and software solutions for card, electronic, check, and digital-based payments in the Americas, Europe, and the Asia-Pacific. It operates through three segments: Merchant Solutions, Issuer Solutions, and Business and Consumer Solutions.

Company Website: https://www.globalpaymentsinc.com


Asset vs Sector Benchmark:*P/E Ratio (TTM)*52-Week Price Return*Beta (S&P500)
– Stock: Global Payments Inc. (GPN)12.40-20.430.98
– Benchmark Symbol: XLI25.8215.59


* Data through February 21, 2025


Snap-on Incorporated (SNA):

Snap-on Incorporated (Symbol: SNA) was added to our Cosmic Rays WatchList on February 8th with a 55 score in our fundamental rating system.

At time of writing, only 7.93% of stocks have scored a 50 or better out of a total of 11,665 scores in our earnings database. This stock has made our Watchlist a total of 2 times and rose by 25 system points from our last update. SNA is a Large Cap stock and part of the Industrials sector. The industry focus for SNA is Manufacturing – Tools & Accessories.

SNA has beaten its earnings-per-share expectations for four consecutive quarters including in the latest quarter. Snap On has a dividend right around 2.50 percent with a payout ratio near 45 percent. The SNA stock price has outperformed the Industrials Sector benchmark over the past 52 weeks with a 25.76 percent gain compared to the 15.59 benchmark return.

Company Description (courtesy of SEC.gov):

Snap-on Incorporated manufactures and markets tools, equipment, diagnostics, and repair information and systems solutions for professional users worldwide. It operates through Commercial & Industrial Group, Snap-on Tools Group, Repair Systems & Information Group, and Financial Services segments.

Company Website: https://www.snapon.com


Asset vs Sector Benchmark:*P/E Ratio (TTM)*52-Week Price Return*Beta (S&P500)
– Stock: Snap-on Incorporated (SNA)15.1125.760.95
– Benchmark Symbol: XLI25.8215.59


* Data through February 21, 2025


Allison Transmission Holdings, Inc. (ALSN):

Finally, Allison Transmission Holdings, Inc. (Symbol: ALSN) was added to the Cosmic Rays WatchList on February 12th with a 59 score in our fundamental rating system.

At time of writing, only 7.93% of stocks have scored a 50 or better out of a total of 11,665 scores in our earnings database. This stock has been a staple on our list and has made our Watchlist a total of 7 times, rising by 12 system points from our last update. ALSN is a Medium Cap stock and part of the Industrials sector. The industry focus for ALSN is Machinery.

Allison Transmission has beaten its earnings-per-share expectations for four straight quarters as well including in the latest quarter. ALSN has a dividend just above 1.00 percent with a payout ratio near 15 percent. The ALSN stock price has strongly outperformed the Industrials Sector benchmark over the past 52 weeks with a 45.44 percent increase compared to the 15.59 benchmark return.

Company Description (courtesy of SEC.gov):

Allison Transmission Holdings, Inc., together with its subsidiaries, designs, manufactures, and sells commercial and defense fully-automatic transmissions for medium-and heavy-duty commercial vehicles, and medium-and heavy-tactical U.S. defense vehicles worldwide.

Company Website: https://www.allisontransmission.com


Asset vs Sector Benchmark:*P/E Ratio (TTM)*52-Week Price Return*Beta (S&P500)
– Stock: Allison Transmission Holdings, Inc. (ALSN)10.4545.440.98
– Benchmark Symbol: XLI25.8215.59


* Data through February 21, 2025


By InvestMacro – Be sure to join our stock market newsletter to get our updates and to see more top companies we add to our stock watch list.

All information, stock ideas and opinions on this website are for general informational purposes only and do not constitute investment advice. Stock scores are a data driven process through company fundamentals and are not a recommendation to buy or sell a security. Company descriptions provided by sec.gov.

Gold prices rise again as demand for safe-haven assets increases

By RoboForex Analytical Department 

Gold stabilised around 2,940 USD per troy ounce on Tuesday, remaining close to record highs. The metal continues to benefit from strong demand for safe-haven assets amid growing concerns over US President Donald Trump’s tariff policies.

Key factors driving Gold prices

On Monday, Trump confirmed that tariffs on Canadian and Mexican imports will proceed as planned. This triggered fresh market concerns over inflation risks, which could influence the Federal Reserve’s future monetary policy.

In addition to geopolitical tensions, Gold is receiving support from the SPDR Gold Trust, the world’s largest gold-backed exchange-traded fund. The fund reported increased assets to 904.38, marking the highest level since August 2023.

Investors focus now shifts to Friday’s Personal Consumption Expenditures (PCE) report, the Fed’s preferred inflation gauge. The data is expected to show the slowest price growth since June 2024. However, persistent inflationary pressures may keep the Fed cautious about cutting interest rates too soon.

Technical analysis of XAU/USD

On the H4 chart, XAU/USD is consolidating around 2,938. A potential downward move towards 2,911 (a test from above) is likely before a renewed growth wave targets 2,960 as a local high. Once this level is reached, a corrective decline towards 2,860 could begin. The MACD indicator confirms this outlook, with its signal line above the zero level and pointing decisively upwards.

On the H1 chart, Gold recently formed a growth wave to 2,956 before correcting back to 2,938. A consolidation range is expected to develop around this level. If the price breaks downwards, a move towards 2,920 could occur before another upward impulse targets 2,960. The Stochastic oscillator supports this scenario, with its signal line below 20, indicating an imminent rise towards 80.

Conclusion

Gold remains in a strong uptrend, supported by safe-haven demand, geopolitical uncertainties, and increased holdings in gold-backed ETFs. Technical indicators suggest a potential short-term dip before another move higher towards 2,960. However, investors should watch upcoming inflation data, which could influence the Fed’s rate outlook and Gold’s trajectory.


Disclaimer

Any forecasts contained herein are based on the author’s particular opinion. This analysis may not be treated as trading advice. RoboForex bears no responsibility for trading results based on trading recommendations and reviews contained herein.

COT Speculator Extremes: Steel & US Treasury Bonds lead Bullish Positions

By InvestMacro

The latest update for the weekly Commitment of Traders (COT) report was released by the Commodity Futures Trading Commission (CFTC) on Friday for data ending on February 18th.

This weekly Extreme Positions report highlights the Most Bullish and Most Bearish Positions for the speculator category. Extreme positioning in these markets can foreshadow strong moves in the underlying market.

To signify an extreme position, we use the Strength Index (also known as the COT Index) of each instrument, a common method of measuring COT data. The Strength Index is simply a comparison of current trader positions against the range of positions over the previous 3 years. We use over 80 percent as extremely bullish and under 20 percent as extremely bearish. (Compare Strength Index scores across all markets in the data table or cot leaders table)


Here Are This Week’s Most Bullish Speculator Positions:

Steel


The Steel speculator position comes in as the most bullish extreme standing this week. The Steel speculator level is currently at a 100.0 percent score of its 3-year range.

The six-week trend for the percent strength score totaled 35.1 this week. The overall net speculator position was a total of 5,090 net contracts this week with a gain of 2,235 contract in the weekly speculator bets.


Speculators or Non-Commercials Notes:

Speculators, classified as non-commercial traders by the CFTC, are made up of large commodity funds, hedge funds and other significant for-profit participants. The Specs are generally regarded as trend-followers in their behavior towards price action – net speculator bets and prices tend to go in the same directions. These traders often look to buy when prices are rising and sell when prices are falling. To illustrate this point, many times speculator contracts can be found at their most extremes (bullish or bearish) when prices are also close to their highest or lowest levels.

These extreme levels can be dangerous for the large speculators as the trade is most crowded, there is less trading ammunition still sitting on the sidelines to push the trend further and prices have moved a significant distance. When the trend becomes exhausted, some speculators take profits while others look to also exit positions when prices fail to continue in the same direction. This process usually plays out over many months to years and can ultimately create a reverse effect where prices start to fall and speculators start a process of selling when prices are falling.


US Treasury Bond


The US Treasury Bond speculator position comes next and tied for the most bullish lead in the extreme standings this week. The US Treasury Bond speculator level is now at a 100.0 percent score of its 3-year range.

The six-week trend for the percent strength score was 22.5 this week. The speculator position registered 47,781 net contracts this week with a weekly rise by 3,780 contracts in speculator bets.


Japanese Yen


The Japanese Yen speculator position comes in next this week in the extreme standings as the yen sentiment has turned around positively. The Japanese Yen speculator level resides at a 97.8 percent score of its 3-year range.

The six-week trend for the speculator strength score came in at 32.3 this week. The overall speculator position was 60,569 net contracts this week with an increase by 5,954 contracts in the weekly speculator bets.


Corn


The Corn speculator position comes up number four in the extreme standings this week as Corn’s sentiment has also turned around sharply in the past months. The Corn speculator level is currently at a 93.6 percent score of its 3-year range.

The six-week trend for the speculator strength score totaled a change of 19.0 this week. The overall speculator position was 468,724 net contracts this week with a jump by 43,955 contracts in the speculator bets.


Lean Hogs


The Lean Hogs speculator position rounds out the top five in this week’s bullish extreme standings. The Lean Hogs speculator level sits at a 90.3 percent score of its 3-year range. The six-week trend for the speculator strength score was 6.3 this week.

The speculator position was 80,857 net contracts this week with an advance by 7,637 contracts in the weekly speculator bets.


This Week’s Most Bearish Speculator Positions:

New Zealand Dollar


The New Zealand Dollar speculator position comes in as the most bearish extreme standing this week. The New Zealand Dollar speculator level is at a 2.9 percent score of its 3-year range.

The six-week trend for the speculator strength score was also 2.9 this week. The overall speculator position was -52,163 net contracts this week with a decline of -2,827 contracts in the speculator bets.


Sugar


The Sugar speculator position comes in next for the most bearish extreme standing on the week. The Sugar speculator level is at a 4.0 percent score of its 3-year range.

The six-week trend for the speculator strength score was -22.6 this week. The speculator position was -20,707 net contracts this week with a rise of 5,819 contracts in the weekly speculator bets.


Cotton


The Cotton speculator position comes in as third most bearish extreme standing of the week. The Cotton speculator level resides at a 8.9 percent score of its 3-year range.

The six-week trend for the speculator strength score was -3.3 this week. The overall speculator position was -37,068 net contracts this week with an increase by 5,497 contracts in the speculator bets.


Euro


The Euro speculator position comes in as this week’s fourth most bearish extreme standing. The Euro speculator level is at a 9.2 percent score of its 3-year range.

The six-week trend for the speculator strength score was 4.8 this week. The speculator position was -51,420 net contracts this week with a gain of 13,005 contracts in the weekly speculator bets.


5-Year Bond


Finally, the 5-Year Bond speculator position comes in as the fifth most bearish extreme standing for this week. The 5-Year Bond speculator level is at a 13.1 percent score of its 3-year range.

The six-week trend for the speculator strength score was 3.4 this week. The speculator position was -1,737,533 net contracts this week with a rise by 124,202 contracts in the weekly speculator bets.


Article By InvestMacroReceive our weekly COT Newsletter

*COT Report: The COT data, released weekly to the public each Friday, is updated through the most recent Tuesday (data is 3 days old) and shows a quick view of how large speculators or non-commercials (for-profit traders) were positioned in the futures markets.

The CFTC categorizes trader positions according to commercial hedgers (traders who use futures contracts for hedging as part of the business), non-commercials (large traders who speculate to realize trading profits) and nonreportable traders (usually small traders/speculators) as well as their open interest (contracts open in the market at time of reporting). See CFTC criteria here.


A fiscal crisis is looming for many US cities

By John Rennie Short, University of Maryland, Baltimore County 

Five years after the start of the COVID-19 pandemic, many U.S. cities are still adjusting to a new normal, with more people working remotely and less economic activity in city centers. Other factors, such as underfunded pension plans for municipal employees, are pushing many city budgets into the red.

Urban fiscal struggles are not new, but historically they have mainly affected U.S. cities that are small, poor or saddled with incompetent managers. Today, however, even large cities, including Chicago, Houston and San Francisco, are under serious financial stress.

This is a looming nationwide threat, driven by factors that include climate change, declining downtown activity, loss of federal funds and large pension and retirement commitments.

Spending cuts abound in many U.S. cities as inflation lingers and pandemic-era stimulus dries up.

Why cities struggle

Many U.S. cities have faced fiscal crises over the past century, for diverse reasons. Most commonly, stress occurs after an economic downturn or sharp fall in tax revenues.

Florida municipalities began to default in 1926 after the collapse of a land boom. Municipal defaults were common across the nation in the 1930s during the Great Depression: As unemployment rose, relief burdens swelled and tax collections dwindled.

In 1934 Congress amended the U.S. bankruptcy code to allow municipalities to file formally for bankruptcy. Subsequently, 27 states enacted laws that authorized cities to become debtors and seek bankruptcy protection.

Declaring bankruptcy was not a cure-all. It allowed cities to refinance debt or stretch out payment schedules, but it also could lead to higher taxes and fees for residents, and lower pay and benefits for city employees. And it could stigmatize a city for many years afterward.

In the 1960s and 1970s, many urban residents and businesses left cities for adjoining suburbs. Many cities, including New York, Cleveland and Philadelphia, found it difficult to repay debts as their tax bases shrank.

A tabloid newspaper with a photo of President Gerald Ford and the headline 'Ford to City: Drop Dead'
The New York Daily News, Oct. 30, 1975, after U.S. President Gerald Ford ruled out providing federal aid to save the city from bankruptcy. Several months later, Ford signed legislation authorizing federal loans.
Edward Stojakovic/Flickr, CC BY

In the wake of the 2008-2009 housing market collapse, cities including Detroit, San Bernardino, California, and Stockton, California, filed for bankruptcy. Other cities faced similar difficulties but were located in states that did not allow municipalities to declare bankruptcy.

Even large, affluent jurisdictions could go off the financial rails. For example, Orange County, California, went bankrupt in 2002 after its treasurer, Robert Citron, pursued a risky investment strategy of complex leveraging deals, losing some $1.65 billion in taxpayer funds.

Today, cities face a convergence of rising costs and decreasing revenues in many places. As I see it, the urban fiscal crisis is now a pervasive national challenge.

Climate-driven disasters

Climate change and its attendant increase in major disasters are putting financial pressure on municipalities across the country.

Events like wildfires and flooding have twofold effects on city finances. First, money has to be spent on rebuilding damaged infrastructure, such as roads, water lines and public buildings. Second, after the disaster, cities may either act on their own or be required under state or federal law to make expensive investments in preparation for the next storm or wildfire.

In Houston, for example, court rulings after multiple years of severe flooding are forcing the city to spend $100 million on street repairs and drainage by mid-2025. This requirement will expand the deficit in Houston’s annual budget to $330 million.

In Massachusetts, towns on Cape Cod are spending millions of dollars to switch from septic systems to public sewer lines and upgrade wastewater treatment plants. Population growth has sharply increased water pollution on the Cape, and climate change is promoting blooms of toxic algae that feed on nutrients in wastewater.

Increasing uncertainty about the total costs of mitigating and adapting to climate change will inevitably lead rating agencies to downgrade municipal credit ratings. This raises cities’ costs to borrow money for climate-related projects like protecting shorelines and improving wastewater treatment.

Underfunded pensions

Cities also spend a lot of money on employees, and many large cities are struggling to fund pensions and health benefits for their workforces. As municipal retirees live longer and require more health care, the costs are mounting.

For example, Chicago currently faces a budget deficit of nearly $1 billion, which stems partly from underfunded retirement benefits for nearly 30,000 public employees. The city has $35 billion in unfunded pension liabilities and almost $2 billion in unfunded retiree health benefits. Chicago’s teachers are owed $14 billion in unfunded benefits.

Policy studies have shown for years that politicians tend to underfund retirement and pension benefits for public employees. This approach offloads the real cost of providing police, fire protection and education onto future taxpayers.

Struggling downtowns and less federal support

Cities aren’t just facing rising costs – they’re also losing revenues. In many U.S. cities, retail and commercial office economies are declining. Developers have overbuilt commercial properties, creating an excess supply. More unleased properties will mean lower tax revenues.

At the same time, pandemic-related federal aid that cushioned municipal finances from 2020 through 2024 is dwindling.

State and local governments received $150 billion through the 2020 Coronavirus Aid, Relief, and Economic Security (CARES) Act and an additional $130 billion through the 2021 American Rescue Plan Act. Now, however, this federal largesse – which some cities used to fill mounting fiscal cracks – is at an end.

In my view, President Donald Trump’s administration is highly unlikely to bail out urban areas – especially more liberal cities like Detroit, Philadelphia and San Francisco. Trump has portrayed large cities governed by Democrats in the darkest terms – for example, calling Baltimore a “rodent-infested mess” and Washington, D.C., a “dirty, crime-ridden death trap.” I expect that Trump’s animus against big cities, which was a staple of his 2024 campaign, could become a hallmark of his second term.

Detroit officials respond to disparaging remarks about the city by Donald Trump during a campaign speech in Detroit, Oct. 10, 2024.

Resistance to new taxes

Cities can generate revenue from taxes on sales, businesses, property and utilities. However, increasing municipal taxes – particularly property taxes – can be very difficult.

In 1978, California adopted Proposition 13 – a ballot measure that limited property tax increases to the rate of inflation or 2% per year, whichever is lower. This high-profile campaign created a widespread narrative that property taxes were out of control and made it very hard for local officials to support property tax increases.

Thanks to caps like Prop 13, a persistent public view that taxes are too high and political resistance, property taxes have tended to lag behind inflation in many parts of the country.

The crunch

Taking these factors together, I see a fiscal crunch coming for U.S. cities. Small cities with low budgets are particularly vulnerable. But so are larger, more affluent cities, such as San Francisco with its collapsing downtown office market, or Houston, New York and Miami, which face growing costs from climate change.

One city manager who runs an affluent municipality in the Pacific Northwest told me that in these difficult circumstances, politicians need to be more frank and open with their constituents and explain convincingly and compellingly how and why taxpayer money is being spent.

Efforts to balance city budgets are opportunities to build consensus with the public about what municipalities can do, and at what cost. The coming months will show whether politicians and city residents are ready for these hard conversations.The Conversation

About the Author:

John Rennie Short, Professor Emeritus of Public Policy, University of Maryland, Baltimore County

This article is republished from The Conversation under a Creative Commons license. Read the original article.

Investors value corporate tax responsibility – at least when the company is based somewhere with a lot of inequality, research shows

By Erica Neuman, University of Dayton and Curtis Farnsel, University of Dayton 

When corporations based in areas of above-average income inequality pay more taxes, it’s not just the public that appreciates it – investors do, too. That’s the key finding of our recent research published in the journal Accounting and the Public Interest.

Our finding challenges traditional economic theory holding that investors see corporate taxes as a transfer of wealth from shareholders to the state. That would suggest investors value only strategies that minimize taxes. The reality isn’t so simple.

As accounting professors at the University of Dayton, we study the intersection of corporate taxes and corporate social responsibility. We wanted to better understand how corporate taxes affect firm value and stock prices, and whether that relationship changes if a company is headquartered in an area with high income inequality.

So we looked at financial data from over 1,500 firms over a 10-year period between 2011 and 2019, as well as the income inequality in the metro areas where they’re headquartered. For the latter point, we used the Gini coefficient, a measure of income distribution in a given place. This is a particularly useful context for looking at corporate taxes, since one of the key functions of taxation is to counter inequality.

We found that there’s a negative relationship between corporate taxes and firm value for companies headquartered in areas of average inequality. In other words, paying more corporate taxes lowers firm value. That’s in line with previous research and traditional economic theory.

However, we found that when local income inequality rises above the average, the relationship between corporate taxes and firm value flips. This flip suggests that some companies actually receive a financial benefit from paying corporate taxes.

Why? We found that these companies enjoy a reputational benefit for being socially responsible taxpayers. Indeed, our results were driven by businesses that are are otherwise widely viewed as good corporate citizens. For those companies, paying taxes represents one of many socially responsible behaviors.

Why it matters

Our research offers evidence that investors view corporate taxes positively when they’re consistent with other socially responsible behaviors. Given that corporations have a fiduciary duty to their shareholders, this finding suggests that corporate taxes can play a role in a company’s corporate social responsibility, or CSR, efforts.

Our findings also align with a 2023 KPMG survey of more than 300 chief tax officers that found more than half said they cared more about looking like good corporate citizens than reducing their tax burdens.

An extensive body of research has shown that companies’ investments in CSR activities aren’t just selfless – they’re linked with improved operational and financial outcomes. There’s evidence that businesses that prioritize CSR are better able to attract quality employees; have improved corporate reputations; and are more profitable as judged by return on assets, return on equity and return on sales.

While work on tax responsibility has lagged behind other CSR research, evidence is mounting that paying corporate taxes has positive effects. Much of this research indicates that companies that aggressively minimize tax payments and gain a reputation as “tax avoiders” face harm to their reputation – and therefore, the bottom line.

Our study dovetails this research and identifies a specific context in which investors view corporate taxes favorably. At a time of tax reform both globally and in the U.S., and as lawmakers and pundits continue to call for greater tax transparency, companies should be aware of the role of corporate tax responsibility in their overall CSR portfolio.

What’s next

Corporate tax responsibility is complex and not yet well defined. Our current research examines other circumstances that lead investors to value corporate taxes, which will help companies to quantify the value of including taxes in their CSR portfolios.

The Research Brief is a short take about interesting academic work.The Conversation

About the Author:

Erica Neuman, Assistant Professor of Accounting, University of Dayton and Curtis Farnsel, Assistant Professor of Accounting, University of Dayton

This article is republished from The Conversation under a Creative Commons license. Read the original article.


EUR/USD poised to renew two-month highs as buying momentum builds

By RoboForex Analytical Department 

The EUR/USD pair is hovering around 1.0503, extending its rally since midweek. The major currency pair has climbed to a two-month high, with market sentiment favouring further gains.

Key drivers behind EUR/USD’s rise

A decline in US Treasury bond yields has weighed on the US dollar, following a series of weaker-than-expected US economic reports and dovish remarks from Federal Reserve officials.

Austan Goolsbee, President of the Federal Reserve Bank of Chicago, stated that he does not expect the Core Personal Consumption Expenditures (PCE) index to be as concerning as the recent Consumer Price Index (CPI) data. As a key inflation measure for the Federal Reserve, the Core PCE significantly influences monetary policy expectations.

Meanwhile, St. Louis Fed President Alberto Musalem warned of stagflation risks and the potential challenges in setting future policy.

The latest US jobless claims data further raised concerns, showing an increase to 219,000 from the previous 213,000, exceeding the forecast of 214,000.

In the eurozone, the euro could see further upside if the German election outcome triggers additional short-covering in EUR/USD.

Technical analysis of EUR/USD

On the H4 chart, EUR/USD has completed a growth wave to 1.0470, forming a consolidation range around this level. The market has since broken higher, paving the way for further gains towards 1.0544. A correction towards 1.0385 may follow after reaching this level. The MACD indicator supports this scenario, with its signal line above zero and pointing upwards, indicating continued bullish momentum.

On the H1 chart, the pair executed a growth wave to 1.0470, followed by a narrow consolidation range around this level. The likelihood of an upward breakout towards 1.0520 remains high. After reaching this level, a correction to 1.0470 could occur before the growth wave resumes towards 1.0544. The Stochastic oscillator confirms this outlook, with its signal line above 80 and trending towards 20, suggesting a possible pullback before further gains.


Conclusion

EUR/USD remains in an uptrend, supported by weakening US Treasury yields and a cautious Fed outlook. If bullish momentum continues, the pair may extend gains towards 1.0544. However, a corrective move could follow before further upside. The outcome of the German election could also influence short-term price action, potentially driving additional volatility.


Disclaimer

Any forecasts contained herein are based on the author’s particular opinion. This analysis may not be treated as trading advice. RoboForex bears no responsibility for trading results based on trading recommendations and reviews contained herein.

How AI can help in the creative design process

By Tilanka Chandrasekera, Oklahoma State University 

Generative artificial intelligence tools can help design students by making hard tasks easier, cutting down on stress, and allowing the students more time to explore innovative ideas, according to new research I published with my colleagues in the International Journal of Architectural Computing.

I study how people think about design and use technology, and my research focuses on how tools such as AI can help make the design process more efficient and creative.

A student works on a design in a fashion merchandising lab.
Fashion Merchandising Labs at Oklahoma State University, CC BY-ND

Why it matters

Our study found that AI design tools didn’t just make the designs better – they also made the process easier and less stressful for students.

Imagine trying to come up with a cool idea in response to a design assignment, but it’s hard to picture it in your head. These tools step in and quickly show what your idea could look like, so you can focus on being creative instead of worrying about little details. This made it easier for students to brainstorm and come up with new ideas. The AI tools also made more design variations by introducing new and unexpected details, such as natural shapes and textures.

Turquoise love seats surrounded by lily pads. A more polished version, with green lily pads and blue water, is juxtaposed with a sketched version of the image.
A design fueled by artificial intelligence: The left image is the result of the text-to-image technology, and the image on the right is the design completed by the student.
Oklahoma State University, CC BY-ND
A rudimentary seat design sketched on pencil and paper.
A design by a student without using artificial intelligence.
Oklahoma State University, CC BY-ND

How we did our work

My colleagues and I worked with 40 design students and split them into two groups.

One group used AI to help design urban furniture, such as benches and seating for public spaces, while the other group didn’t use AI. The AI tool created pictures of the first group’s design ideas from simple text descriptions. Both groups refined their ideas by either sketching them by hand or with design software.

Next, the two groups were given a second design task. This time, neither group was allowed to use AI. We wanted to see whether the first task helped them learn how to develop a design concept.

My colleagues and I evaluated the students’ creativity on three criteria: the novelty of their ideas, the effectiveness of their designs in solving the problem, and the level of detail and completeness in their work. We also wanted to see how hard the tasks felt for them, so we measured something called cognitive load using a well-known tool called the NASA task load index. This tool checks how much mental effort and frustration the students experienced.

The group of students who used AI in the first task had an easier time in the second task, feeling less overwhelmed compared with those who didn’t use AI.

The final designs of the AI group also showed a more creative design process in the second task, likely because they learned from using AI in the first task, which helped them think and develop better ideas.

What’s next

Future research will look at how AI tools can be used in more parts of design education and how they might affect the way professionals work.

One challenge is making sure students don’t rely too much on AI, which could hurt their ability to think critically and solve problems on their own.

Another goal is to make sure as many design students as possible have access to these tools.

The Research Brief is a short take on interesting academic work.The Conversation

About the Author:

Tilanka Chandrasekera, Professor of Interior Design, Oklahoma State University

This article is republished from The Conversation under a Creative Commons license. Read the original article.