
By Steve Schifferes, City St George’s, University of London
This is the first in a two-part series. Read part two here.
For nearly four centuries, the world economy has been on a path of ever-greater integration that even two world wars could not totally derail. This long march of globalisation was powered by rapidly increasing levels of international trade and investment, coupled with vast movements of people across national borders and dramatic changes in transportation and communication technology.
According to economic historian J. Bradford DeLong, the value of the world economy (measured at fixed 1990 prices) rose from US$81.7 billion (£61.5 billion) in 1650, when this story begins, to US$70.3 trillion (£53 trillion) in 2020 – an 860-fold increase. The most intensive periods of growth corresponded to the two periods when global trade was rising fastest: first during the “long 19th century” between the end of the French revolution and start of the first world war, and then as trade liberalisation expanded after the second world war, from the 1950s up to the 2008 global financial crisis.
Now, however, this grand project is on the retreat. Globalisation is not dead yet, but it is dying.
Is this a cause for celebration, or concern? And will the picture change again when Donald Trump and his tariffs of mass disruption leave the White House? As a longtime BBC economics correspondent who was based in Washington during the global financial crisis, I believe there are sound historical reasons to worry about our deglobalised future – even once Trump has left the building.
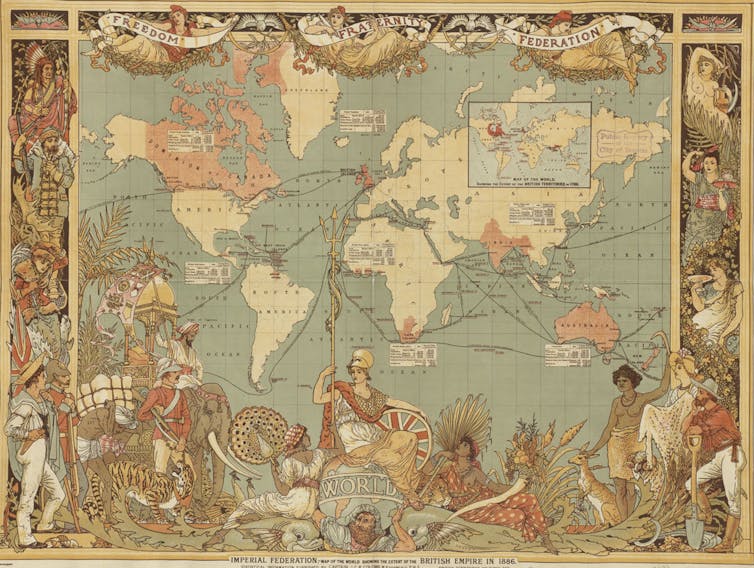 A world map showing the extent of the British Empire in 1886.
Norman B. Leventhal Map & Education Center, Boston Public Library/Wikimedia Commons, CC BY
Trump’s tariffs have amplified the world’s economic problems, but he is not the root cause of them. Indeed, his approach reflects a truth that has been emerging for many decades but which previous US administrations – and other governments around the world – have been reluctant to admit: namely, the decline of the US as the world’s no.1 economic power and engine of world growth.
In each era of globalisation since the mid-17th century, a single country has sought to be the clear world leader – shaping the rules of the global economy for all. In each case, this hegemonic power had the military, political and financial power to enforce these rules – and to convince other countries that there was no preferable path to wealth and power.
But now, as the US under Trump slips into isolationism, there is no other power ready to take its place and carry the torch for the foreseeable future. Many people’s pick, China, faces too many economic challenges, including its lack of a truly international currency – and as a one-party state, nor does it possess the democratic mandate needed to gain acceptance as the world’s new dominant power.
While globalisation has always produced many losers as well as winners – from the slave trade of the 18th century to displaced factory workers in the American Midwest in the 20th century – history shows that a deglobalised world can be an even more dangerous and unstable place. The most recent example came during the interwar years, when the US refused to take up the mantle left by the decline of Britain as the 19th century’s hegemonic global power.
In the two decades from 1919, the world descended into economic and political chaos. Stock market crashes and global banking failures led to widespread unemployment and increasing political instability, creating the conditions for the rise of fascism. Global trade declined sharply as countries put up trade barriers and started self-defeating currency wars in the vain hope of giving their countries’ exports a boost. On the contrary, global growth ground to a halt.
A century on, our deglobalising world is vulnerable again. But to chart whether this means we are destined for a similarly chaotic and unstable future, we first need to explore the birth, growth and reasons behind the imminent demise of this extraordinary global project.
French model: mercantilism, money and war
By the mid-1600s, France had emerged as the strongest power in Europe – and it was the French who developed the first overarching theory of how the global economy could work in their favour. Nearly four centuries later, many aspects of “mercantilism” have been revived by Trump’s US playbook, which could be entitled How To Dominate the World Economy by Weakening Your Rivals.
France’s version of mercantilism was based on the idea that a country should put up trade barriers to limit how much other countries could sell to it, while boosting its own industries to ensure that more money (in the form of gold) came into the country than left it.
England and the Dutch Republic had already adopted some of these mercantilist policies, establishing colonies around the globe run by powerful monopolistic trading companies that aimed to challenge and weaken the Spanish empire, which had prospered on the gold and silver it seized in the Americas. In contrast to these “seaborne empires”, the much larger empires in the east such as China and India had the internal resources to generate their own revenue, meaning international trade – although widespread – was not critical to their prosperity.

Metropolitan Museum of Art/Wikimedia
But it was France which first systematically applied mercantilism across the whole of government policy – led by the powerful finance minister Jean-Baptiste Colbert (1661-1683), who had been granted unprecedented powers to strengthen the financial might of the French state by King Louis XIV. Colbert believed trade would boost the coffers of the state and strengthen France’s economy while weakening its rivals, stating:
It is simply, and solely, the absence or abundance of money within a state [which] makes the difference in its grandeur and power.
In Colbert’s view, trade was a zero-sum game. The more France could run a trade surplus with other countries, the more gold bullion it could accumulate for the government and the weaker its rivals would become if deprived of gold. Under Colbert, France pioneered protectionism, tripling its import tariffs to make foreign goods prohibitively expensive.
At the same time, he strengthened France’s domestic industries by providing subsidies and granting them monopolies. Colonies and government trading companies were established to ensure France could benefit from the highly lucrative trade in goods such as spices, sugar – and slaves.
Colbert oversaw the expansion of French industries into areas like lace and glass-making, importing skilled craftsmen from Italy and granting these new companies state monopolies. He invested heavily in infrastructure such as the Canal du Midi, and dramatically increased the size of France’s navy and merchant marine to challenge its British and Dutch rivals.
Global trade at this time was highly exploitative, involving the forced seizure of gold and other raw materials from newly discovered lands (as Spain had been doing with its conquests in the New World from the late 15th century). It also meant benefiting from the trade in humans, with huge profits as slaves were seized and sent to the Caribbean and other colonies to produce sugar and other crops.
In this era of mercantilism, trade wars often led to real wars, fought across the globe to control trade routes and seize colonies. Following Colbert’s reforms, France began a long struggle to challenge the overseas empires of its maritime rivals, while also engaging in wars of conquest in continental Europe.
France initially enjoyed success in the 17th century both on land and sea against the Dutch. But ultimately, its state-run French Indies company was no rival to the ruthless, commercially driven activities of the Dutch and British East India companies, which delivered enormous profits to their shareholders and revenues for their governments.
Indeed, the huge profits made by the Dutch from the Far Eastern spice trade explains why they had no hesitation in handing over their small North American colony of New Amsterdam, in return for expelling the British from a small toehold of one of their spice islands in what is now Indonesia. In 1664, that Dutch outpost was renamed New York.
After a century of conflict, Britain gradually gained ascendancy over France, conquering India and forcing its great rival to cede Canada in 1763 after the Seven Years war. France never succeeded in fully countering Britain’s naval strength. Resounding defeats by fleets led by Horatio Nelson in the early 19th century, coupled with Napoleon’s defeat at Waterloo by a coalition of European powers, marked the end of France’s time as Europe’s hegemonic power.

Yale Center for British Art/Wikimedia
But while the French model of globalisation ultimately failed in its attempt to dominate the world economy, that has not prevented other countries – and now President Trump – from embracing its principles.
France found that tariffs alone could not sufficiently fund its wars nor boost its industries. Its broad version of mercantilism led to endless wars that spread around the globe, as countries retaliated both economically and militarily and tried to seize territories.
More than two centuries later, there is an uncomfortable parallel with what the results of Trump’s endless tariff wars might bring, both in terms of ongoing conflict and the organisation of rival trade blocs. It also shows that more protectionism, as proposed by Trump, will not be enough to revive the US’s domestic industries.
British model: free trade and empire
The ideology of free trade was first spelled out by British economists Adam Smith and David Ricardo, the founding fathers of classical economics. They argued trade was not a zero-sum game, as Colbert had suggested, but that all countries could mutually benefit from it. According to Smith’s classic text, The Wealth of Nations (1776):
If a foreign country can supply us with a commodity cheaper than we ourselves can make, better buy it off them with some part of the produce of our own industry, employed in such a way that we have some advantages.
As the world’s first industrial nation, by the 1840s Britain had created an economic powerhouse based on the new technologies of steam power, the factory system, and railroads.
Smith and Ricardo argued against the creation of state monopolies to control trade, proposing minimal state intervention in industry. Ever since, Britain’s belief in the benefits of free trade has proved stronger and more long-lasting than any other major industrial power – more deeply embedded in both its politics and popular imagination.
This ironclad commitment was born out of a bitter political struggle in the 1840s between manufacturers and landowners over the protectionist Corn Laws. The landowners who had traditionally dominated British politics backed high tariffs, which benefited them but resulted in higher prices for staples like bread. The repeal of the Corn Laws in 1846 upended British politics, signalling a shift of power to the manufacturing classes – and ultimately to their working-class allies once they gained the right to vote.

Wikimedia
In time, Britain’s advocacy of free trade unleashed the power of its manufacturing to dominate global markets. Free trade was framed as the way to raise living standards for the poor (the exact opposite of President Trump’s claim that it harms workers) and had strong working-class support. When the Conservatives floated the idea of abandoning free trade in the 1906 general election, they suffered a devastating defeat – the party’s worst until 2024.
As well as trade, a central element in Britain’s role as the new global hegemonic power was the rise of the City of London as the world’s leading financial centre. The key was Britain’s embrace of the gold standard which put its currency, the pound, at the heart of the new global economic order by linking its value to a fixed amount of gold, ensuring its value would not fluctuate. Thus the pound became the worldwide medium of exchange.
This encouraged the development of a strong banking sector, underpinned by the Bank of England as a credible and trustworthy “lender of last resort” in a financial crisis. The result was a huge boom in international investment, opening access to overseas markets for British companies and individual investors.
In the late 19th century, the City of London dominated global finance, investing in everything from Argentinian railways and Malaysian rubber plantations to South African gold mines. The gold standard became a talisman of Britain’s power to dominate the world economy.
The pillars of Britain’s global economic dominance were a highly efficient manufacturing sector, a commitment to free trade to ensure its industry had access to global markets, and a highly developed financial sector which invested capital around the world and reaped the benefits of global economic development. But Britain also did not hesitate to use force to open up foreign markets – for example, during the Opium Wars of the 1840s, when China was compelled to open its markets to the lucrative trade in opium from British-owned India.
By the end of the 19th century, the British empire incorporated one quarter of the world’s population, providing a source of cheap labour and secure raw materials as well as a large market for Britain’s manufactured goods. But that was still not enough for its avaricious leaders: Britain also made sure that local industries did not threaten its interests – by undermining the Indian textile industry, for example, and manipulating the Indian currency.
In reality, globalisation in this era was about domination of the world economy by a few rich European powers, meaning that much global economic development was curtailed to protect their interests. Under British rule between 1750 and 1900, India’s share of world industrial output declined from 25% to 2%.
But for those at the centre of Britain’s global formal and informal empire, such as the middle-class residents of London, this was a halcyon time – as economist John Maynard Keynes would later recall:
For middle and upper classes … life offered, at a low cost and with the least trouble, conveniences, comforts and amenities beyond the compass of the richest and most powerful monarchs of other ages. The inhabitant of London could order by telephone, sipping his morning tea in bed, the various products of the whole Earth, in such quantity as he might see fit, and reasonably expect their early delivery upon his doorstep.
US model: protectionism to neoliberalism
While Britain enjoyed its century of global dominance, the United States embraced protectionism for longer after its foundation in 1776 than all other major western economies.
The introduction of tariffs to protect and subsidise emerging US industries had first been articulated in 1791 by the fledgling nation’s first treasury secretary, Alexander Hamilton – Caribbean immigrant, founding father and future subject of a record-breaking musical. The Whig party under Henry Clay and its successor, the Republican Party, were both strong supporters of this policy for most of the 19th century. Even as US industry grew to overshadow all others, its government maintained some of the highest tariff barriers in the world.

Wikimedia
Tariff rates rose to 50% in the 1890s with the backing of future president William McKinley, both to help industrialists and pay for generous pensions for 2 million civil war veterans and their dependants – a key part of the Republican electorate. It is no accident that President Trump has festooned the White House with pictures of Hamilton, Clay and McKinley – all supporters of protectionism and high tariffs.
In part, the US’s enduring resistance to free trade was because it had access to an internal supply of seemingly limitless raw materials, while its rapidly growing population, fuelled by immigration, provided internal markets that fuelled its growth while keeping out foreign competition.
By the late 19th century, the US was the world’s biggest steel producer with the largest railroad system in the world and was moving rapidly to exploit the new technologies of the second industrial revolution – based on electricity, petrol engines and chemicals. Yet it was only after the second world war that the US assumed the role of global superpower – in part because it was the only country on either side of the war that had not suffered severe damage to its economy and infrastructure.
In the wake of global destruction in Europe and Asia, the US’s dominance was political, military and cultural, as well as financial – but the US vision of a globalised world had some important differences from its British predecessor.
The US took a much more universalist and rules-based approach, focusing on the creation of global organisations that would establish binding regulations – and open up global markets to unfettered American trade and investment. It also aimed to dominate the international economic order by replacing the pound sterling with the US dollar as the global medium of exchange.
Within a week of its entry in the second world war, plans were laid to establish US global financial hegemony. The US treasury secretary, Henry Morgenthau, began work on establishing an “inter-allied stabilisation fund” – a playbook for post-war monetary arrangements which would enshrine the US dollar at its heart.
This led to the creation of the International Monetary Fund (IMF) and World Bank at the Bretton Woods conference in New Hampshire in 1944 – institutions dominated by the US, which encouraged other countries to adopt the same economic model both in terms of free trade and free enterprise. The Allied nations who were simultaneously meeting to establish the United Nations to try to ensure future world peace, having suffered the devastating effects of the Great Depression and war, welcomed the US’s commitment to shape a new, more stable economic order.
As the world’s biggest and strongest economy, there was (initially) little resistance to this US plan for a new international economic order in its own image. The motive was as much political as economic: the US wanted to provide economic benefits to ensure the loyalty of its key allies and counter the perceived threat of a communist takeover – in complete contrast to Trump’s mercantilist view today that all other countries are out to “rip off” the US, and that its own military might means it has no real need for allies.
After the war finally ended, the US dollar, now linked to gold at a fixed rate of $35 per ounce to guarantee its stability, assumed the role as the free world’s principal currency. It was both used for global trade transactions and held by foreign central banks as their currency reserves – giving the US economy an “exorbitant privilege”. The stable value of the dollar also made it easier for the US government to sell Treasury bonds to foreign investors, enabling it to more easily borrow money and run up trade deficits with other countries.
The conditions were set for an era of US political, financial and cultural dominance, which saw the rise of globally admired brands such as McDonald’s and Coca Cola, as well as a powerful US marketing arm in the form of Hollywood. Perhaps even more significantly, the relaxed, well-funded campuses of California would prove a perfect petri dish for the development of new computer technologies – backed initially by cold war military investment – which, decades later, would lead to the birth of the big-tech companies that dominate the tech landscape today.
The US view of globalisation was broader and more interventionist than the British model of free trade and empire. Rather than having a formal empire, it wanted to open up access to the entire world economy, which would provide global markets for American products and services.
The US believed you needed global economic institutions to police these rules. But as in the British case, the benefits of globalisation were still unevenly shared. While countries that embraced export-led growth such as Japan, Korea and Germany prospered, other resource-rich but capital-poor countries such as Nigeria only fell further behind.
From dream to despair
Though the legend of the American dream grew and grew, by the 1970s the US economy was coming under increasing pressure – in particular from German and Japanese rivals, who by then had recovered from the war and modernised their industries.
Troubled by these perceived threats and a growing trade deficit, in 1971 President Richard Nixon stunned the world by announcing that the US was going off the gold standard – forcing other countries to bear the cost of adjustment for the US balance of payments crisis by making them revalue their currencies. This had a profound effect on the global financial system: within a decade, most major currencies had abandoned fixed exchange rates for a new system of floating rates, effectively ending the 1944 Bretton Woods settlement.
The end of fixed exchange rates opened the door to the “financialisation” of the global economy, vastly expanding global investment and lending – much of it by US financial firms. This gave succour to the burgeoning neoliberal movement that sought to further rewrite the rules of the financial world order. In the 1980s and ’90s, these policy prescriptions became known as the Washington consensus: a set of rules – including opening markets to foreign investment, deregulation and privatisation – that was imposed on developing economies in crisis, in return for them receiving support from US-led organisations like the World Bank and IMF.
In the US, meanwhile, the increasing reliance on the finance and hi-tech sectors increased levels of inequality and fostered resentment in large parts of American society. Both Republicans and Democrats embraced this new world order, shaping US policy to favour their hi-tech and financial allies. Indeed, it was the Democrats who played a key role in deregulating the financial sector in the 1990s.
Meanwhile, the decline of US manufacturing industries accelerated, as did the gap between the incomes of those in the hinterland, where manufacturing was based, and residents of the large metropolitan cities.
By 2023, the lowest 50% of US citizens received just 13% of total personal income, while the top 10% received almost half (47%). The wealth gap was even greater, with the bottom 50% only having 6% of total wealth, while a third (36%) was held by just the top 1%. Since 1980, real incomes of the bottom 50% have barely grown for four decades.
The bottom half of the US population was suffering from a surge in “deaths of despair” – a term coined by the Nobel-winning economist Angus Deaton to describe high mortality rates from drug abuse, suicide and murder among younger working-class Americans. Rising costs of housing, medical care and university education all contributed to widespread indebtedness and growing financial insecurity. By 2019, a study found that two-thirds of people who filed for bankruptcy cited medical issues as a key reason.
The decline in US manufacturing accelerated after China was admitted to the World Trade Organization in 2001, increasing America’s soaring trade and budget deficit even more. Political and business elites hoped the move would open up the huge Chinese market to US goods and investment, but China’s rapid modernisation made its industry more competitive than its American rivals in many fields.
Ultimately, this era of intensive financialisation of the world economy created a series of regional and then global financial crises, damaging the economies of many Latin American and Asian economies. This culminated in the 2008 global financial crisis, precipitated by reckless lending by US financial institutions. The world economy took more than a decade to recover as countries wrestled with slower growth, lower productivity and less trade than before the crisis.
For those who chose to read it, the writing was on the wall for America’s era of global domination decades ago. But it would take Trump’s victory in the 2016 presidential election – a profound shock to many in the US “liberal establishment” – to make clear that the US was now on a very different course that would shake up the world.
Making a bad situation more dangerous
In my view, Trump is the first modern-day US president to fully understand the powerful alienation felt by many working-class American voters, who believed they were left out of the US’s immense post-war economic growth that so benefited the largely urban American middle classes. His strongest supporters have always been lower-middle-class voters from rural areas who are not college-educated.
Yet Trump’s key policies will ultimately do little for them. High tariffs to protect US jobs, expulsion of millions of illegal immigrants, dismantling protections for minorities by opposing DEI (diversity, equality and inclusion) programmes, and drastically cutting back the size of government will have increasingly negative economic consequences in the future, and are very unlikely to restore the US economy to its previous dominant position.
Long before he first became president, Trump hated the eye-watering US trade deficit (he’s a businessman, after all) – and believed that tariffs would be a key weapon for ensuring US economic dominance could be maintained. Another key part of his “America First” ideology was to repudiate the international agreements that were at the heart of the US’s postwar approach to globalisation.
In his first term, however, Trump (having not expected to win) was ill-prepared for power. But second time around, conservative thinktanks had spent years outlining detailed policies and identifying key personnel who could implement the radical U-turn in US economic policy.
Under Trump 2.0, we have seen a return to the mercantilist point of view reminiscent of France in the 17th and 18th centuries. His assertion that countries which ran a trade surplus with the US “were ripping us off” echoed the mercantilist belief that trade was a zero-sum game – rather than the 20th-century view, pioneered by the US, that globalisation brings benefits to all, no matter the precise balance of that trade.
Trump’s tax-and-tariff plans, which extend the tax breaks to the very rich while reducing benefits for the poor through benefit cuts and tariff-driven inflation, will increase inequality in the US.
At the same time, the passing of the One Big Beautiful Bill is predicted to add some US$3.5 trillion to US government debt – even after the Elon Musk-led “Department of Government Efficiency” cuts imposed on many Washington departments. This adds pressure to the key US Treasury bond market at the centre of the world financial system, and raises the cost of financing the huge US deficit while weakening its credit rating. Continuing these policies could threaten a default by the US, which would have devastating consequences for the entire global financial system.
For all the macho grandstanding from Trump and his supporters, his economic policies are a demonstration of American weakness, not strength. While I believe his highlighting of some of the ills of the US economy were overdue, the president is rapidly squandering the economic credibility and good will that the US built up in the postwar years, as well as its cultural and political hegemony. For people living in America and elsewhere, he is making a bad situation more dangerous – including for many of his most ardent supporters.
That said, even without Trump’s economic and societal disruptions, the end of the US era of hegemonic dominance would still have happened. Globalisation is not dead, but it is dying. The troubling question we all face now, is what happens next.
This is the first of a two-part Insights long read on the rise and fall of globalisation. Read part two here: why the next global financial meltdown could be much worse with the US on the sidelines.
About the Author:
Steve Schifferes, Honorary Research Fellow, City Political Economy Research Centre, City St George’s, University of London
This article is republished from The Conversation under a Creative Commons license. Read the original article.


