
By RoboForex Analytical Department
Gold continues falling – by Monday 19 September, it has reached $1,664. Earlier, it rebounded from the resistance level at $1,680 to indicate how strong the bearish pressure still is. This week, investors are expecting another aggressive rate hike from the US FOMC to continue its fight against growing inflation. Market players believe that it will be a 75-point hike, but if the regulator raises the rate by 1%, it might force Gold to continue plummeting.
Despite the fact that Gold usually acts as a “safe haven” asset” when inflation rises, high interest rates increase expenditures to store physical Gold. At the same time, increasing economic risks do not inspire market players to buy such “safe haven” assets, making the USD a more preferable investment.
Since mid-2020, Gold has been stuck inside a sideways channel between $2,065 and $1,680. If bears succeed to keep the metal at the current levels (and there are no fundamental reasons that might hint at a possible reversal so far), Gold might plummet to $1,300 in the long-term.
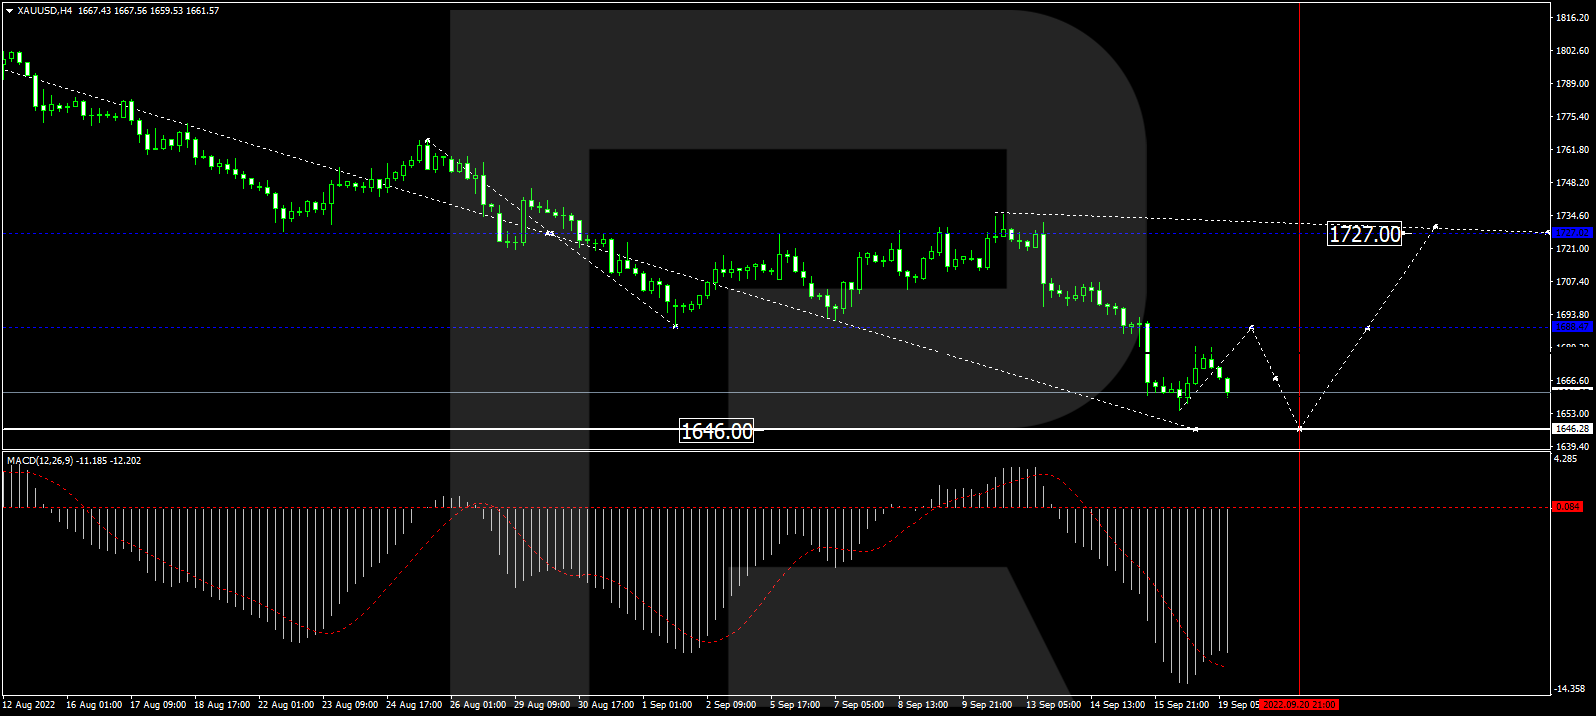
As we can see in the H4 chart, after rebounding from 1730.00, XAU/USD is forming another descending wave towards 1646.00. Later, the market may start a new growth with the target at 1727.00. From the technical point of view, this scenario is confirmed by MACD Oscillator: its signal line is moving below 0 outside the histogram area. In the future, the line may reverse and grow towards 0.
Free Reports:
 Get our Weekly Commitment of Traders Reports - See where the biggest traders (Hedge Funds and Commercial Hedgers) are positioned in the futures markets on a weekly basis.
 Download Our Metatrader 4 Indicators – Put Our Free MetaTrader 4 Custom Indicators on your charts when you join our Weekly Newsletter
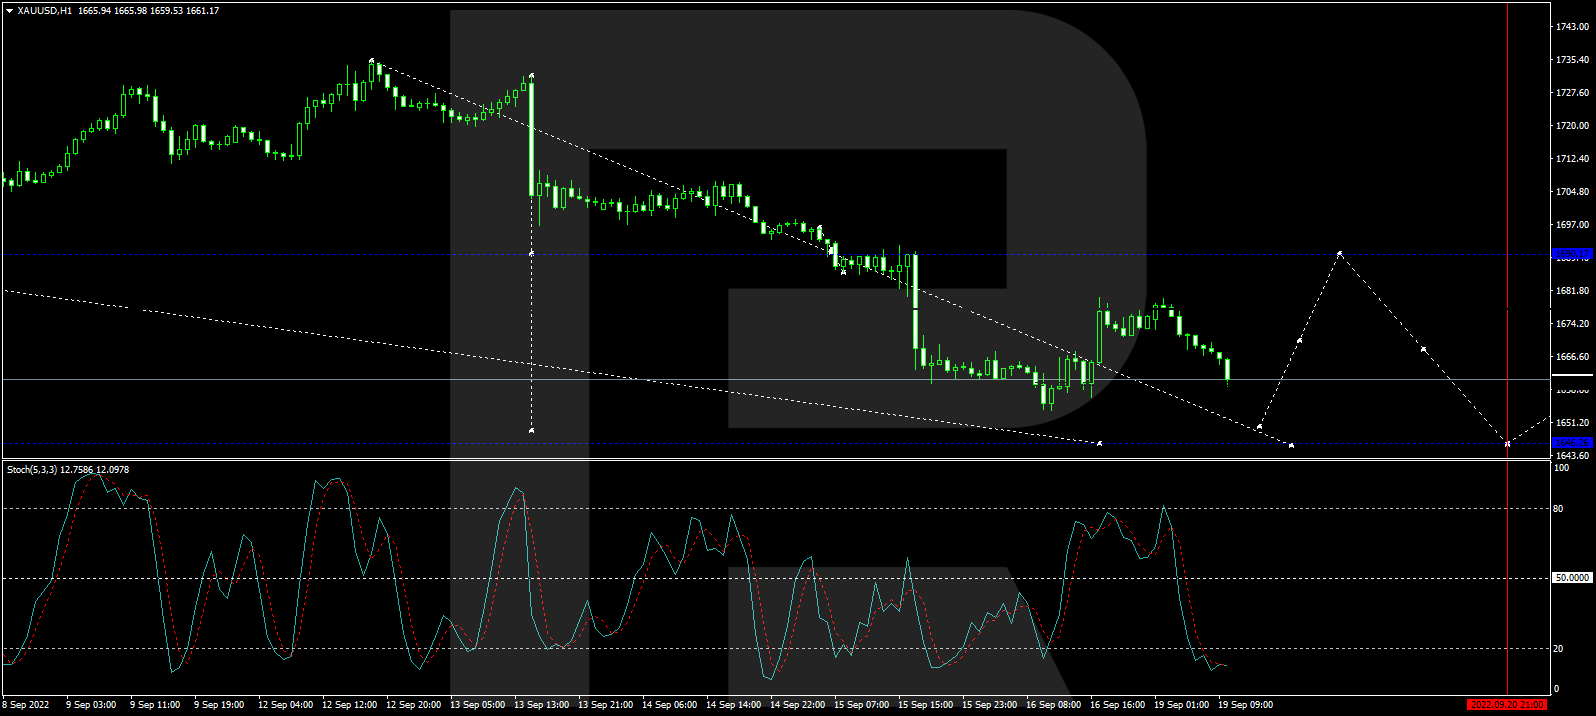
In the H1 chart, Gold continues trading downwards with the short-term target at 1650.00. Later, the market may grow towards 1690.00 and then resume falling to reach 1646.00. From the technical point of view, this scenario is confirmed by the Stochastic Oscillator: its signal is moving below 20 and may soon grow towards 50. After that, the line may resume falling to return to 20.
Disclaimer
Any predictions contained herein are based on the author’s particular opinion. This analysis shall not be treated as trading advice. RoboForex shall not be held liable for the results of the trades arising from relying upon trading recommendations and reviews contained herein.

- COT Metals Charts: Weekly Speculator Bets led by Copper & Steel Jul 18, 2026
- COT Bonds Charts: Weekly Speculator Bets led by 2-Year, SOFR 3M & 5-Year Bonds Jul 18, 2026
- COT Energy Charts: Weekly Speculator Bets led by Brent Oil & Heating Oil Jul 18, 2026
- COT Soft Commodities Charts: Weekly Speculator Bets led by Wheat, Corn & Soybean Meal Jul 18, 2026
- The Bank of Canada kept its interest rate unchanged. Platinum prices reached a three‑week high Jul 16, 2026
- Stock indices rose after the release of US inflation data. China’s GDP slowed sharply Jul 15, 2026
- GBP/USD Awaits Political News: What Will Happen Next Jul 15, 2026
- USD/JPY Holds at Highs: Pressure Lingers on Yen Jul 14, 2026
- Oil prices jumped 4% amid a new wave of escalation between the US and Iran Jul 13, 2026
- EUR/USD: US Inflation Will Determine Everything Jul 13, 2026