
By InvestMacro

Here are the latest charts and statistics for the Commitment of Traders (COT) reports data published by the Commodities Futures Trading Commission (CFTC).
The latest COT data is updated through Tuesday September 13th and shows a quick view of how large traders (for-profit speculators and commercial hedgers) were positioned in the futures markets.
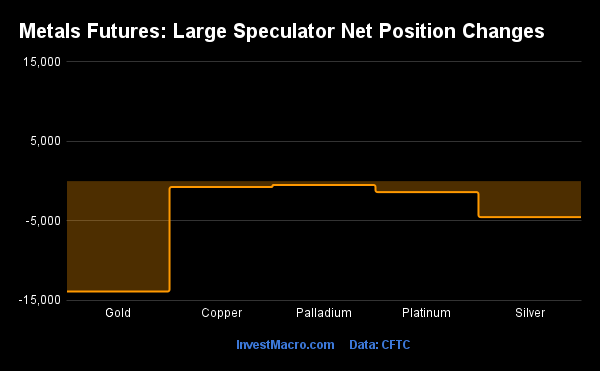
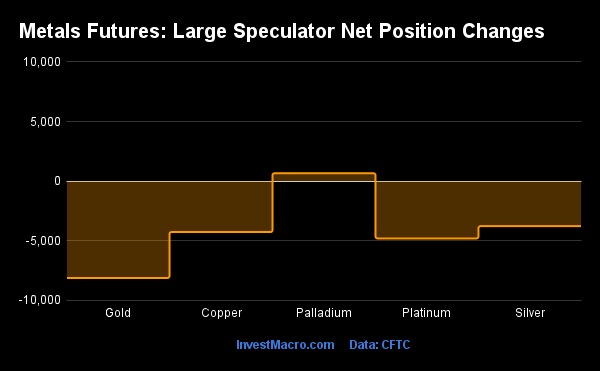
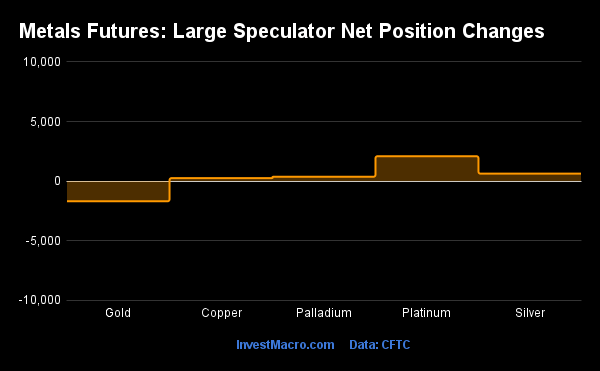
Weekly Speculator Changes led higher by Silver, Copper & Platinum
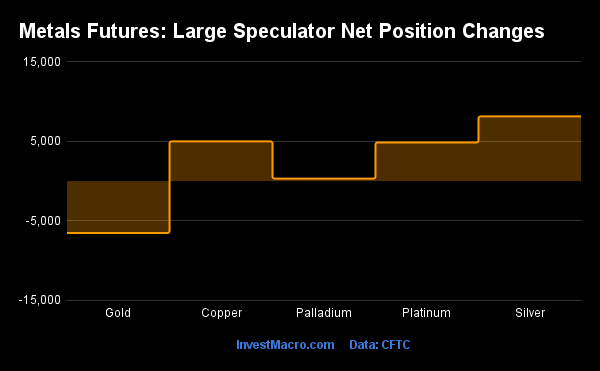
The COT precious metals speculator bets were higher this week as four out of the five metals markets we cover had higher positioning this week with just one market having decreasing contracts.
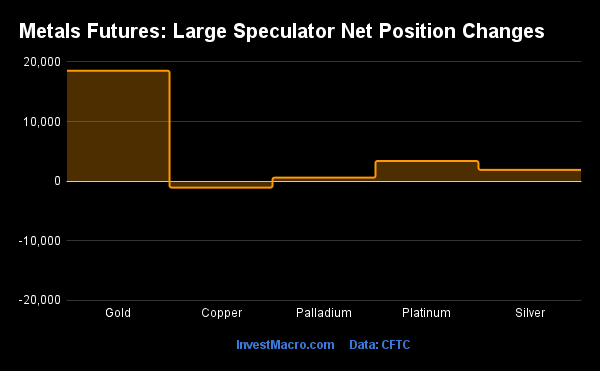
Leading the gains for the precious metals markets was Silver (8,144 contracts) with Copper (5,004 contracts), Platinum (4,872 contracts) and Palladium (329 contracts) also showing positive weeks.
The metals markets leading the declines in speculator bets this week was Gold with a decline of -6,513 contracts the week.
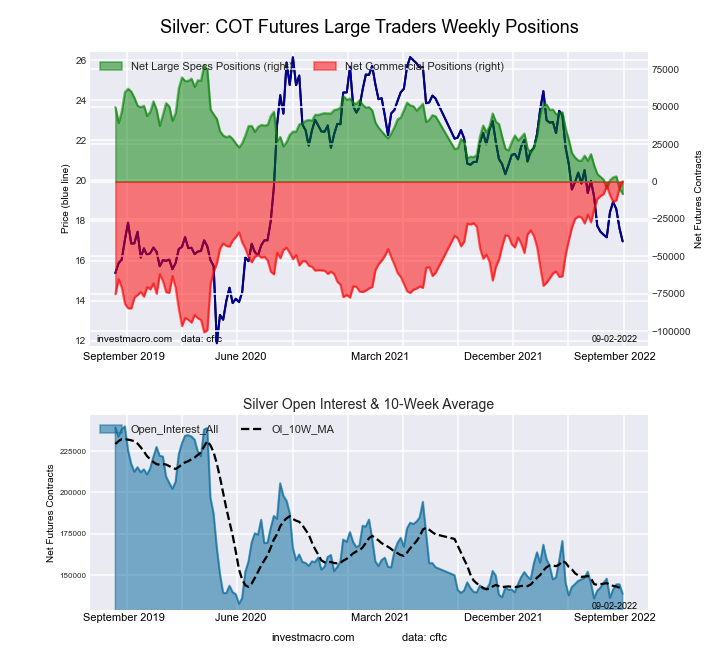
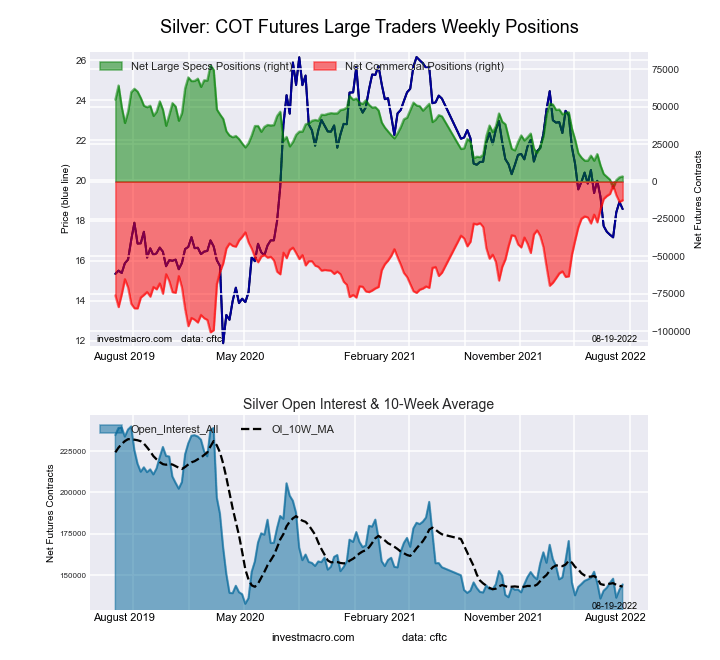
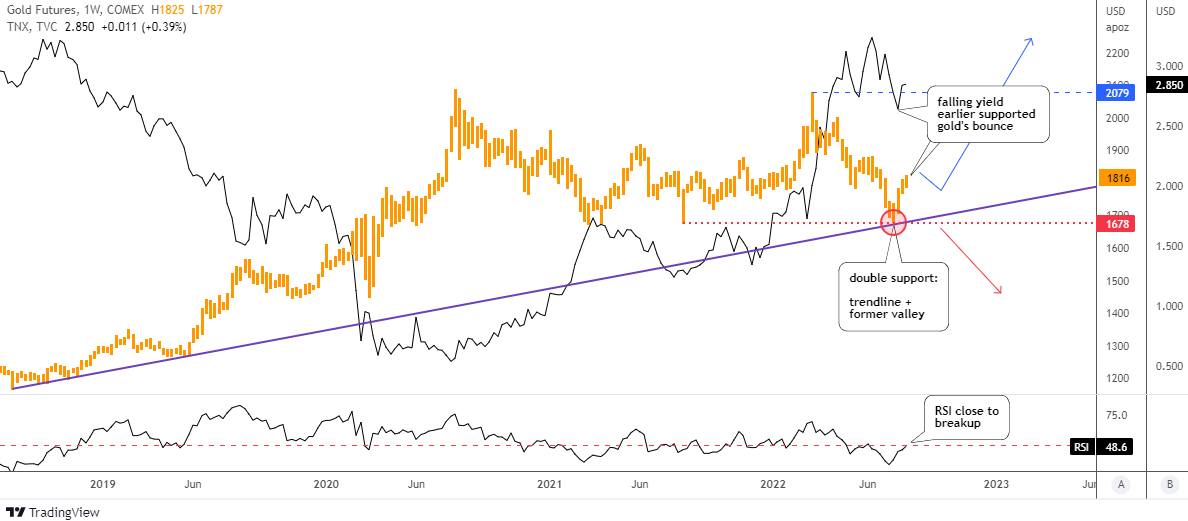
Highlighting the COT metals data this week was Silver’s gain that stopped a streak of three straight weeks of declines. Silver speculator positions had fallen by a total of -16,292 contracts in the past three weeks to drop to the most bearish level since May 28th of 2019, a span of 171 weeks. The Silver price has been showing resilience between the $18 to $20 range over the past twelve weeks and closed this week over the $19.30 price level.
| Sep-13-2022 | OI | OI-Index | Spec-Net | Spec-Index | Com-Net | COM-Index | Smalls-Net | Smalls-Index |
|---|---|---|---|---|---|---|---|---|
| WTI Crude | 1,498,059 | 3 | 227,057 | 4 | -244,007 | 98 | 16,950 | 28 |
| Gold | 463,674 | 3 | 97,344 | 2 | -110,938 | 99 | 13,594 | 9 |
| Silver | 135,530 | 3 | -4,640 | 9 | -2,551 | 93 | 7,191 | 4 |
| Copper | 157,900 | 0 | -18,986 | 23 | 20,512 | 80 | -1,526 | 16 |
| Palladium | 6,085 | 1 | -1,273 | 16 | 1,455 | 83 | -182 | 33 |
| Platinum | 68,574 | 36 | -1,879 | 7 | -2,051 | 93 | 3,930 | 17 |
| Natural Gas | 977,116 | 4 | -145,715 | 35 | 110,794 | 66 | 34,921 | 63 |
| Brent | 164,415 | 12 | -39,023 | 46 | 34,919 | 51 | 4,104 | 65 |
| Heating Oil | 290,916 | 31 | 16,064 | 66 | -31,353 | 38 | 15,289 | 51 |
| Soybeans | 643,018 | 15 | 92,110 | 42 | -61,424 | 68 | -30,686 | 19 |
| Corn | 1,310,411 | 6 | 294,569 | 68 | -234,179 | 39 | -60,390 | 8 |
| Coffee | 197,657 | 10 | 42,267 | 75 | -44,360 | 29 | 2,093 | 19 |
| Sugar | 751,873 | 9 | 68,330 | 51 | -79,426 | 53 | 11,096 | 22 |
| Wheat | 287,046 | 0 | -8,128 | 8 | 12,977 | 78 | -4,849 | 85 |
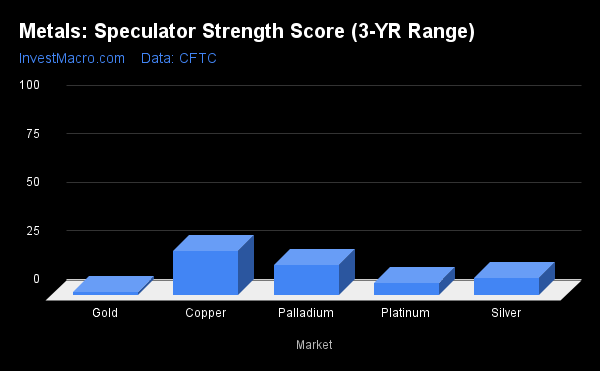
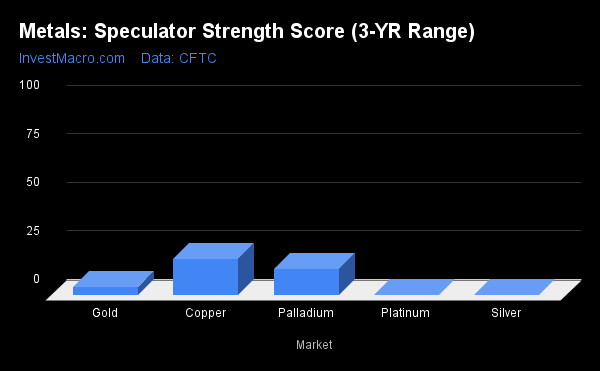
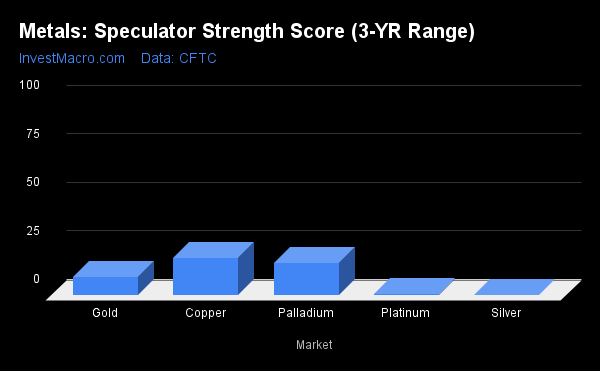
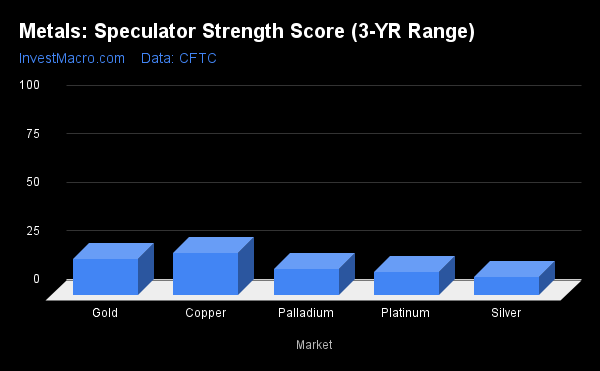
Strength Scores
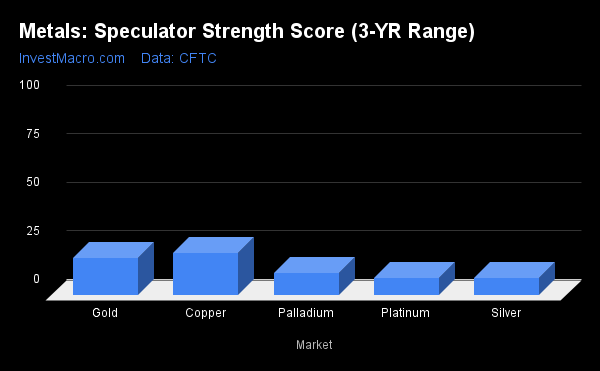
Strength scores (a measure of the 3-Year range of Speculator positions, from 0 to 100 where above 80 is extreme bullish and below 20 is extreme bearish) showed that Copper (22.7 percent) leads the metals markets and is just out of a bearish extreme level (below 20 percent).
On the downside, all the other markets are currently below 20 percent and in bearish extreme positions. Gold (1.8 percent) continues to be at the lowest strength level and near the bottom of it 3-Year range. Platinum (6.6 percent), Silver (9.0 percent) and Palladium (15.7 percent) are the next lowest markets.
Strength Statistics:
Gold (1.8 percent) vs Gold previous week (4.3 percent)
Silver (9.0 percent) vs Silver previous week (0.0 percent)
Copper (22.7 percent) vs Copper previous week (18.8 percent)
Platinum (6.6 percent) vs Platinum previous week (0.0 percent)
Palladium (15.7 percent) vs Palladium previous week (13.8 percent)
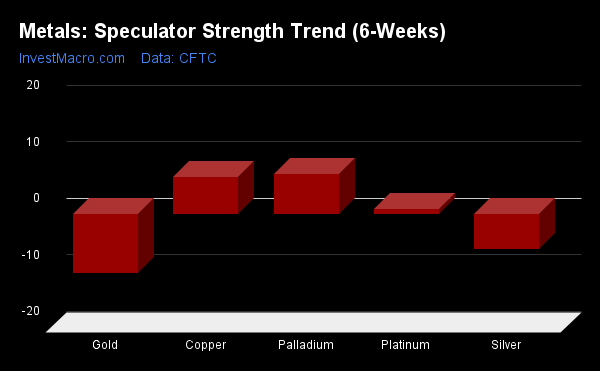
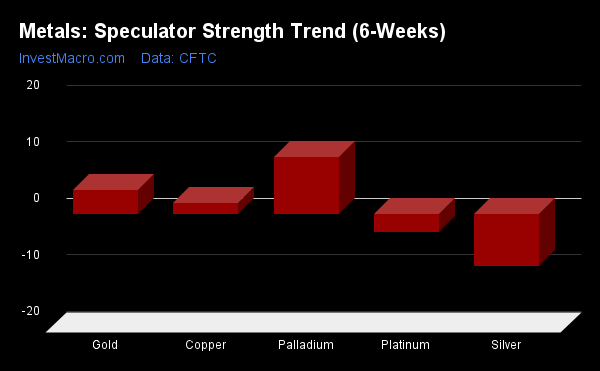
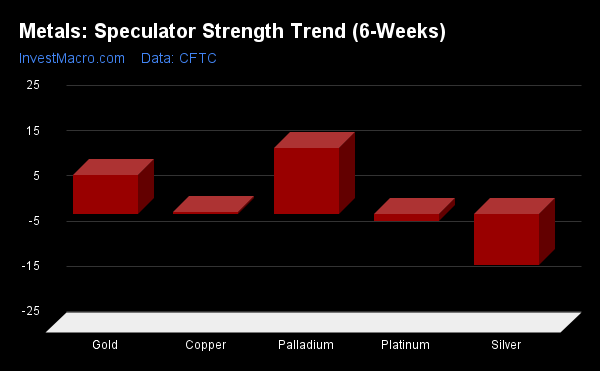
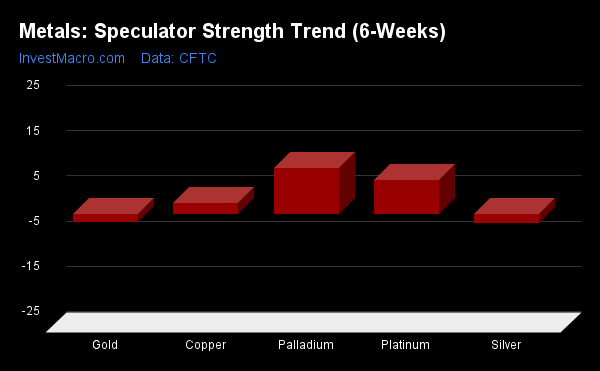
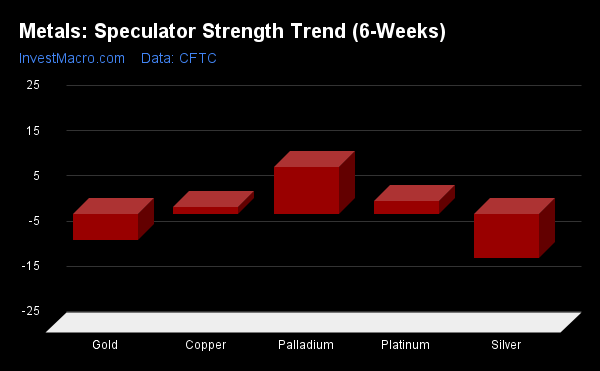
Strength Trends led by Palladium and Copper
Strength Score Trends (or move index, calculates the 6-week changes in strength scores) showed that Palladium (7.2 percent) leads the past six weeks trends for metals this week. Copper (6.6 percent) and Platinum (0.9 percent) are the only other positive movers in the latest trends data.
Gold (-10.3 percent) leads the downside trend scores currently followed by Silver with a -6.2 percent trend score.
Move Statistics:
Gold (-10.3 percent) vs Gold previous week (4.3 percent)
Silver (-6.2 percent) vs Silver previous week (-9.1 percent)
Copper (6.6 percent) vs Copper previous week (2.0 percent)
Platinum (0.9 percent) vs Platinum previous week (-3.1 percent)
Palladium (7.2 percent) vs Palladium previous week (10.2 percent)
Individual Markets:
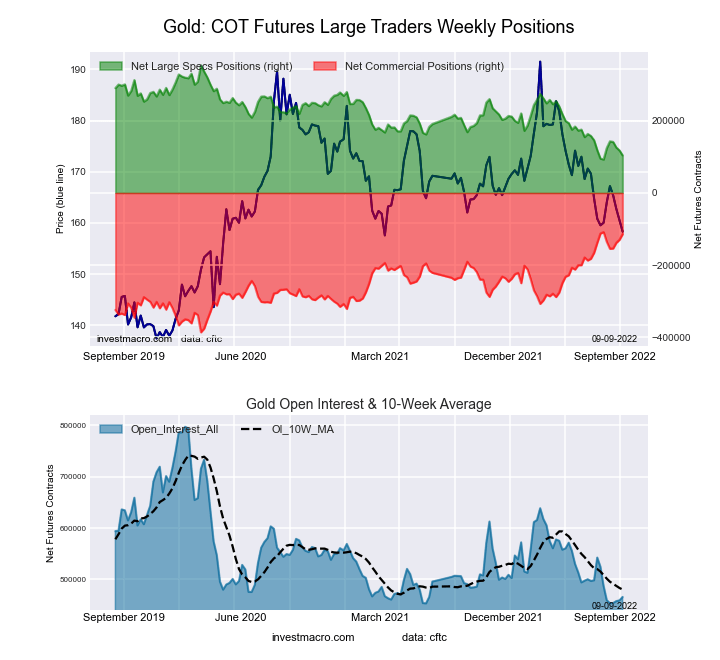
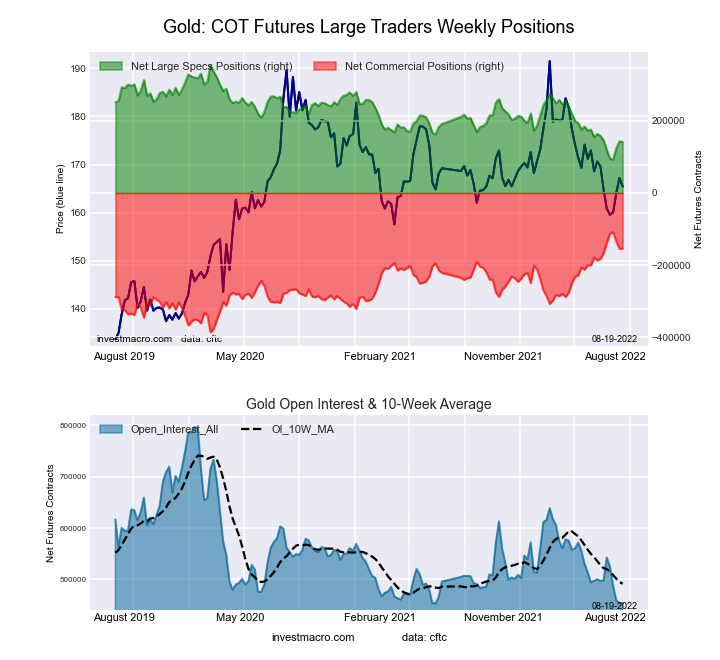
Gold Comex Futures:
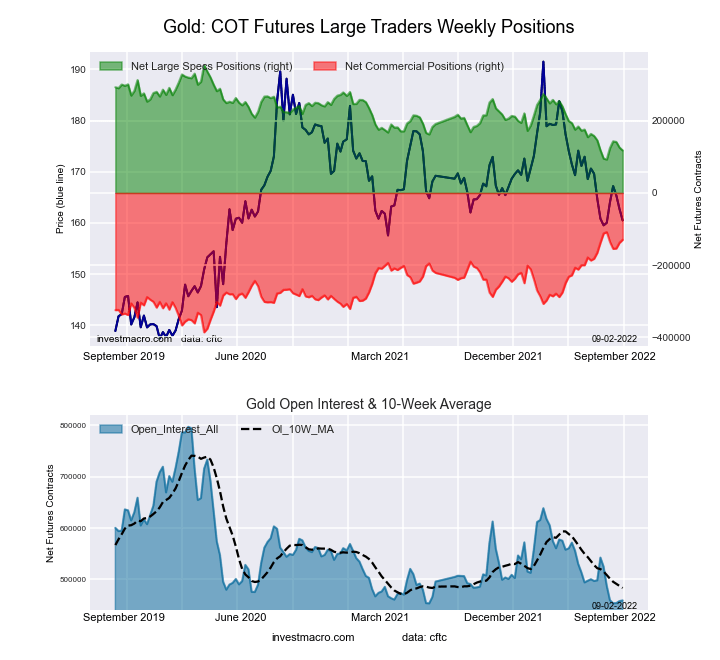
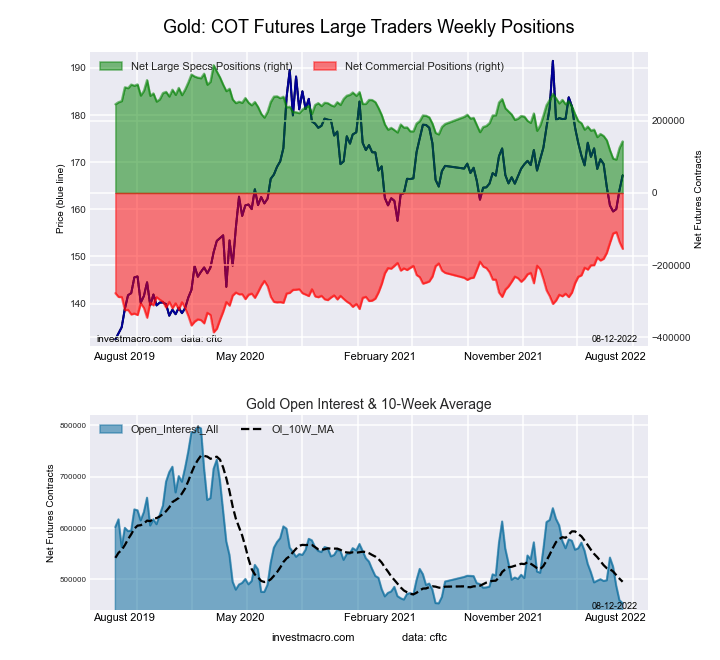
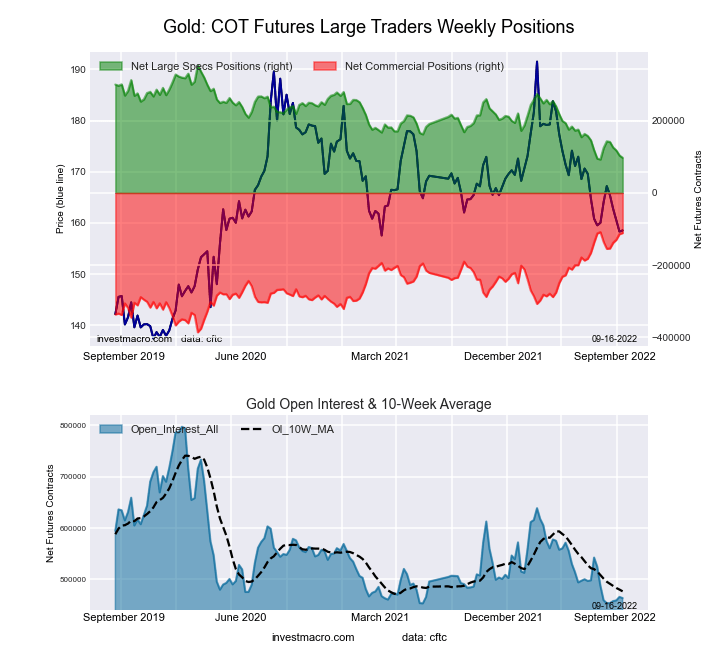 The Gold Comex Futures large speculator standing this week totaled a net position of 97,344 contracts in the data reported through Tuesday. This was a weekly decrease of -6,513 contracts from the previous week which had a total of 103,857 net contracts.
This week’s current strength score (the trader positioning range over the past three years, measured from 0 to 100) shows the speculators are currently Bearish-Extreme with a score of 1.8 percent. The commercials are Bullish-Extreme with a score of 99.1 percent and the small traders (not shown in chart) are Bearish-Extreme with a score of 9.0 percent.
| Gold Futures Statistics | SPECULATORS | COMMERCIALS | SMALL TRADERS |
| – Percent of Open Interest Longs: | 48.7 | 27.4 | 8.7 |
| – Percent of Open Interest Shorts: | 27.7 | 51.3 | 5.8 |
| – Net Position: | 97,344 | -110,938 | 13,594 |
| – Gross Longs: | 225,932 | 126,950 | 40,556 |
| – Gross Shorts: | 128,588 | 237,888 | 26,962 |
| – Long to Short Ratio: | 1.8 to 1 | 0.5 to 1 | 1.5 to 1 |
| NET POSITION TREND: | |||
| – Strength Index Score (3 Year Range Pct): | 1.8 | 99.1 | 9.0 |
| – Strength Index Reading (3 Year Range): | Bearish-Extreme | Bullish-Extreme | Bearish-Extreme |
| NET POSITION MOVEMENT INDEX: | |||
| – 6-Week Change in Strength Index: | -10.3 | 8.9 | 6.3 |
Silver Comex Futures:
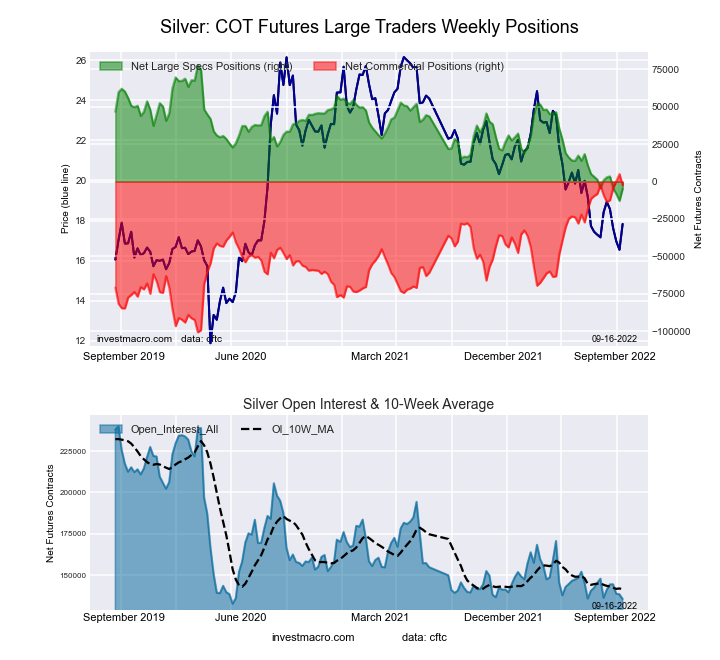 The Silver Comex Futures large speculator standing this week totaled a net position of -4,640 contracts in the data reported through Tuesday. This was a weekly advance of 8,144 contracts from the previous week which had a total of -12,784 net contracts.
This week’s current strength score (the trader positioning range over the past three years, measured from 0 to 100) shows the speculators are currently Bearish-Extreme with a score of 9.0 percent. The commercials are Bullish-Extreme with a score of 92.8 percent and the small traders (not shown in chart) are Bearish-Extreme with a score of 3.8 percent.
| Silver Futures Statistics | SPECULATORS | COMMERCIALS | SMALL TRADERS |
| – Percent of Open Interest Longs: | 39.4 | 38.2 | 16.1 |
| – Percent of Open Interest Shorts: | 42.8 | 40.1 | 10.8 |
| – Net Position: | -4,640 | -2,551 | 7,191 |
| – Gross Longs: | 53,373 | 51,822 | 21,808 |
| – Gross Shorts: | 58,013 | 54,373 | 14,617 |
| – Long to Short Ratio: | 0.9 to 1 | 1.0 to 1 | 1.5 to 1 |
| NET POSITION TREND: | |||
| – Strength Index Score (3 Year Range Pct): | 9.0 | 92.8 | 3.8 |
| – Strength Index Reading (3 Year Range): | Bearish-Extreme | Bullish-Extreme | Bearish-Extreme |
| NET POSITION MOVEMENT INDEX: | |||
| – 6-Week Change in Strength Index: | -6.2 | 6.2 | -4.4 |
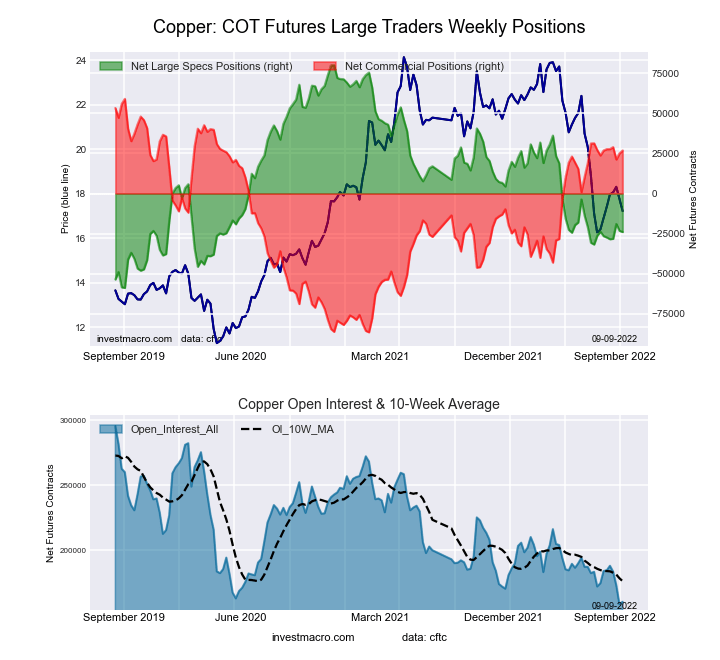
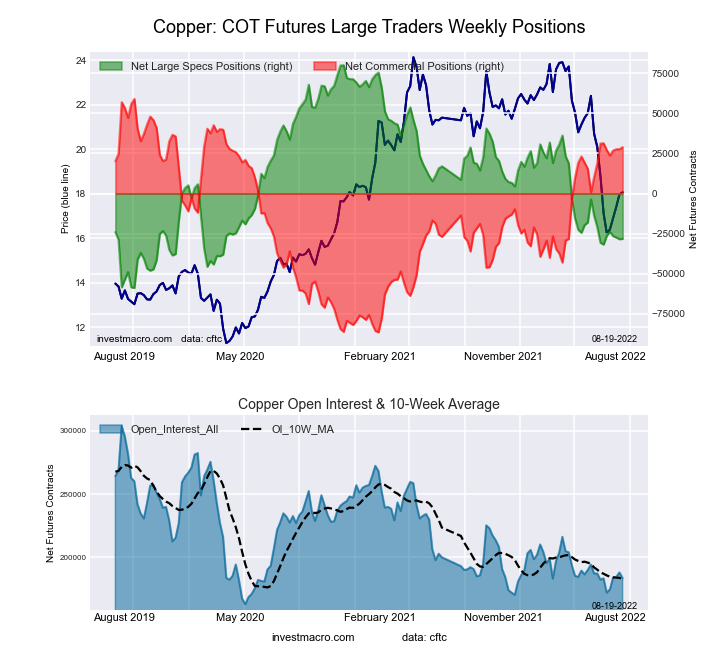
Copper Grade #1 Futures:
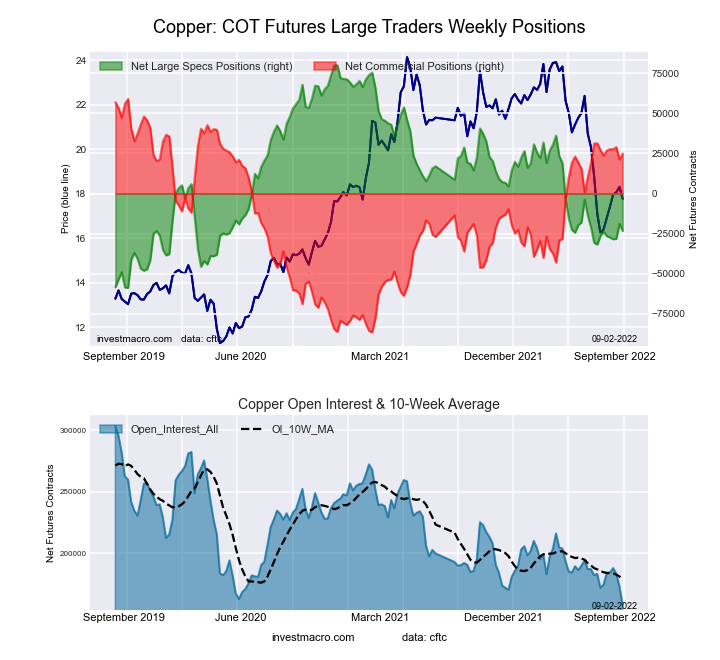
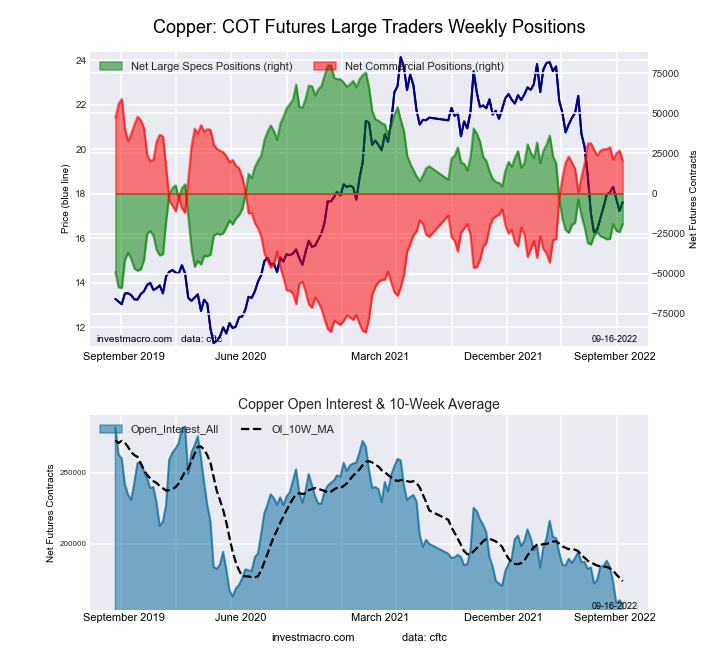 The Copper Grade #1 Futures large speculator standing this week totaled a net position of -18,986 contracts in the data reported through Tuesday. This was a weekly advance of 5,004 contracts from the previous week which had a total of -23,990 net contracts.
This week’s current strength score (the trader positioning range over the past three years, measured from 0 to 100) shows the speculators are currently Bearish with a score of 22.7 percent. The commercials are Bullish with a score of 79.6 percent and the small traders (not shown in chart) are Bearish-Extreme with a score of 16.5 percent.
| Copper Futures Statistics | SPECULATORS | COMMERCIALS | SMALL TRADERS |
| – Percent of Open Interest Longs: | 28.2 | 49.8 | 8.7 |
| – Percent of Open Interest Shorts: | 40.3 | 36.8 | 9.7 |
| – Net Position: | -18,986 | 20,512 | -1,526 |
| – Gross Longs: | 44,574 | 78,682 | 13,738 |
| – Gross Shorts: | 63,560 | 58,170 | 15,264 |
| – Long to Short Ratio: | 0.7 to 1 | 1.4 to 1 | 0.9 to 1 |
| NET POSITION TREND: | |||
| – Strength Index Score (3 Year Range Pct): | 22.7 | 79.6 | 16.5 |
| – Strength Index Reading (3 Year Range): | Bearish | Bullish | Bearish-Extreme |
| NET POSITION MOVEMENT INDEX: | |||
| – 6-Week Change in Strength Index: | 6.6 | -5.3 | -7.3 |
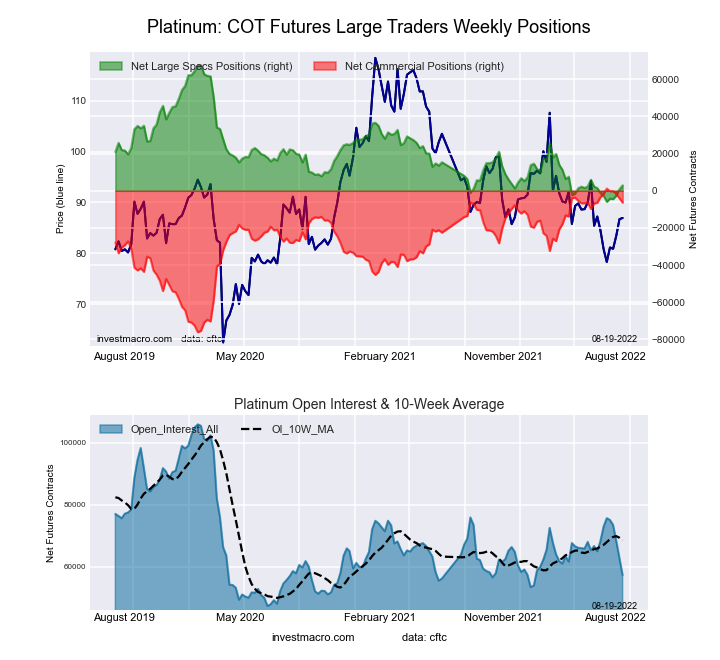
Platinum Futures:
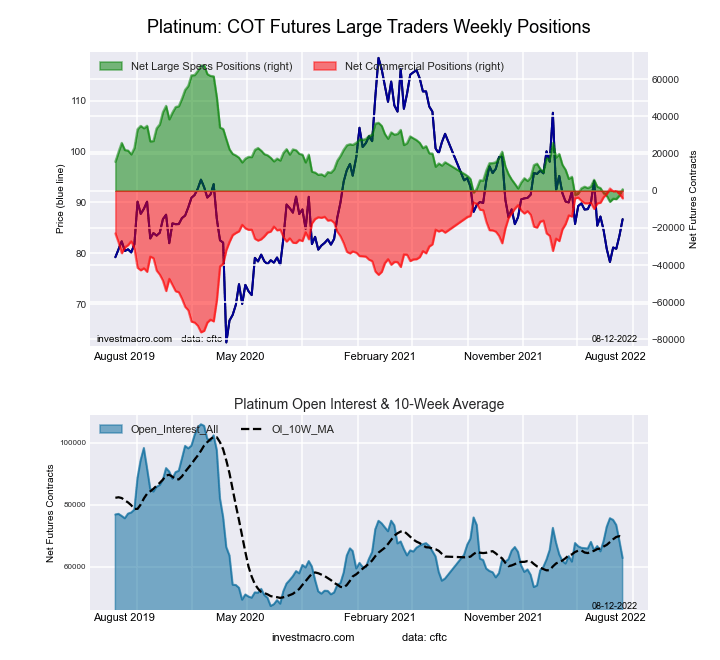
 The Platinum Futures large speculator standing this week totaled a net position of -1,879 contracts in the data reported through Tuesday. This was a weekly rise of 4,872 contracts from the previous week which had a total of -6,751 net contracts.
This week’s current strength score (the trader positioning range over the past three years, measured from 0 to 100) shows the speculators are currently Bearish-Extreme with a score of 6.6 percent. The commercials are Bullish-Extreme with a score of 93.4 percent and the small traders (not shown in chart) are Bearish-Extreme with a score of 16.8 percent.
| Platinum Futures Statistics | SPECULATORS | COMMERCIALS | SMALL TRADERS |
| – Percent of Open Interest Longs: | 44.6 | 38.6 | 11.0 |
| – Percent of Open Interest Shorts: | 47.3 | 41.6 | 5.3 |
| – Net Position: | -1,879 | -2,051 | 3,930 |
| – Gross Longs: | 30,552 | 26,473 | 7,567 |
| – Gross Shorts: | 32,431 | 28,524 | 3,637 |
| – Long to Short Ratio: | 0.9 to 1 | 0.9 to 1 | 2.1 to 1 |
| NET POSITION TREND: | |||
| – Strength Index Score (3 Year Range Pct): | 6.6 | 93.4 | 16.8 |
| – Strength Index Reading (3 Year Range): | Bearish-Extreme | Bullish-Extreme | Bearish-Extreme |
| NET POSITION MOVEMENT INDEX: | |||
| – 6-Week Change in Strength Index: | 0.9 | -0.4 | -4.5 |
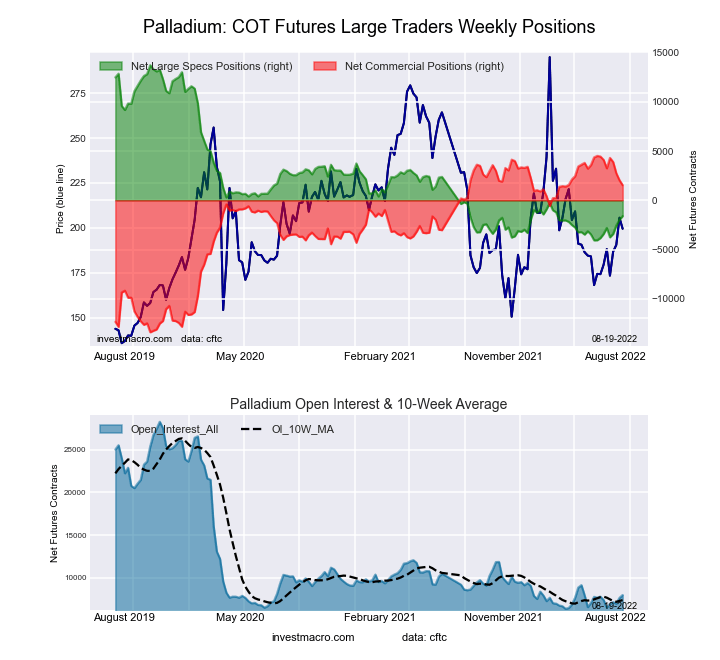
Palladium Futures:
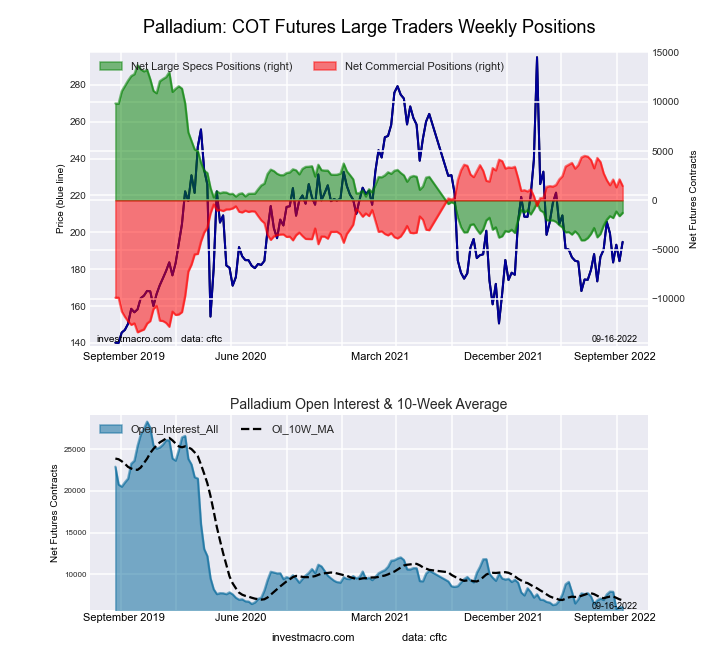 The Palladium Futures large speculator standing this week totaled a net position of -1,273 contracts in the data reported through Tuesday. This was a weekly advance of 329 contracts from the previous week which had a total of -1,602 net contracts.
This week’s current strength score (the trader positioning range over the past three years, measured from 0 to 100) shows the speculators are currently Bearish-Extreme with a score of 15.7 percent. The commercials are Bullish-Extreme with a score of 82.9 percent and the small traders (not shown in chart) are Bearish with a score of 33.3 percent.
| Palladium Futures Statistics | SPECULATORS | COMMERCIALS | SMALL TRADERS |
| – Percent of Open Interest Longs: | 22.7 | 61.1 | 15.0 |
| – Percent of Open Interest Shorts: | 43.6 | 37.2 | 17.9 |
| – Net Position: | -1,273 | 1,455 | -182 |
| – Gross Longs: | 1,382 | 3,720 | 910 |
| – Gross Shorts: | 2,655 | 2,265 | 1,092 |
| – Long to Short Ratio: | 0.5 to 1 | 1.6 to 1 | 0.8 to 1 |
| NET POSITION TREND: | |||
| – Strength Index Score (3 Year Range Pct): | 15.7 | 82.9 | 33.3 |
| – Strength Index Reading (3 Year Range): | Bearish-Extreme | Bullish-Extreme | Bearish |
| NET POSITION MOVEMENT INDEX: | |||
| – 6-Week Change in Strength Index: | 7.2 | -7.2 | 0.1 |
Article By InvestMacro – Receive our weekly COT Reports by Email
*COT Report: The COT data, released weekly to the public each Friday, is updated through the most recent Tuesday (data is 3 days old) and shows a quick view of how large speculators or non-commercials (for-profit traders) were positioned in the futures markets.
The CFTC categorizes trader positions according to commercial hedgers (traders who use futures contracts for hedging as part of the business), non-commercials (large traders who speculate to realize trading profits) and nonreportable traders (usually small traders/speculators) as well as their open interest (contracts open in the market at time of reporting). See CFTC criteria here.


