
By InvestMacro | COT | Data Tables | COT Leaders | Downloads | COT Newsletter
Here are the latest charts and statistics for the Commitment of Traders (COT) data published by the Commodities Futures Trading Commission (CFTC).
The latest COT data is updated through Tuesday June 14th and shows a quick view of how large traders (for-profit speculators and commercial entities) were positioned in the futures markets. All currency positions are in direct relation to the US dollar where, for example, a bet for the euro is a bet that the euro will rise versus the dollar while a bet against the euro will be a bet that the euro will decline versus the dollar.
There were many really large moves this week in the COT positioning as the data was recorded on Tuesday – just one day ahead of the Federal Reserve’s announcement of a 75 basis point increase in the US benchmark Fed Funds rate.
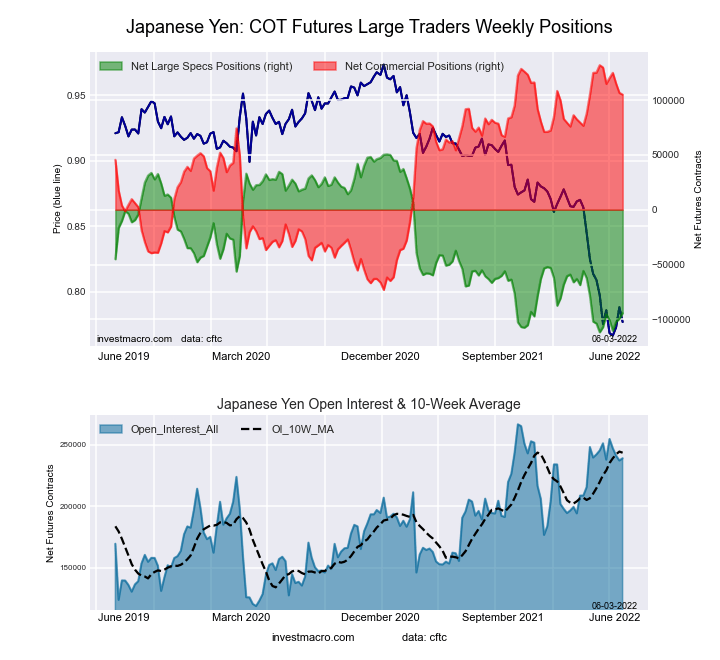
Currency market speculator bets were mostly higher this week as eight out of the eleven currency markets (Russian ruble futures positions have not been updated by the CFTC since March) we cover had higher positioning this week while two markets had lower contracts. Leading the gains for currency market positions was the Canadian dollar (24,264 contracts) and the Japanese yen (21,891 contracts) with the New Zealand dollar (12,933 contracts), Swiss franc (9,324 contracts), US Dollar Index (6,538 contracts), British pound sterling (5,214 contracts), Australian dollar (4,642 contracts), Bitcoin (571 contracts) and Brazil real (508 contracts) also showing positive weeks.
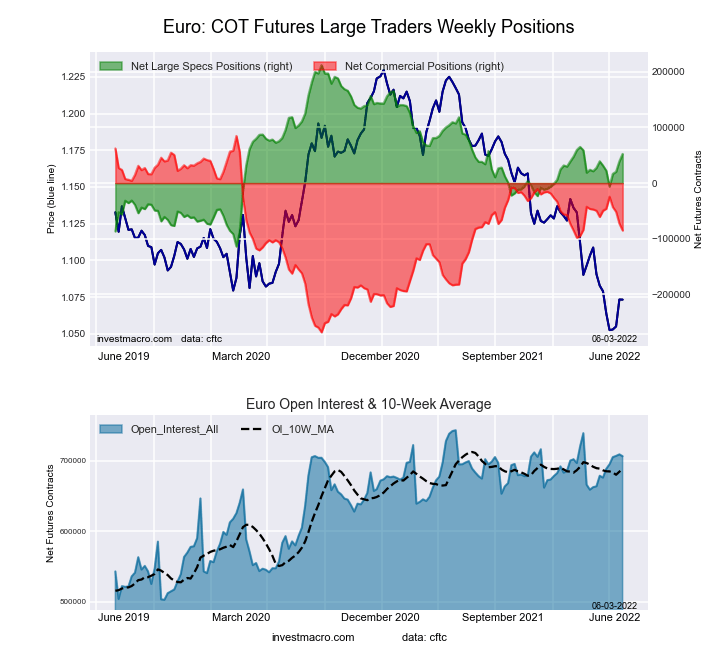
Meanwhile, leading the declines in speculator bets were the Mexican peso (-59,107 contracts) and the Euro (-56,561 contracts) this week.
Currency Speculators Notes:
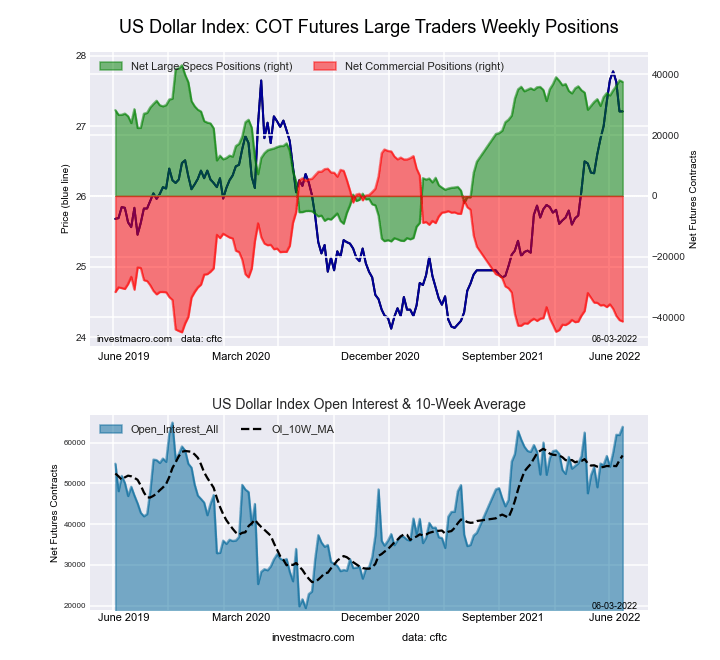
US Dollar Index speculators raised their bullish bets for a second straight week this week and for the seventh time in the past ten weeks. These increases pushed the large speculator standing (+44,476 contracts) to the highest level in the past two hundred and seventy-three weeks, dating back more than five years to March 21st of 2017. The most bullish level ever was +81,270 contracts on March 10th of 2015. The US dollar strength keeps rolling along and the overall standing has now remained bullish for the past fifty consecutive weeks, dating back to July of 2021. The US Dollar Index price has continued its strength as well and reached a high this week of over 105.75 which is the best level for the DXY since back in December of 2002.
Euro speculators sharply dropped their positions this week by the most on record with a huge decline of -56,561 contracts. This record decline beat out the previous high of -52,107 contracts that took place on June 19th of 2018. Euro bets had been gaining over the past month and were at a total of +50,543 contracts before this week’s sharp turnaround which has now tipped the overall spec positioning into bearish territory for the first time since January.
Japanese yen speculator bets surged this week (+21,891 contracts) and gained for the fifth straight week. Yen speculator positions have been in bearish territory for over a year and have been extremely week since many central banks around the world started raising their interest rates. The Bank of Japan has not raised rates and has signaled that it will not do so, creating large interest rate differentials compared to the other major currencies. Despite the spec bets increase this week, the yen exchange rate came under further pressure this week with the USDJPY price closing over the 135.00 exchange rate (and remaining near 20-year highs).
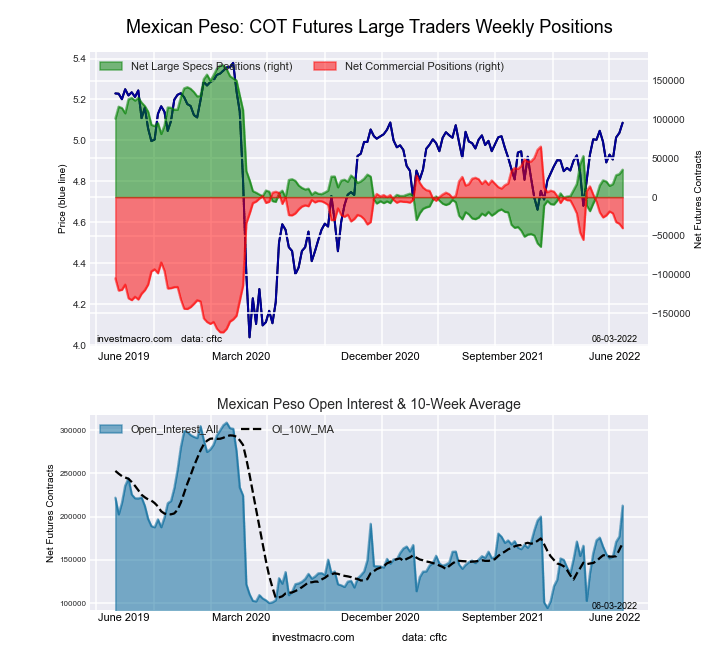
Mexican Peso speculator bets fell sharply by -59,381 contracts this week and flipped the MXN speculator positioning from bullish to bearish. The weekly speculator decline is the largest fall in the past thirteen weeks and the decrease into a bearish standing is the first time since March 29th.
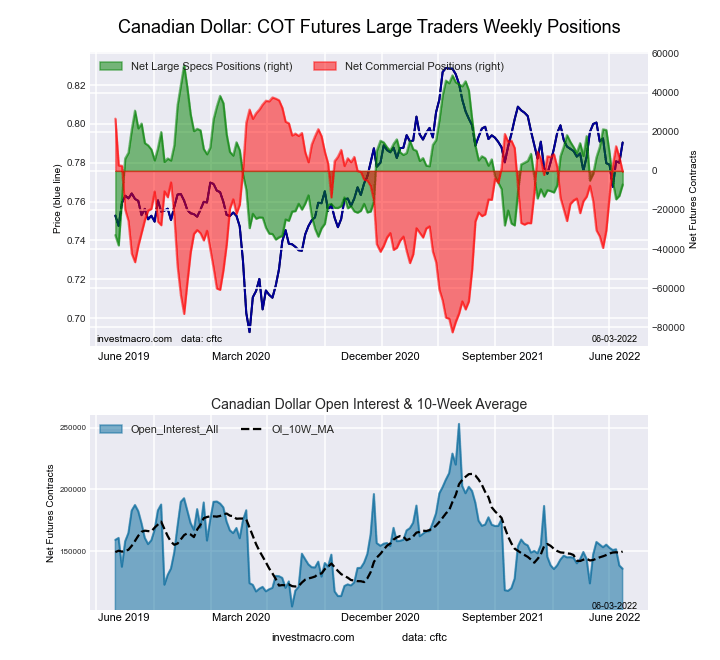
Canadian dollar bets jumped this week by the most in the past seventy-seven weeks and brought the speculator position back into bullish territory for the first time in six weeks. CAD speculator bets have now gained for four straight weeks and the overall spec standing is residing at the highest level since July 2021.
New Zealand dollar speculators also boosted their bets this week after the NZD positions had dropped in six out of the previous seven weeks. This week’s rise in weekly bets was the most in the past thirteen weeks but the overall speculator standing remains in bearish territory for the seventh straight week.
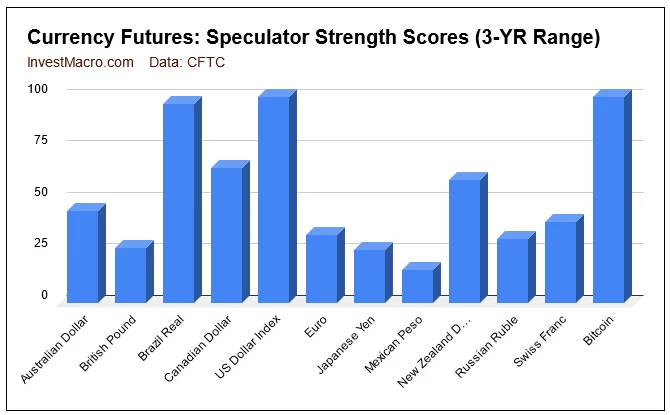
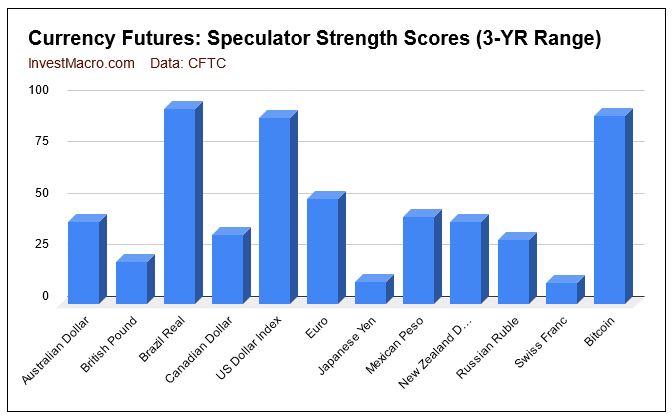
Strength scores (3-Year range of Speculator positions, from 0 to 100 where above 80 is extreme bullish and below 20 is extreme bearish) show that the US Dollar Index (100 percent), Bitcoin (100 percent) and the Brazilian Real (96.8 percent) are leading the strength scores and are all in extreme bullish positions. On the downside, the Mexican peso (16.1 percent) has fallen into extreme bearish positioning followed by the Japanese yen (25.9 percent) and British pound (26.7 percent) which are just above the 20 percent extreme bearish threshold.
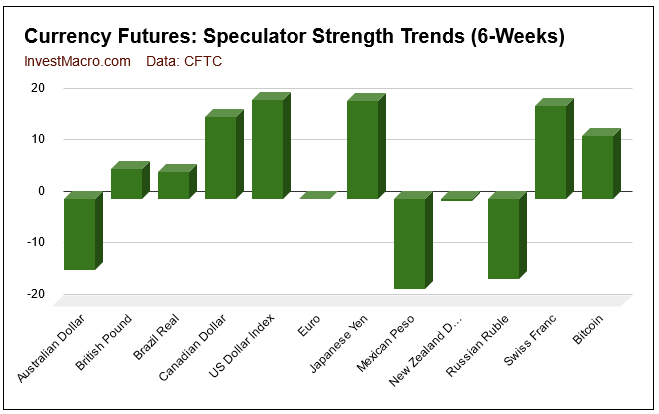
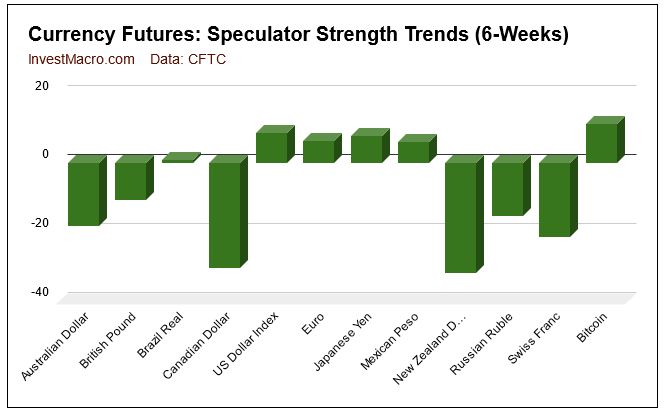
Strength score trends (or move index, that calculate 6-week changes in strength scores) shows that the US Dollar Index (19.5 percent), Japanese yen (19.1 percent) and Swiss franc (18 percent) have the highest six-week trend scores currently. The Mexican peso also leads the trends on the downside with a -17.5 percent trend change.
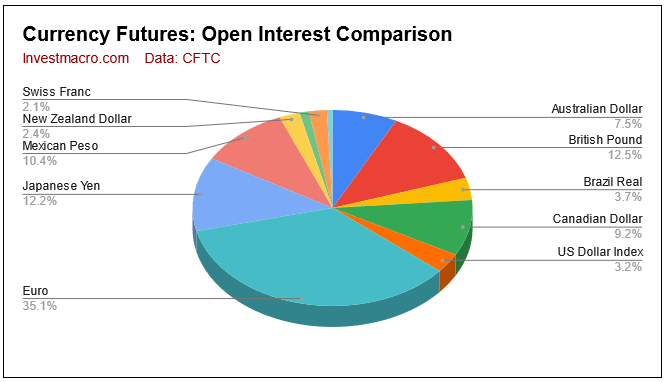
| Jun-14-2022 | OI | OI-Index | Spec-Net | Spec-Index | Com-Net | COM-Index | Smalls-Net | Smalls-Index |
|---|---|---|---|---|---|---|---|---|
| USD Index | 61,144 | 91 | 44,476 | 100 | -47,736 | 0 | 3,260 | 52 |
| EUR | 668,164 | 69 | -6,018 | 33 | -28,495 | 68 | 34,513 | 32 |
| GBP | 238,322 | 63 | -65,596 | 27 | 81,063 | 78 | -15,467 | 24 |
| JPY | 232,513 | 77 | -69,755 | 26 | 86,443 | 78 | -16,688 | 20 |
| CHF | 39,362 | 20 | -6,808 | 39 | 18,147 | 72 | -11,339 | 19 |
| CAD | 175,219 | 47 | 23,202 | 65 | -30,284 | 43 | 7,082 | 44 |
| AUD | 142,857 | 39 | -43,254 | 45 | 44,710 | 52 | -1,456 | 49 |
| NZD | 45,410 | 35 | -6,838 | 60 | 9,773 | 45 | -2,935 | 18 |
| MXN | 197,375 | 48 | -26,381 | 16 | 23,148 | 82 | 3,233 | 57 |
| RUB | 20,930 | 4 | 7,543 | 31 | -7,150 | 69 | -393 | 24 |
| BRL | 69,931 | 67 | 47,213 | 97 | -48,458 | 4 | 1,245 | 79 |
| Bitcoin | 12,242 | 68 | 1,061 | 100 | -947 | 0 | -114 | 10 |
US Dollar Index Futures:
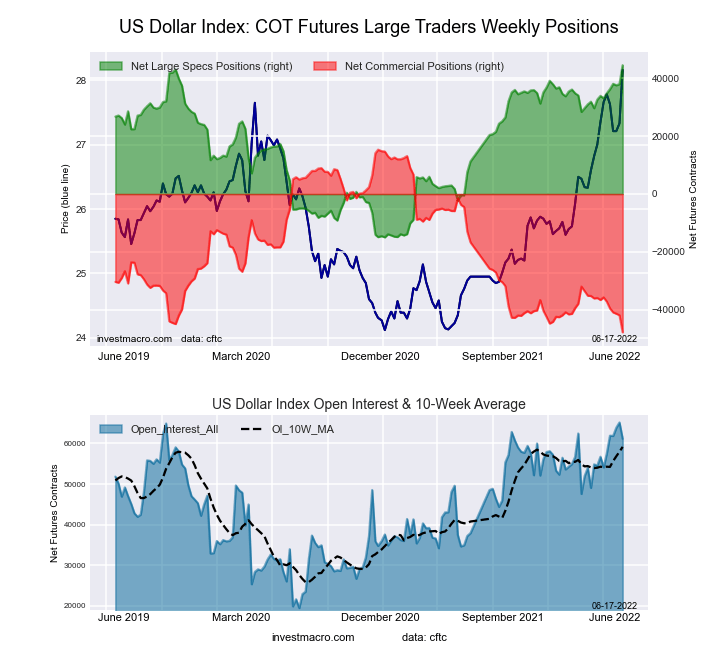 The US Dollar Index large speculator standing this week resulted in a net position of 44,476 contracts in the data reported through Tuesday. This was a weekly boost of 6,538 contracts from the previous week which had a total of 37,938 net contracts.
This week’s current strength score (the trader positioning range over the past three years, measured from 0 to 100) shows the speculators are currently Bullish-Extreme with a score of 100.0 percent. The commercials are Bearish-Extreme with a score of 0.0 percent and the small traders (not shown in chart) are Bullish with a score of 52.2 percent.
| US DOLLAR INDEX Statistics | SPECULATORS | COMMERCIALS | SMALL TRADERS |
| – Percent of Open Interest Longs: | 86.9 | 2.9 | 9.1 |
| – Percent of Open Interest Shorts: | 14.2 | 80.9 | 3.8 |
| – Net Position: | 44,476 | -47,736 | 3,260 |
| – Gross Longs: | 53,133 | 1,752 | 5,553 |
| – Gross Shorts: | 8,657 | 49,488 | 2,293 |
| – Long to Short Ratio: | 6.1 to 1 | 0.0 to 1 | 2.4 to 1 |
| NET POSITION TREND: | |||
| – Strength Index Score (3 Year Range Pct): | 100.0 | 0.0 | 52.2 |
| – Strength Index Reading (3 Year Range): | Bullish-Extreme | Bearish-Extreme | Bullish |
| NET POSITION MOVEMENT INDEX: | |||
| – 6-Week Change in Strength Index: | 19.2 | -19.1 | 7.1 |
Euro Currency Futures:
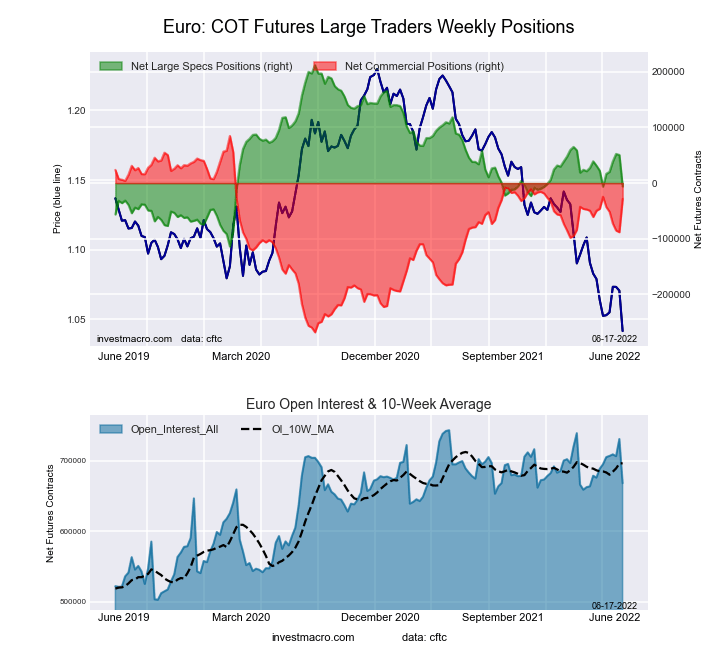 The Euro Currency large speculator standing this week resulted in a net position of -6,018 contracts in the data reported through Tuesday. This was a weekly fall of -56,561 contracts from the previous week which had a total of 50,543 net contracts.
This week’s current strength score (the trader positioning range over the past three years, measured from 0 to 100) shows the speculators are currently Bearish with a score of 33.2 percent. The commercials are Bullish with a score of 67.9 percent and the small traders (not shown in chart) are Bearish with a score of 31.6 percent.
| EURO Currency Statistics | SPECULATORS | COMMERCIALS | SMALL TRADERS |
| – Percent of Open Interest Longs: | 31.0 | 54.1 | 12.7 |
| – Percent of Open Interest Shorts: | 31.9 | 58.3 | 7.5 |
| – Net Position: | -6,018 | -28,495 | 34,513 |
| – Gross Longs: | 206,986 | 361,159 | 84,823 |
| – Gross Shorts: | 213,004 | 389,654 | 50,310 |
| – Long to Short Ratio: | 1.0 to 1 | 0.9 to 1 | 1.7 to 1 |
| NET POSITION TREND: | |||
| – Strength Index Score (3 Year Range Pct): | 33.2 | 67.9 | 31.6 |
| – Strength Index Reading (3 Year Range): | Bearish | Bullish | Bearish |
| NET POSITION MOVEMENT INDEX: | |||
| – 6-Week Change in Strength Index: | 0.1 | -1.1 | 5.9 |
British Pound Sterling Futures:
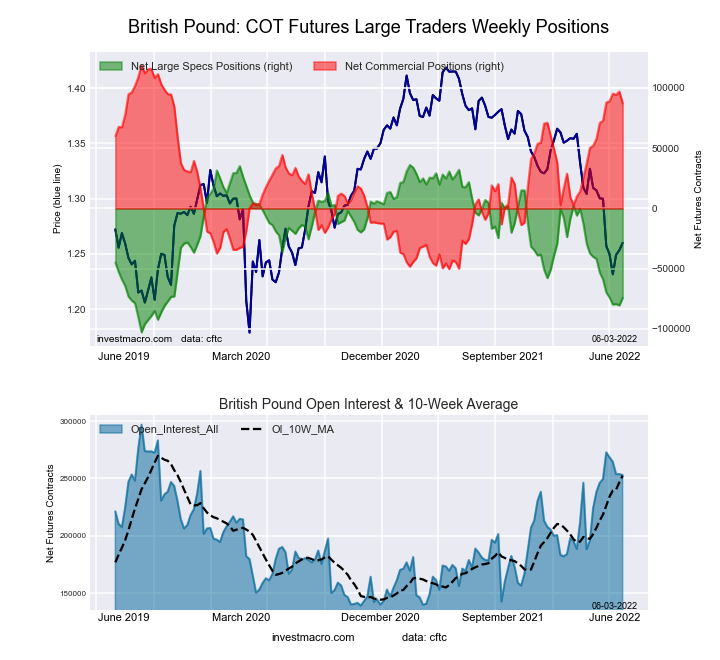
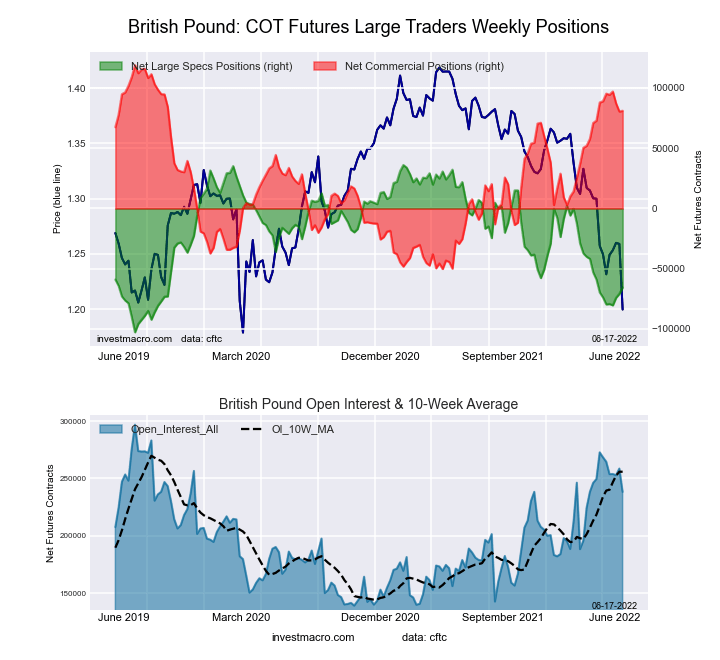 The British Pound Sterling large speculator standing this week resulted in a net position of -65,596 contracts in the data reported through Tuesday. This was a weekly lift of 5,214 contracts from the previous week which had a total of -70,810 net contracts.
This week’s current strength score (the trader positioning range over the past three years, measured from 0 to 100) shows the speculators are currently Bearish with a score of 26.7 percent. The commercials are Bullish with a score of 77.6 percent and the small traders (not shown in chart) are Bearish with a score of 23.6 percent.
| BRITISH POUND Statistics | SPECULATORS | COMMERCIALS | SMALL TRADERS |
| – Percent of Open Interest Longs: | 12.3 | 77.2 | 8.7 |
| – Percent of Open Interest Shorts: | 39.8 | 43.2 | 15.1 |
| – Net Position: | -65,596 | 81,063 | -15,467 |
| – Gross Longs: | 29,343 | 184,011 | 20,625 |
| – Gross Shorts: | 94,939 | 102,948 | 36,092 |
| – Long to Short Ratio: | 0.3 to 1 | 1.8 to 1 | 0.6 to 1 |
| NET POSITION TREND: | |||
| – Strength Index Score (3 Year Range Pct): | 26.7 | 77.6 | 23.6 |
| – Strength Index Reading (3 Year Range): | Bearish | Bullish | Bearish |
| NET POSITION MOVEMENT INDEX: | |||
| – 6-Week Change in Strength Index: | 5.9 | -4.7 | -0.5 |
Japanese Yen Futures:
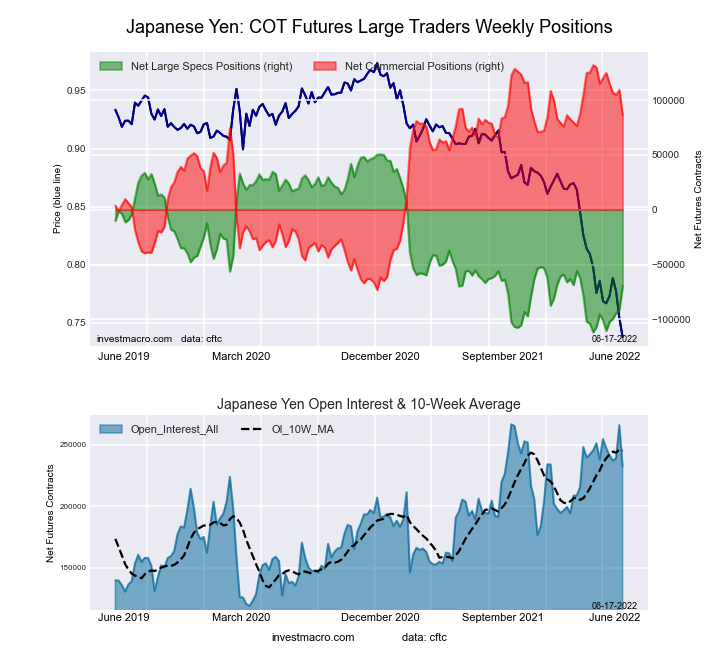 The Japanese Yen large speculator standing this week resulted in a net position of -69,755 contracts in the data reported through Tuesday. This was a weekly boost of 21,891 contracts from the previous week which had a total of -91,646 net contracts.
This week’s current strength score (the trader positioning range over the past three years, measured from 0 to 100) shows the speculators are currently Bearish with a score of 25.9 percent. The commercials are Bullish with a score of 77.8 percent and the small traders (not shown in chart) are Bearish-Extreme with a score of 19.5 percent.
| JAPANESE YEN Statistics | SPECULATORS | COMMERCIALS | SMALL TRADERS |
| – Percent of Open Interest Longs: | 14.0 | 75.6 | 9.6 |
| – Percent of Open Interest Shorts: | 44.0 | 38.4 | 16.8 |
| – Net Position: | -69,755 | 86,443 | -16,688 |
| – Gross Longs: | 32,441 | 175,789 | 22,340 |
| – Gross Shorts: | 102,196 | 89,346 | 39,028 |
| – Long to Short Ratio: | 0.3 to 1 | 2.0 to 1 | 0.6 to 1 |
| NET POSITION TREND: | |||
| – Strength Index Score (3 Year Range Pct): | 25.9 | 77.8 | 19.5 |
| – Strength Index Reading (3 Year Range): | Bearish | Bullish | Bearish-Extreme |
| NET POSITION MOVEMENT INDEX: | |||
| – 6-Week Change in Strength Index: | 19.1 | -16.5 | 5.7 |
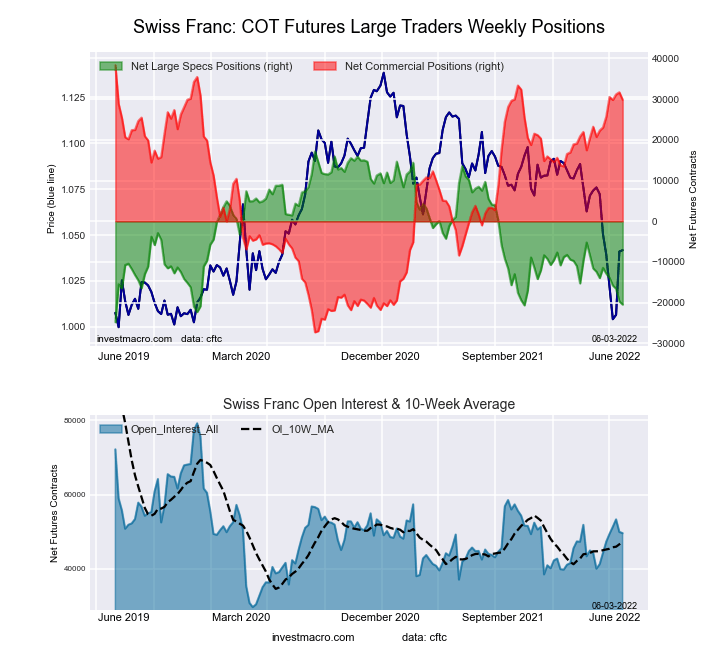
Swiss Franc Futures:
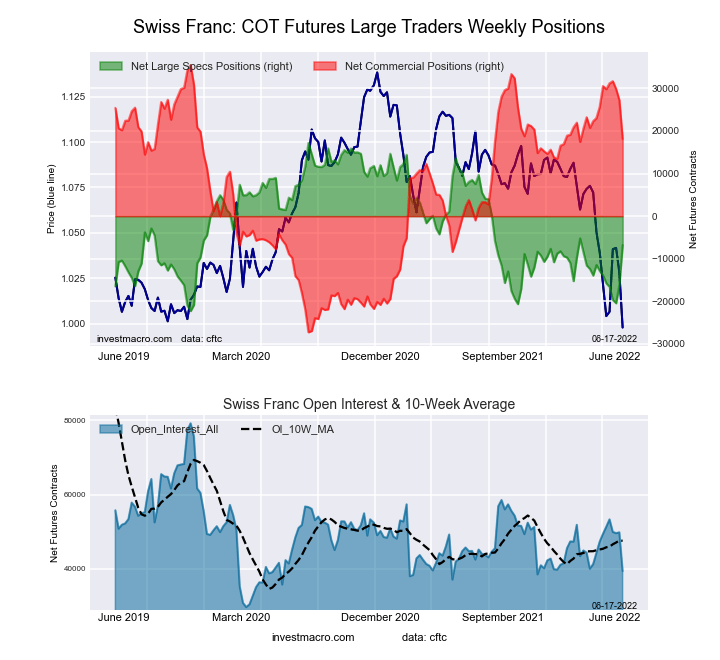 The Swiss Franc large speculator standing this week resulted in a net position of -6,808 contracts in the data reported through Tuesday. This was a weekly lift of 9,324 contracts from the previous week which had a total of -16,132 net contracts.
This week’s current strength score (the trader positioning range over the past three years, measured from 0 to 100) shows the speculators are currently Bearish with a score of 39.2 percent. The commercials are Bullish with a score of 72.4 percent and the small traders (not shown in chart) are Bearish-Extreme with a score of 19.1 percent.
| SWISS FRANC Statistics | SPECULATORS | COMMERCIALS | SMALL TRADERS |
| – Percent of Open Interest Longs: | 10.9 | 66.2 | 22.9 |
| – Percent of Open Interest Shorts: | 28.2 | 20.1 | 51.7 |
| – Net Position: | -6,808 | 18,147 | -11,339 |
| – Gross Longs: | 4,291 | 26,045 | 9,026 |
| – Gross Shorts: | 11,099 | 7,898 | 20,365 |
| – Long to Short Ratio: | 0.4 to 1 | 3.3 to 1 | 0.4 to 1 |
| NET POSITION TREND: | |||
| – Strength Index Score (3 Year Range Pct): | 39.2 | 72.4 | 19.1 |
| – Strength Index Reading (3 Year Range): | Bearish | Bullish | Bearish-Extreme |
| NET POSITION MOVEMENT INDEX: | |||
| – 6-Week Change in Strength Index: | 18.0 | -19.8 | 17.9 |
Canadian Dollar Futures:
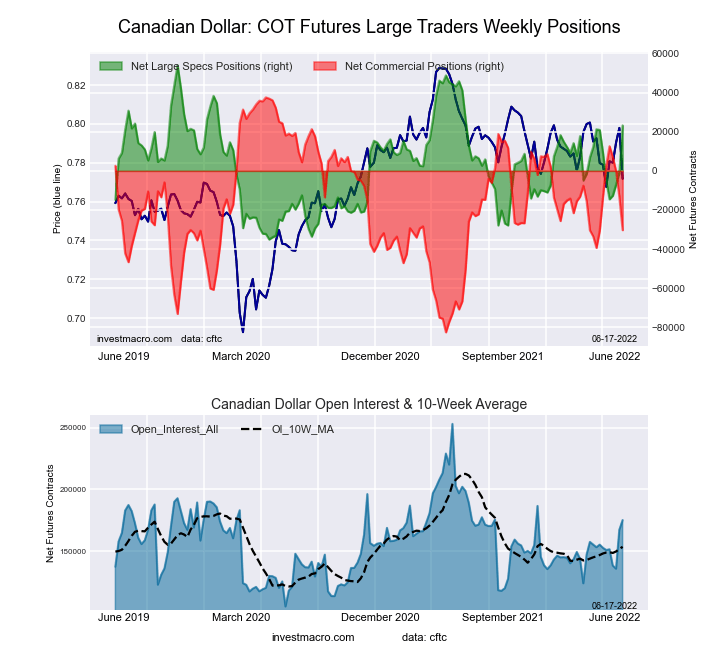 The Canadian Dollar large speculator standing this week resulted in a net position of 23,202 contracts in the data reported through Tuesday. This was a weekly boost of 24,264 contracts from the previous week which had a total of -1,062 net contracts.
This week’s current strength score (the trader positioning range over the past three years, measured from 0 to 100) shows the speculators are currently Bullish with a score of 65.4 percent. The commercials are Bearish with a score of 43.5 percent and the small traders (not shown in chart) are Bearish with a score of 44.3 percent.
| CANADIAN DOLLAR Statistics | SPECULATORS | COMMERCIALS | SMALL TRADERS |
| – Percent of Open Interest Longs: | 32.3 | 45.1 | 16.8 |
| – Percent of Open Interest Shorts: | 19.0 | 62.4 | 12.7 |
| – Net Position: | 23,202 | -30,284 | 7,082 |
| – Gross Longs: | 56,550 | 79,064 | 29,357 |
| – Gross Shorts: | 33,348 | 109,348 | 22,275 |
| – Long to Short Ratio: | 1.7 to 1 | 0.7 to 1 | 1.3 to 1 |
| NET POSITION TREND: | |||
| – Strength Index Score (3 Year Range Pct): | 65.4 | 43.5 | 44.3 |
| – Strength Index Reading (3 Year Range): | Bullish | Bearish | Bearish |
| NET POSITION MOVEMENT INDEX: | |||
| – 6-Week Change in Strength Index: | 15.9 | -14.4 | 6.3 |
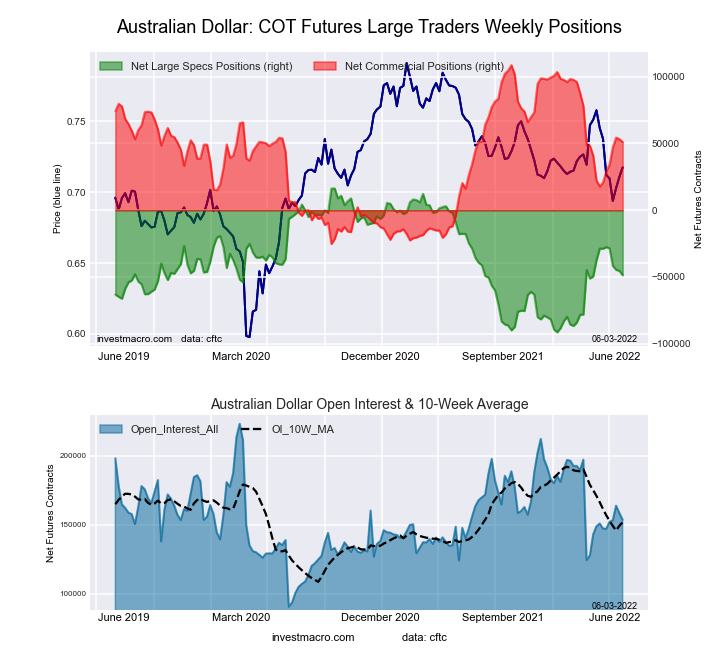
Australian Dollar Futures:
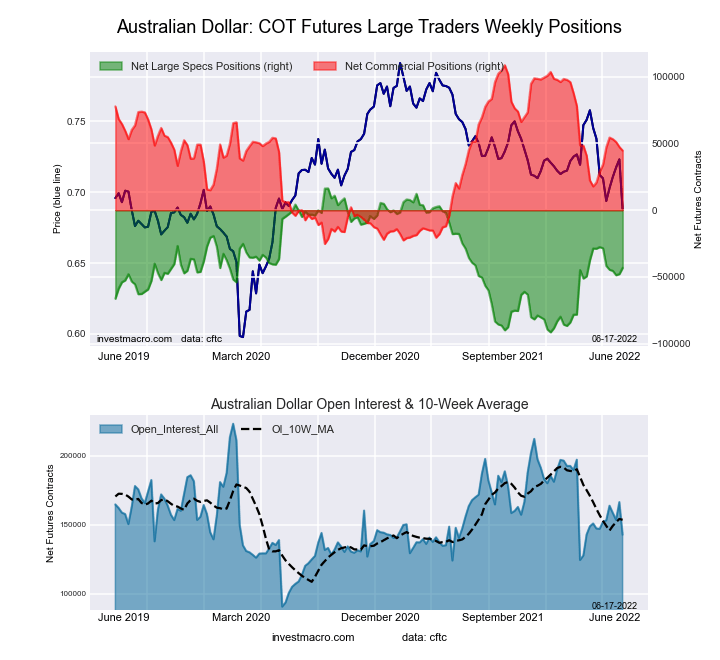 The Australian Dollar large speculator standing this week resulted in a net position of -43,254 contracts in the data reported through Tuesday. This was a weekly lift of 4,642 contracts from the previous week which had a total of -47,896 net contracts.
This week’s current strength score (the trader positioning range over the past three years, measured from 0 to 100) shows the speculators are currently Bearish with a score of 44.7 percent. The commercials are Bullish with a score of 52.2 percent and the small traders (not shown in chart) are Bearish with a score of 48.9 percent.
| AUSTRALIAN DOLLAR Statistics | SPECULATORS | COMMERCIALS | SMALL TRADERS |
| – Percent of Open Interest Longs: | 22.2 | 59.9 | 14.9 |
| – Percent of Open Interest Shorts: | 52.4 | 28.6 | 16.0 |
| – Net Position: | -43,254 | 44,710 | -1,456 |
| – Gross Longs: | 31,660 | 85,591 | 21,342 |
| – Gross Shorts: | 74,914 | 40,881 | 22,798 |
| – Long to Short Ratio: | 0.4 to 1 | 2.1 to 1 | 0.9 to 1 |
| NET POSITION TREND: | |||
| – Strength Index Score (3 Year Range Pct): | 44.7 | 52.2 | 48.9 |
| – Strength Index Reading (3 Year Range): | Bearish | Bullish | Bearish |
| NET POSITION MOVEMENT INDEX: | |||
| – 6-Week Change in Strength Index: | -13.7 | 7.8 | 10.4 |
New Zealand Dollar Futures:
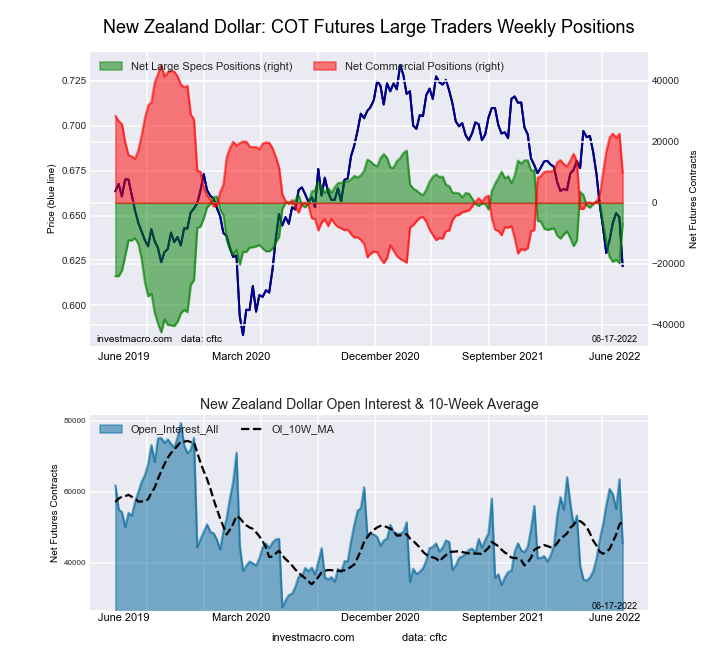 The New Zealand Dollar large speculator standing this week resulted in a net position of -6,838 contracts in the data reported through Tuesday. This was a weekly increase of 12,933 contracts from the previous week which had a total of -19,771 net contracts.
This week’s current strength score (the trader positioning range over the past three years, measured from 0 to 100) shows the speculators are currently Bullish with a score of 59.8 percent. The commercials are Bearish with a score of 45.5 percent and the small traders (not shown in chart) are Bearish-Extreme with a score of 18.2 percent.
| NEW ZEALAND DOLLAR Statistics | SPECULATORS | COMMERCIALS | SMALL TRADERS |
| – Percent of Open Interest Longs: | 32.8 | 61.8 | 4.9 |
| – Percent of Open Interest Shorts: | 47.9 | 40.3 | 11.4 |
| – Net Position: | -6,838 | 9,773 | -2,935 |
| – Gross Longs: | 14,894 | 28,062 | 2,236 |
| – Gross Shorts: | 21,732 | 18,289 | 5,171 |
| – Long to Short Ratio: | 0.7 to 1 | 1.5 to 1 | 0.4 to 1 |
| NET POSITION TREND: | |||
| – Strength Index Score (3 Year Range Pct): | 59.8 | 45.5 | 18.2 |
| – Strength Index Reading (3 Year Range): | Bullish | Bearish | Bearish-Extreme |
| NET POSITION MOVEMENT INDEX: | |||
| – 6-Week Change in Strength Index: | -0.4 | -0.2 | 3.8 |
Mexican Peso Futures:
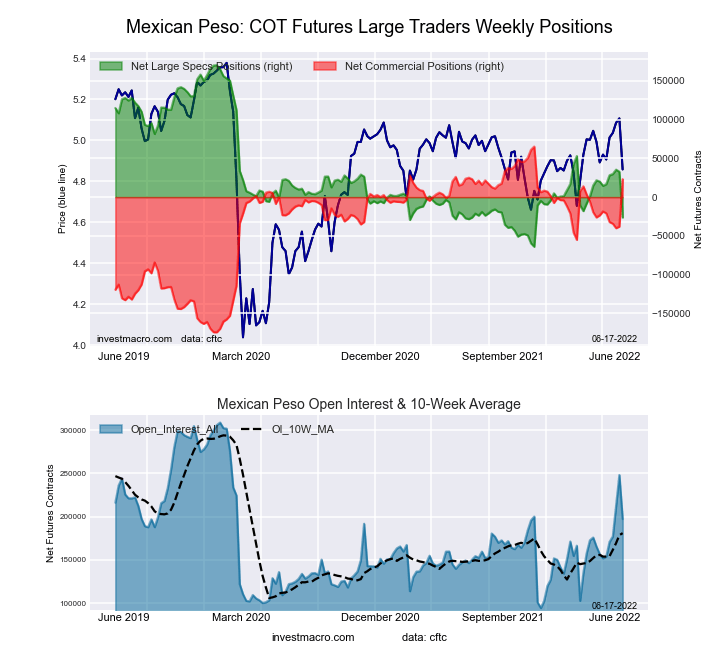 The Mexican Peso large speculator standing this week resulted in a net position of -26,381 contracts in the data reported through Tuesday. This was a weekly reduction of -59,107 contracts from the previous week which had a total of 32,726 net contracts.
This week’s current strength score (the trader positioning range over the past three years, measured from 0 to 100) shows the speculators are currently Bearish-Extreme with a score of 16.1 percent. The commercials are Bullish-Extreme with a score of 82.5 percent and the small traders (not shown in chart) are Bullish with a score of 56.7 percent.
| MEXICAN PESO Statistics | SPECULATORS | COMMERCIALS | SMALL TRADERS |
| – Percent of Open Interest Longs: | 57.8 | 38.3 | 3.1 |
| – Percent of Open Interest Shorts: | 71.2 | 26.5 | 1.5 |
| – Net Position: | -26,381 | 23,148 | 3,233 |
| – Gross Longs: | 114,093 | 75,532 | 6,170 |
| – Gross Shorts: | 140,474 | 52,384 | 2,937 |
| – Long to Short Ratio: | 0.8 to 1 | 1.4 to 1 | 2.1 to 1 |
| NET POSITION TREND: | |||
| – Strength Index Score (3 Year Range Pct): | 16.1 | 82.5 | 56.7 |
| – Strength Index Reading (3 Year Range): | Bearish-Extreme | Bullish-Extreme | Bullish |
| NET POSITION MOVEMENT INDEX: | |||
| – 6-Week Change in Strength Index: | -17.5 | 17.4 | -2.9 |
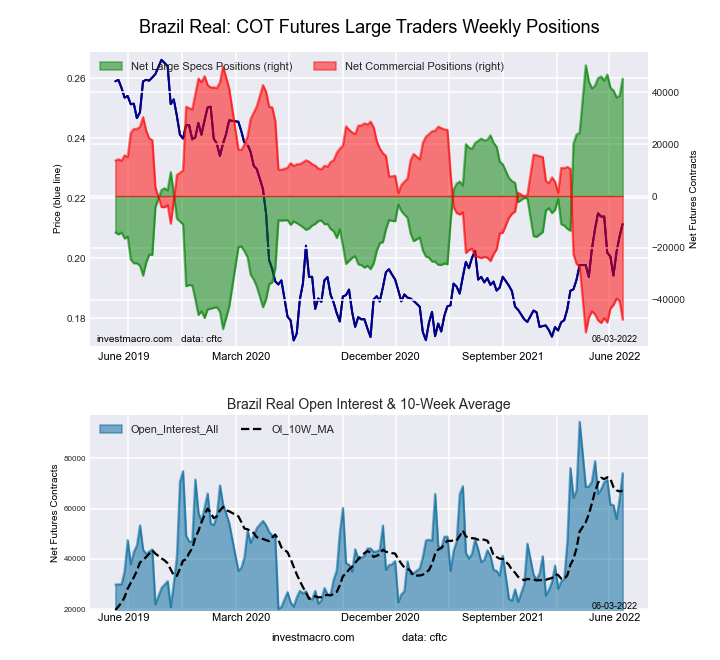
Brazilian Real Futures:
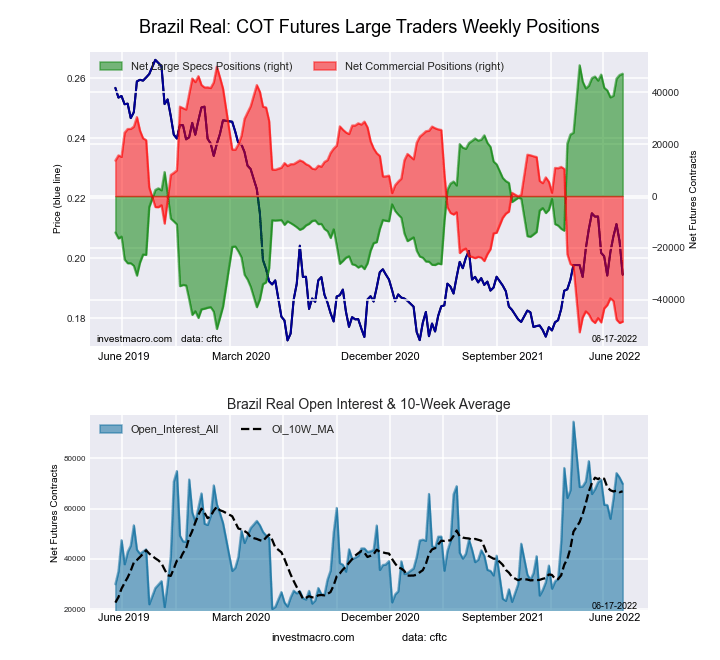 The Brazilian Real large speculator standing this week resulted in a net position of 47,213 contracts in the data reported through Tuesday. This was a weekly rise of 508 contracts from the previous week which had a total of 46,705 net contracts.
This week’s current strength score (the trader positioning range over the past three years, measured from 0 to 100) shows the speculators are currently Bullish-Extreme with a score of 96.8 percent. The commercials are Bearish-Extreme with a score of 4.0 percent and the small traders (not shown in chart) are Bullish with a score of 79.4 percent.
| BRAZIL REAL Statistics | SPECULATORS | COMMERCIALS | SMALL TRADERS |
| – Percent of Open Interest Longs: | 83.0 | 12.5 | 4.6 |
| – Percent of Open Interest Shorts: | 15.5 | 81.8 | 2.8 |
| – Net Position: | 47,213 | -48,458 | 1,245 |
| – Gross Longs: | 58,023 | 8,711 | 3,197 |
| – Gross Shorts: | 10,810 | 57,169 | 1,952 |
| – Long to Short Ratio: | 5.4 to 1 | 0.2 to 1 | 1.6 to 1 |
| NET POSITION TREND: | |||
| – Strength Index Score (3 Year Range Pct): | 96.8 | 4.0 | 79.4 |
| – Strength Index Reading (3 Year Range): | Bullish-Extreme | Bearish-Extreme | Bullish |
| NET POSITION MOVEMENT INDEX: | |||
| – 6-Week Change in Strength Index: | 5.3 | -5.0 | -4.0 |
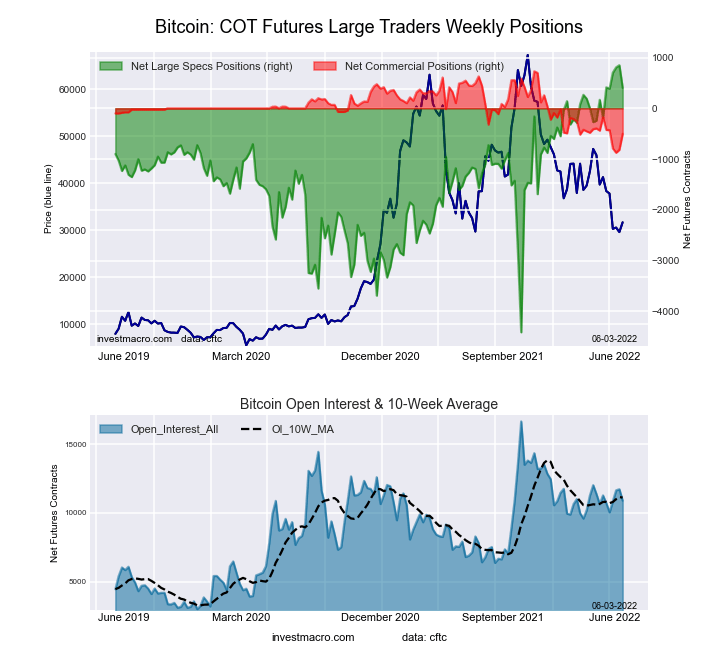
Bitcoin Futures:
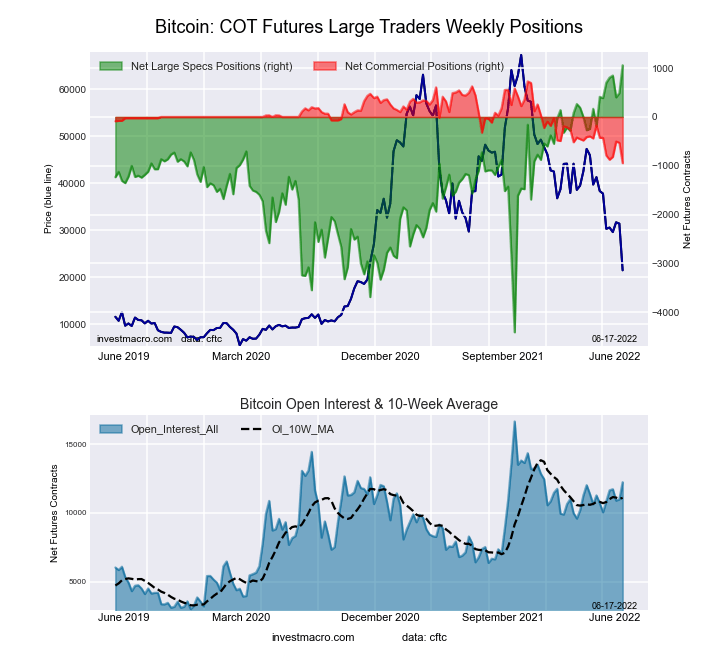 The Bitcoin large speculator standing this week resulted in a net position of 1,061 contracts in the data reported through Tuesday. This was a weekly increase of 571 contracts from the previous week which had a total of 490 net contracts.
This week’s current strength score (the trader positioning range over the past three years, measured from 0 to 100) shows the speculators are currently Bullish-Extreme with a score of 100.0 percent. The commercials are Bearish-Extreme with a score of 0.0 percent and the small traders (not shown in chart) are Bearish-Extreme with a score of 10.3 percent.
| BITCOIN Statistics | SPECULATORS | COMMERCIALS | SMALL TRADERS |
| – Percent of Open Interest Longs: | 81.7 | 0.5 | 8.2 |
| – Percent of Open Interest Shorts: | 73.0 | 8.2 | 9.2 |
| – Net Position: | 1,061 | -947 | -114 |
| – Gross Longs: | 9,996 | 62 | 1,008 |
| – Gross Shorts: | 8,935 | 1,009 | 1,122 |
| – Long to Short Ratio: | 1.1 to 1 | 0.1 to 1 | 0.9 to 1 |
| NET POSITION TREND: | |||
| – Strength Index Score (3 Year Range Pct): | 100.0 | 0.0 | 10.3 |
| – Strength Index Reading (3 Year Range): | Bullish-Extreme | Bearish-Extreme | Bearish-Extreme |
| NET POSITION MOVEMENT INDEX: | |||
| – 6-Week Change in Strength Index: | 12.3 | -30.9 | -3.5 |
Article By InvestMacro – Receive our weekly COT Reports by Email
*COT Report: The COT data, released weekly to the public each Friday, is updated through the most recent Tuesday (data is 3 days old) and shows a quick view of how large speculators or non-commercials (for-profit traders) were positioned in the futures markets.
The CFTC categorizes trader positions according to commercial hedgers (traders who use futures contracts for hedging as part of the business), non-commercials (large traders who speculate to realize trading profits) and nonreportable traders (usually small traders/speculators) as well as their open interest (contracts open in the market at time of reporting).See CFTC criteria here.


