
By InvestMacro | COT | Data Tables | COT Leaders | Downloads | COT Newsletter
Here are the latest charts and statistics for the Commitment of Traders (COT) data published by the Commodities Futures Trading Commission (CFTC).
The latest COT data is updated through Tuesday June 14th and shows a quick view of how large traders (for-profit speculators and commercial entities) were positioned in the futures markets.
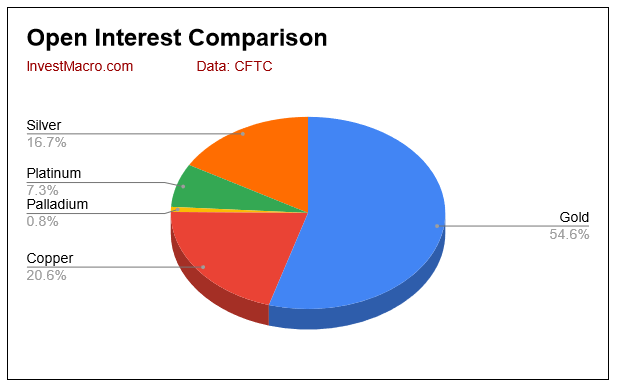
COT Metals market speculator bets were lower this week as all five of the metals markets we cover had lower positioning this week. Leading the declines in speculator bets this week were Gold (-20,670 contracts) and Copper (-10,083 contracts) with Platinum (-3,719 contracts), Silver (-3,399 contracts) and Palladium (-596 contracts) also registering lower bets on the week.
Highlighting this week’s COT metals data was the further weakness in bullish bets for the Gold futures contracts. Gold speculators sharply dropped their bullish bets by -20,670 contracts this week and have now seen lower positions for two out of three weeks as well as for the seventh time in the past nine weeks. Over the nine-week time-frame, Gold speculator bets have fallen by a total of -99,689 contracts, going from +254,297 net positions on April 12th to +154,598 net positions this week. These decreases have brought the current level down to the least bullish standing of the past one hundred and fifty-nine weeks, dating back to May 28th of 2019.
Free Reports:
 Download Our Metatrader 4 Indicators – Put Our Free MetaTrader 4 Custom Indicators on your charts when you join our Weekly Newsletter
 Get our Weekly Commitment of Traders Reports - See where the biggest traders (Hedge Funds and Commercial Hedgers) are positioned in the futures markets on a weekly basis.
Despite the speculator weakness, the Gold futures price has not fallen too sharply although prices have cooled off since hitting an almost two-year high of $2,078 on March 8th. The Gold price currently remains trading in its range between approximately $1,800 and $1,884 that has prevailed since early in May and over the longer-term, remains in an uptrend.

Strength scores (3-Year range of Speculator positions, from 0 to 100 where above 80 is extreme bullish and below 20 is extreme bearish) show that Copper (32.4 percent) is the leading pack this week although this score is just slightly above a extreme bearish score. All the other markets are currently in extreme bearish levels (below 20 percent) as speculator sentiment among the metals is very weak at the moment.
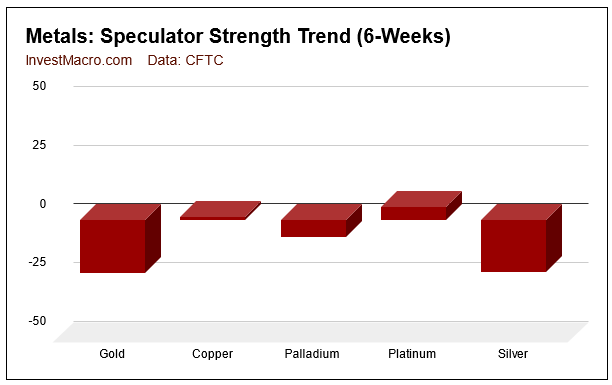
Strength score trends (or move index, that calculate 6-week changes in strength scores) show that the Platinum (5.4 percent) and Copper (1.3 percent) are the only two metals with rising trend scores. Gold and Silver are neck and neck for leading the trends to the downside with scores of -22.4 percent (Gold) and -22 percent (Silver), respectively, while Platinum (-7.3 percent) also has a negative trend score for the week.
| Jun-14-2022 | OI | OI-Index | Spec-Net | Spec-Index | Com-Net | COM-Index | Smalls-Net | Smalls-Index |
|---|---|---|---|---|---|---|---|---|
| WTI Crude | 1,715,674 | 0 | 302,946 | 0 | -341,654 | 100 | 38,708 | 70 |
| Gold | 497,456 | 13 | 154,598 | 0 | -178,569 | 100 | 23,971 | 15 |
| Silver | 151,978 | 18 | 14,005 | 0 | -22,047 | 100 | 8,042 | 0 |
| Copper | 187,247 | 17 | -13,797 | 32 | 10,287 | 67 | 3,510 | 46 |
| Palladium | 7,740 | 6 | -4,057 | 0 | 4,354 | 100 | -297 | 27 |
| Platinum | 66,613 | 33 | 2,214 | 7 | -6,793 | 96 | 4,579 | 26 |
| Natural Gas | 1,053,265 | 0 | -123,485 | 42 | 74,310 | 54 | 49,175 | 96 |
| Brent | 171,026 | 17 | -36,389 | 50 | 34,601 | 51 | 1,788 | 33 |
| Heating Oil | 268,199 | 23 | 8,475 | 55 | -28,686 | 41 | 20,211 | 68 |
| Soybeans | 754,428 | 34 | 182,667 | 70 | -155,663 | 37 | -27,004 | 25 |
| Corn | 1,521,565 | 25 | 399,775 | 81 | -344,196 | 23 | -55,579 | 11 |
| Coffee | 202,656 | 0 | 46,885 | 79 | -48,399 | 25 | 1,514 | 5 |
| Sugar | 800,806 | 1 | 170,483 | 72 | -198,006 | 31 | 27,523 | 42 |
| Wheat | 336,890 | 13 | 20,435 | 46 | -18,089 | 34 | -2,346 | 98 |
Gold Comex Futures:
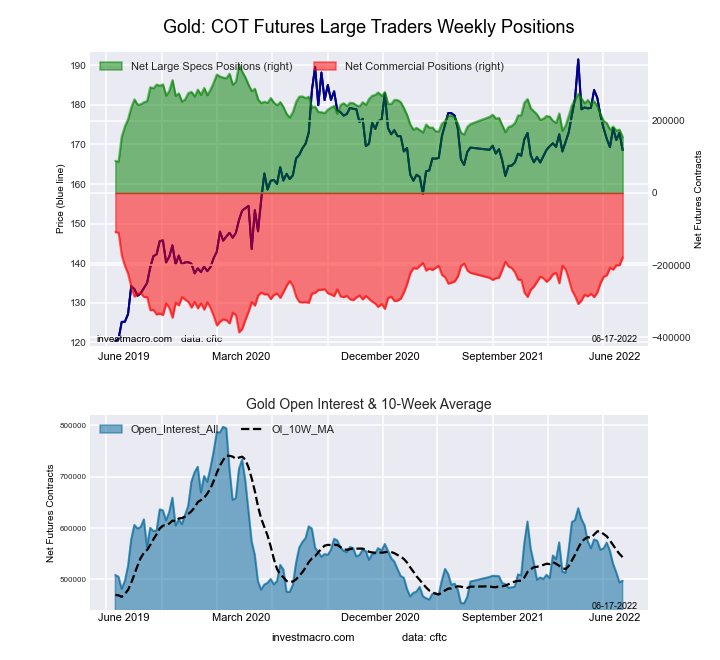 The Gold Comex Futures large speculator standing this week equaled a net position of 154,598 contracts in the data reported through Tuesday. This was a weekly fall of -20,670 contracts from the previous week which had a total of 175,268 net contracts.
This week’s current strength score (the trader positioning range over the past three years, measured from 0 to 100) shows the speculators are currently Bearish-Extreme with a score of 0.0 percent. The commercials are Bullish-Extreme with a score of 100.0 percent and the small traders (not shown in chart) are Bearish-Extreme with a score of 14.9 percent.
| Gold Futures Statistics | SPECULATORS | COMMERCIALS | SMALL TRADERS |
| – Percent of Open Interest Longs: | 53.6 | 24.5 | 9.2 |
| – Percent of Open Interest Shorts: | 22.5 | 60.4 | 4.4 |
| – Net Position: | 154,598 | -178,569 | 23,971 |
| – Gross Longs: | 266,596 | 121,926 | 45,726 |
| – Gross Shorts: | 111,998 | 300,495 | 21,755 |
| – Long to Short Ratio: | 2.4 to 1 | 0.4 to 1 | 2.1 to 1 |
| NET POSITION TREND: | |||
| – Strength Index Score (3 Year Range Pct): | 0.0 | 100.0 | 14.9 |
| – Strength Index Reading (3 Year Range): | Bearish-Extreme | Bullish-Extreme | Bearish-Extreme |
| NET POSITION MOVEMENT INDEX: | |||
| – 6-Week Change in Strength Index: | -22.4 | 25.7 | -31.1 |
Silver Comex Futures:
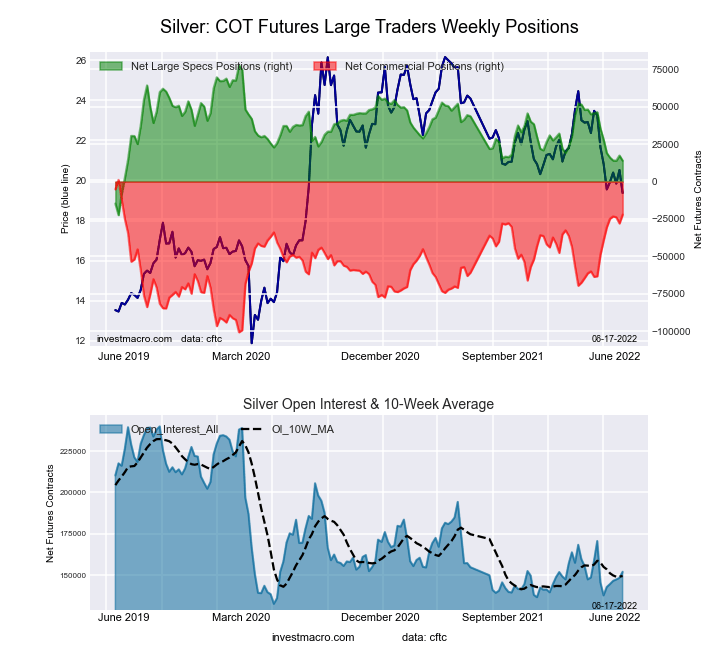 The Silver Comex Futures large speculator standing this week equaled a net position of 14,005 contracts in the data reported through Tuesday. This was a weekly fall of -3,399 contracts from the previous week which had a total of 17,404 net contracts.
This week’s current strength score (the trader positioning range over the past three years, measured from 0 to 100) shows the speculators are currently Bearish-Extreme with a score of 0.0 percent. The commercials are Bullish-Extreme with a score of 100.0 percent and the small traders (not shown in chart) are Bearish-Extreme with a score of 0.0 percent.
| Silver Futures Statistics | SPECULATORS | COMMERCIALS | SMALL TRADERS |
| – Percent of Open Interest Longs: | 37.6 | 39.6 | 16.0 |
| – Percent of Open Interest Shorts: | 28.4 | 54.1 | 10.7 |
| – Net Position: | 14,005 | -22,047 | 8,042 |
| – Gross Longs: | 57,216 | 60,161 | 24,268 |
| – Gross Shorts: | 43,211 | 82,208 | 16,226 |
| – Long to Short Ratio: | 1.3 to 1 | 0.7 to 1 | 1.5 to 1 |
| NET POSITION TREND: | |||
| – Strength Index Score (3 Year Range Pct): | 0.0 | 100.0 | 0.0 |
| – Strength Index Reading (3 Year Range): | Bearish-Extreme | Bullish-Extreme | Bearish-Extreme |
| NET POSITION MOVEMENT INDEX: | |||
| – 6-Week Change in Strength Index: | -22.0 | 21.9 | -16.9 |
Copper Grade #1 Futures:
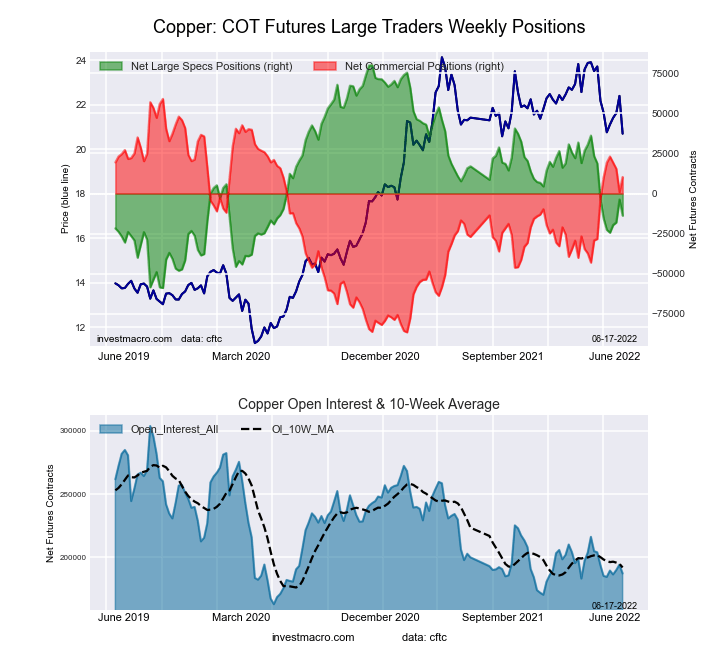 The Copper Grade #1 Futures large speculator standing this week equaled a net position of -13,797 contracts in the data reported through Tuesday. This was a weekly decline of -10,083 contracts from the previous week which had a total of -3,714 net contracts.
This week’s current strength score (the trader positioning range over the past three years, measured from 0 to 100) shows the speculators are currently Bearish with a score of 32.4 percent. The commercials are Bullish with a score of 66.5 percent and the small traders (not shown in chart) are Bearish with a score of 45.6 percent.
| Copper Futures Statistics | SPECULATORS | COMMERCIALS | SMALL TRADERS |
| – Percent of Open Interest Longs: | 27.3 | 55.2 | 8.8 |
| – Percent of Open Interest Shorts: | 34.6 | 49.7 | 6.9 |
| – Net Position: | -13,797 | 10,287 | 3,510 |
| – Gross Longs: | 51,077 | 103,433 | 16,449 |
| – Gross Shorts: | 64,874 | 93,146 | 12,939 |
| – Long to Short Ratio: | 0.8 to 1 | 1.1 to 1 | 1.3 to 1 |
| NET POSITION TREND: | |||
| – Strength Index Score (3 Year Range Pct): | 32.4 | 66.5 | 45.6 |
| – Strength Index Reading (3 Year Range): | Bearish | Bullish | Bearish |
| NET POSITION MOVEMENT INDEX: | |||
| – 6-Week Change in Strength Index: | 1.3 | 0.1 | -11.8 |
Platinum Futures:
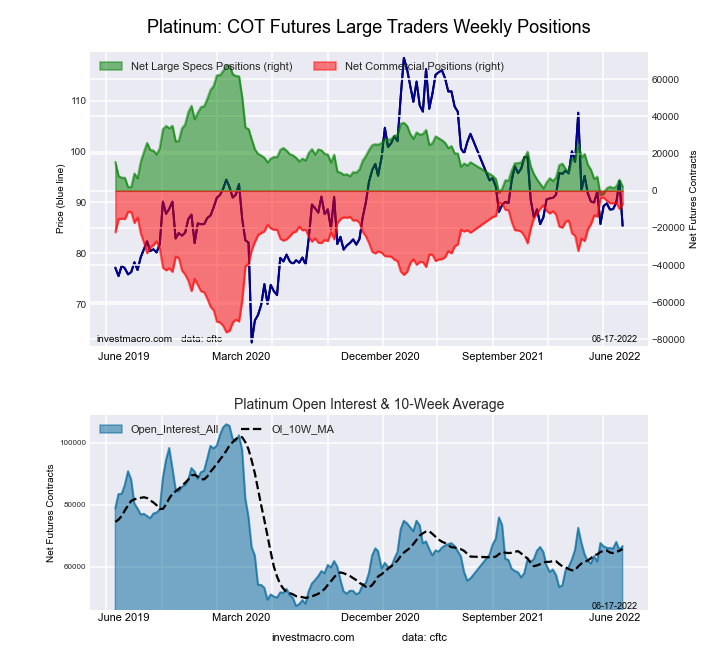 The Platinum Futures large speculator standing this week equaled a net position of 2,214 contracts in the data reported through Tuesday. This was a weekly decrease of -3,719 contracts from the previous week which had a total of 5,933 net contracts.
This week’s current strength score (the trader positioning range over the past three years, measured from 0 to 100) shows the speculators are currently Bearish-Extreme with a score of 6.5 percent. The commercials are Bullish-Extreme with a score of 95.7 percent and the small traders (not shown in chart) are Bearish with a score of 25.8 percent.
| Platinum Futures Statistics | SPECULATORS | COMMERCIALS | SMALL TRADERS |
| – Percent of Open Interest Longs: | 37.7 | 42.3 | 12.9 |
| – Percent of Open Interest Shorts: | 34.3 | 52.5 | 6.0 |
| – Net Position: | 2,214 | -6,793 | 4,579 |
| – Gross Longs: | 25,085 | 28,194 | 8,597 |
| – Gross Shorts: | 22,871 | 34,987 | 4,018 |
| – Long to Short Ratio: | 1.1 to 1 | 0.8 to 1 | 2.1 to 1 |
| NET POSITION TREND: | |||
| – Strength Index Score (3 Year Range Pct): | 6.5 | 95.7 | 25.8 |
| – Strength Index Reading (3 Year Range): | Bearish-Extreme | Bullish-Extreme | Bearish |
| NET POSITION MOVEMENT INDEX: | |||
| – 6-Week Change in Strength Index: | 5.4 | -4.3 | -8.8 |
Palladium Futures:
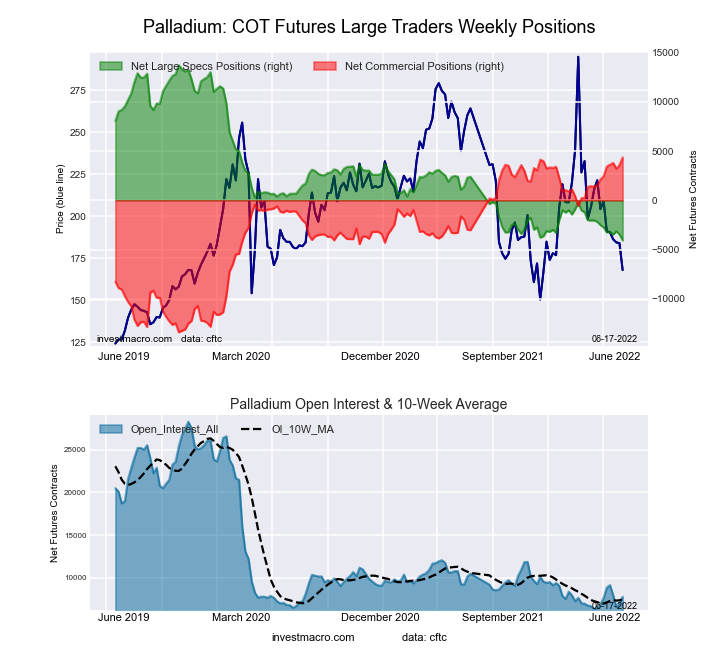 The Palladium Futures large speculator standing this week equaled a net position of -4,057 contracts in the data reported through Tuesday. This was a weekly fall of -596 contracts from the previous week which had a total of -3,461 net contracts.
This week’s current strength score (the trader positioning range over the past three years, measured from 0 to 100) shows the speculators are currently Bearish-Extreme with a score of 0.0 percent. The commercials are Bullish-Extreme with a score of 100.0 percent and the small traders (not shown in chart) are Bearish with a score of 26.7 percent.
| Palladium Futures Statistics | SPECULATORS | COMMERCIALS | SMALL TRADERS |
| – Percent of Open Interest Longs: | 13.5 | 71.8 | 14.3 |
| – Percent of Open Interest Shorts: | 65.9 | 15.5 | 18.1 |
| – Net Position: | -4,057 | 4,354 | -297 |
| – Gross Longs: | 1,045 | 5,555 | 1,105 |
| – Gross Shorts: | 5,102 | 1,201 | 1,402 |
| – Long to Short Ratio: | 0.2 to 1 | 4.6 to 1 | 0.8 to 1 |
| NET POSITION TREND: | |||
| – Strength Index Score (3 Year Range Pct): | 0.0 | 100.0 | 26.7 |
| – Strength Index Reading (3 Year Range): | Bearish-Extreme | Bullish-Extreme | Bearish |
| NET POSITION MOVEMENT INDEX: | |||
| – 6-Week Change in Strength Index: | -7.3 | 10.7 | -34.4 |
Article By InvestMacro – Receive our weekly COT Reports by Email
*COT Report: The COT data, released weekly to the public each Friday, is updated through the most recent Tuesday (data is 3 days old) and shows a quick view of how large speculators or non-commercials (for-profit traders) were positioned in the futures markets.
The CFTC categorizes trader positions according to commercial hedgers (traders who use futures contracts for hedging as part of the business), non-commercials (large traders who speculate to realize trading profits) and nonreportable traders (usually small traders/speculators) as well as their open interest (contracts open in the market at time of reporting).See CFTC criteria here.

- COT Metals Charts: Weekly Speculator Bets led by Copper & Steel Jul 18, 2026
- COT Bonds Charts: Weekly Speculator Bets led by 2-Year, SOFR 3M & 5-Year Bonds Jul 18, 2026
- COT Energy Charts: Weekly Speculator Bets led by Brent Oil & Heating Oil Jul 18, 2026
- COT Soft Commodities Charts: Weekly Speculator Bets led by Wheat, Corn & Soybean Meal Jul 18, 2026
- The Bank of Canada kept its interest rate unchanged. Platinum prices reached a three‑week high Jul 16, 2026
- Stock indices rose after the release of US inflation data. China’s GDP slowed sharply Jul 15, 2026
- GBP/USD Awaits Political News: What Will Happen Next Jul 15, 2026
- USD/JPY Holds at Highs: Pressure Lingers on Yen Jul 14, 2026
- Oil prices jumped 4% amid a new wave of escalation between the US and Iran Jul 13, 2026
- EUR/USD: US Inflation Will Determine Everything Jul 13, 2026