
By InvestMacro | COT | Data Tables | COT Leaders | Downloads | COT Newsletter
Here are the latest charts and statistics for the Commitment of Traders (COT) data published by the Commodities Futures Trading Commission (CFTC).
The latest COT data is updated through Tuesday June 7th and shows a quick view of how large traders (for-profit speculators and commercial entities) were positioned in the futures markets.
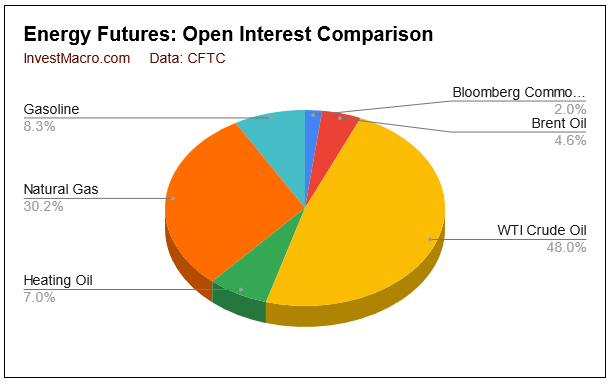
Energy market speculator bets were mixed this week as three out of the six energy markets we cover had higher positioning this week while three markets had lower contracts. Leading the gains for energy markets was Brent Crude Oil (4,774 contracts) and Heating Oil (4,765 contracts) with Bloomberg Commodity Index (2,178 contracts) also showing a positive week. Meanwhile, leading the declines in speculator bets this week were WTI Crude Oil (-4,720 contracts) and Natural Gas (-3,974 contracts) with Gasoline (-3,202 contracts) also registering lower bets on the week.
Free Reports:
 Sign Up for Our Stock Market Newsletter – Get updated on News, Charts & Rankings of Public Companies when you join our Stocks Newsletter
 Get our Weekly Commitment of Traders Reports - See where the biggest traders (Hedge Funds and Commercial Hedgers) are positioned in the futures markets on a weekly basis.
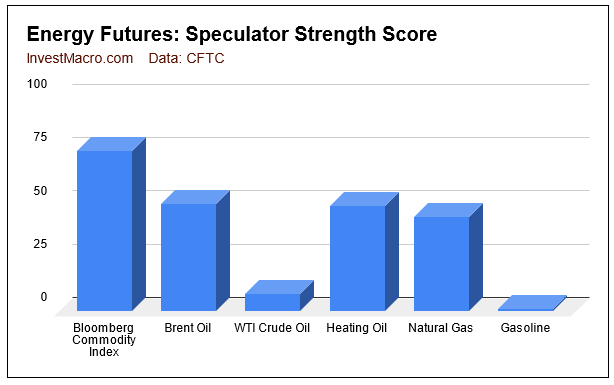
Strength scores (3-Year range of Speculator positions, from 0 to 100 where above 80 is extreme bullish and below 20 is extreme bearish) show that the Bloomberg Commodity Index is the highest above its midpoint for the past 3 years while Brent, Heating Oil and Natural Gas are slightly below the 50 percent level.
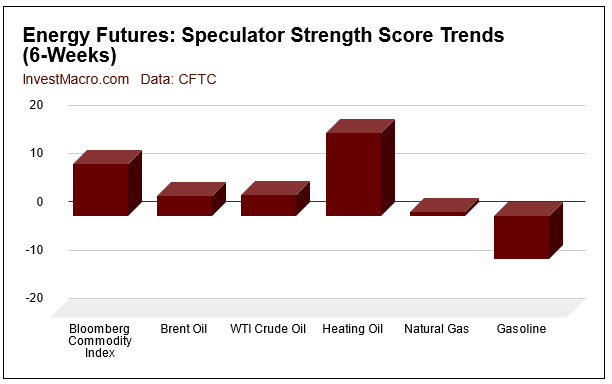
Strength score trends (or move index, that show 6-week changes in strength scores) shows that Heating Oil and the Bloomberg Commodity Index bets have been rising the strongest over the past six weeks while Gasoline is moving the opposite way.
| Jun-07-2022 | OI | OI-Index | Spec-Net | Spec-Index | Com-Net | COM-Index | Smalls-Net | Smalls-Index |
|---|---|---|---|---|---|---|---|---|
| WTI Crude | 1,790,618 | 10 | 328,256 | 8 | -369,033 | 93 | 40,777 | 72 |
| Gold | 494,130 | 12 | 175,268 | 7 | -199,886 | 95 | 24,618 | 18 |
| Silver | 148,294 | 15 | 17,404 | 5 | -27,990 | 94 | 10,586 | 10 |
| Copper | 194,187 | 22 | -3,714 | 40 | 879 | 60 | 2,835 | 42 |
| Palladium | 7,035 | 3 | -3,461 | 2 | 3,581 | 97 | -120 | 37 |
| Platinum | 65,295 | 31 | 5,933 | 12 | -9,742 | 92 | 3,809 | 15 |
| Natural Gas | 1,127,731 | 10 | -114,342 | 44 | 66,419 | 52 | 47,923 | 93 |
| Brent | 169,802 | 16 | -36,098 | 51 | 34,208 | 50 | 1,890 | 35 |
| Heating Oil | 261,651 | 20 | 4,886 | 50 | -24,428 | 45 | 19,542 | 66 |
| Soybeans | 760,444 | 35 | 176,644 | 68 | -148,390 | 39 | -28,254 | 23 |
| Corn | 1,557,167 | 31 | 391,264 | 80 | -337,137 | 24 | -54,127 | 12 |
| Coffee | 222,583 | 15 | 48,767 | 81 | -51,363 | 23 | 2,596 | 16 |
| Sugar | 849,814 | 12 | 195,403 | 77 | -234,496 | 24 | 39,093 | 56 |
| Wheat | 333,705 | 12 | 23,881 | 50 | -19,863 | 31 | -4,018 | 90 |
WTI Crude Oil Futures:
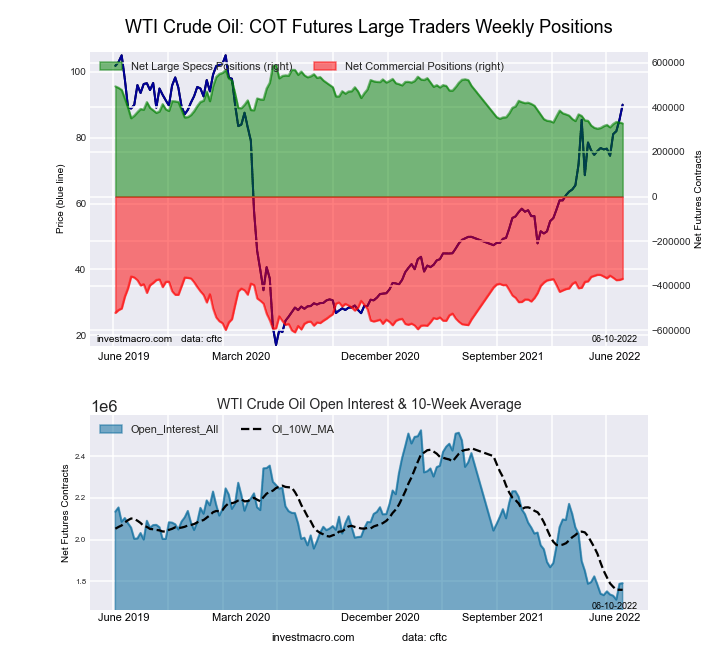 The WTI Crude Oil Futures large speculator standing this week recorded a net position of 328,256 contracts in the data reported through Tuesday. This was a weekly decrease of -4,720 contracts from the previous week which had a total of 332,976 net contracts.
This week’s current strength score (the trader positioning range over the past three years, measured from 0 to 100) shows the speculators are currently Bearish-Extreme with a score of 8.2 percent. The commercials are Bullish-Extreme with a score of 92.9 percent and the small traders (not shown in chart) are Bullish with a score of 72.5 percent.
| WTI Crude Oil Futures Statistics | SPECULATORS | COMMERCIALS | SMALL TRADERS |
| – Percent of Open Interest Longs: | 23.7 | 34.8 | 5.2 |
| – Percent of Open Interest Shorts: | 5.3 | 55.4 | 2.9 |
| – Net Position: | 328,256 | -369,033 | 40,777 |
| – Gross Longs: | 423,882 | 622,320 | 92,501 |
| – Gross Shorts: | 95,626 | 991,353 | 51,724 |
| – Long to Short Ratio: | 4.4 to 1 | 0.6 to 1 | 1.8 to 1 |
| NET POSITION TREND: | |||
| – Strength Index Score (3 Year Range Pct): | 8.2 | 92.9 | 72.5 |
| – Strength Index Reading (3 Year Range): | Bearish-Extreme | Bullish-Extreme | Bullish |
| NET POSITION MOVEMENT INDEX: | |||
| – 6-Week Change in Strength Index: | 4.3 | -4.2 | -2.1 |
Brent Crude Oil Futures:
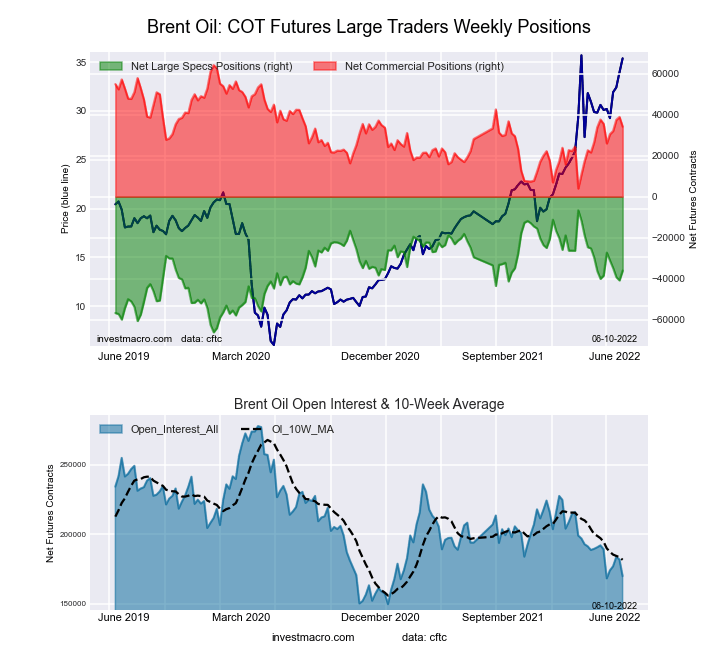 The Brent Crude Oil Futures large speculator standing this week recorded a net position of -36,098 contracts in the data reported through Tuesday. This was a weekly increase of 4,774 contracts from the previous week which had a total of -40,872 net contracts.
This week’s current strength score (the trader positioning range over the past three years, measured from 0 to 100) shows the speculators are currently Bullish with a score of 50.6 percent. The commercials are Bullish with a score of 50.2 percent and the small traders (not shown in chart) are Bearish with a score of 34.8 percent.
| Brent Crude Oil Futures Statistics | SPECULATORS | COMMERCIALS | SMALL TRADERS |
| – Percent of Open Interest Longs: | 15.3 | 51.5 | 4.4 |
| – Percent of Open Interest Shorts: | 36.6 | 31.4 | 3.3 |
| – Net Position: | -36,098 | 34,208 | 1,890 |
| – Gross Longs: | 26,009 | 87,488 | 7,434 |
| – Gross Shorts: | 62,107 | 53,280 | 5,544 |
| – Long to Short Ratio: | 0.4 to 1 | 1.6 to 1 | 1.3 to 1 |
| NET POSITION TREND: | |||
| – Strength Index Score (3 Year Range Pct): | 50.6 | 50.2 | 34.8 |
| – Strength Index Reading (3 Year Range): | Bullish | Bullish | Bearish |
| NET POSITION MOVEMENT INDEX: | |||
| – 6-Week Change in Strength Index: | 4.1 | -2.3 | -14.1 |
Natural Gas Futures:
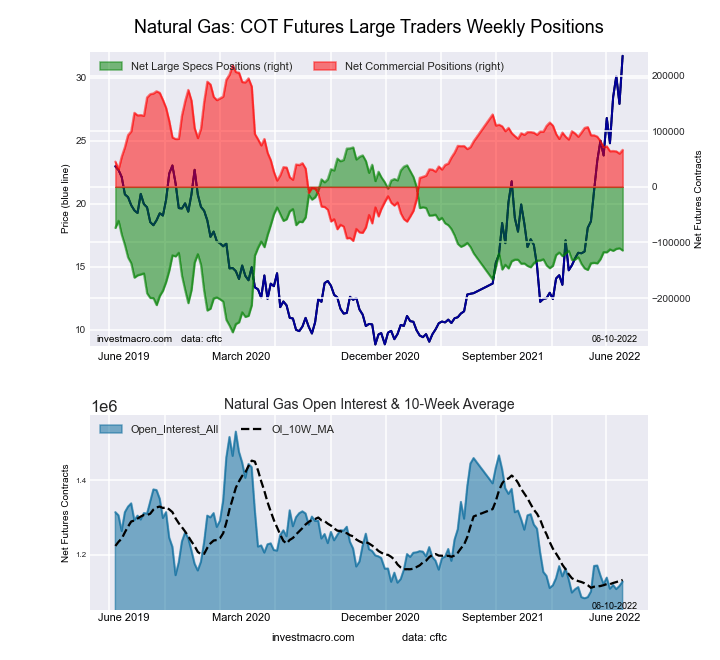 The Natural Gas Futures large speculator standing this week recorded a net position of -114,342 contracts in the data reported through Tuesday. This was a weekly decrease of -3,974 contracts from the previous week which had a total of -110,368 net contracts.
This week’s current strength score (the trader positioning range over the past three years, measured from 0 to 100) shows the speculators are currently Bearish with a score of 44.3 percent. The commercials are Bullish with a score of 51.8 percent and the small traders (not shown in chart) are Bullish-Extreme with a score of 93.5 percent.
| Natural Gas Futures Statistics | SPECULATORS | COMMERCIALS | SMALL TRADERS |
| – Percent of Open Interest Longs: | 20.8 | 37.2 | 6.8 |
| – Percent of Open Interest Shorts: | 31.0 | 31.3 | 2.6 |
| – Net Position: | -114,342 | 66,419 | 47,923 |
| – Gross Longs: | 235,073 | 419,847 | 76,779 |
| – Gross Shorts: | 349,415 | 353,428 | 28,856 |
| – Long to Short Ratio: | 0.7 to 1 | 1.2 to 1 | 2.7 to 1 |
| NET POSITION TREND: | |||
| – Strength Index Score (3 Year Range Pct): | 44.3 | 51.8 | 93.5 |
| – Strength Index Reading (3 Year Range): | Bearish | Bullish | Bullish-Extreme |
| NET POSITION MOVEMENT INDEX: | |||
| – 6-Week Change in Strength Index: | 0.9 | -1.6 | 4.6 |
Gasoline Blendstock Futures:
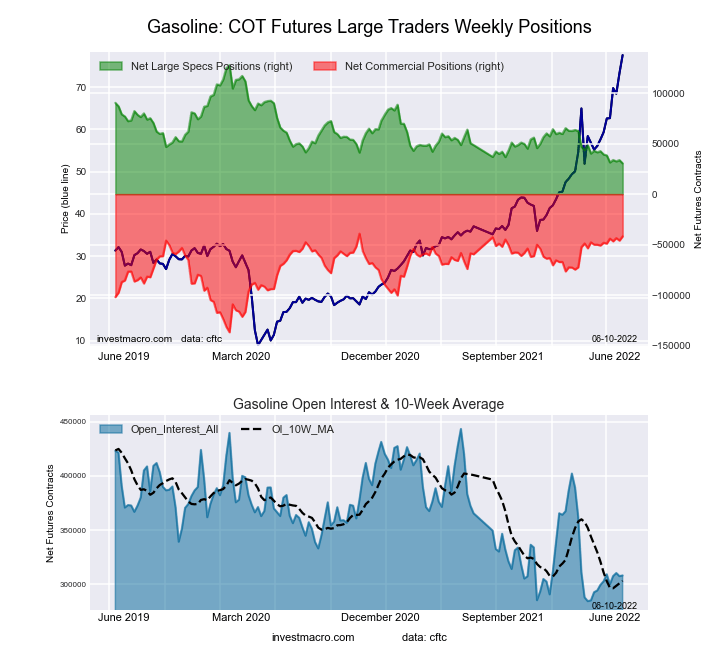 The Gasoline Blendstock Futures large speculator standing this week recorded a net position of 30,488 contracts in the data reported through Tuesday. This was a weekly decrease of -3,202 contracts from the previous week which had a total of 33,690 net contracts.
This week’s current strength score (the trader positioning range over the past three years, measured from 0 to 100) shows the speculators are currently Bearish-Extreme with a score of 1.2 percent. The commercials are Bullish-Extreme with a score of 95.2 percent and the small traders (not shown in chart) are Bullish-Extreme with a score of 88.5 percent.
| Nasdaq Mini Futures Statistics | SPECULATORS | COMMERCIALS | SMALL TRADERS |
| – Percent of Open Interest Longs: | 24.6 | 52.7 | 8.0 |
| – Percent of Open Interest Shorts: | 14.7 | 66.2 | 4.3 |
| – Net Position: | 30,488 | -41,866 | 11,378 |
| – Gross Longs: | 75,841 | 162,330 | 24,623 |
| – Gross Shorts: | 45,353 | 204,196 | 13,245 |
| – Long to Short Ratio: | 1.7 to 1 | 0.8 to 1 | 1.9 to 1 |
| NET POSITION TREND: | |||
| – Strength Index Score (3 Year Range Pct): | 1.2 | 95.2 | 88.5 |
| – Strength Index Reading (3 Year Range): | Bearish-Extreme | Bullish-Extreme | Bullish-Extreme |
| NET POSITION MOVEMENT INDEX: | |||
| – 6-Week Change in Strength Index: | -8.9 | 6.4 | 16.0 |
#2 Heating Oil NY-Harbor Futures:
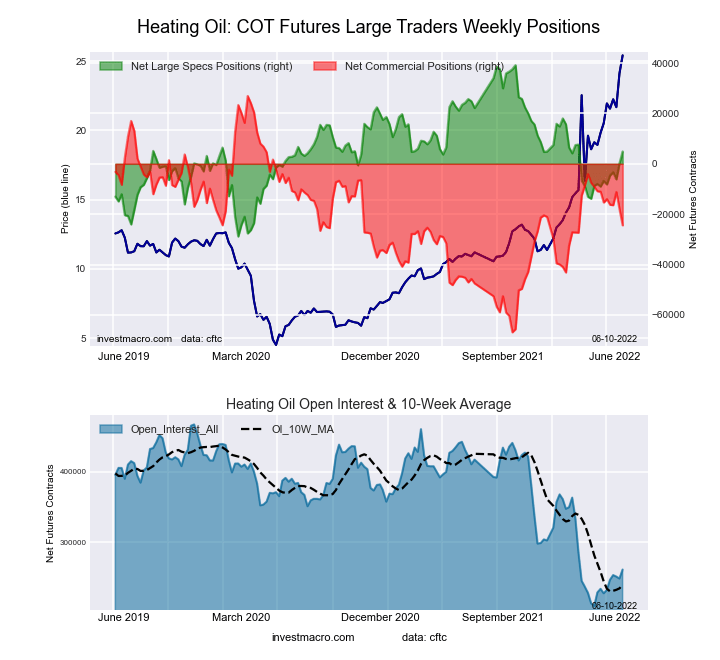 The #2 Heating Oil NY-Harbor Futures large speculator standing this week recorded a net position of 4,886 contracts in the data reported through Tuesday. This was a weekly rise of 4,765 contracts from the previous week which had a total of 121 net contracts.
This week’s current strength score (the trader positioning range over the past three years, measured from 0 to 100) shows the speculators are currently Bearish with a score of 49.6 percent. The commercials are Bearish with a score of 45.3 percent and the small traders (not shown in chart) are Bullish with a score of 66.1 percent.
| Heating Oil Futures Statistics | SPECULATORS | COMMERCIALS | SMALL TRADERS |
| – Percent of Open Interest Longs: | 17.3 | 49.5 | 17.5 |
| – Percent of Open Interest Shorts: | 15.4 | 58.9 | 10.1 |
| – Net Position: | 4,886 | -24,428 | 19,542 |
| – Gross Longs: | 45,231 | 129,588 | 45,902 |
| – Gross Shorts: | 40,345 | 154,016 | 26,360 |
| – Long to Short Ratio: | 1.1 to 1 | 0.8 to 1 | 1.7 to 1 |
| NET POSITION TREND: | |||
| – Strength Index Score (3 Year Range Pct): | 49.6 | 45.3 | 66.1 |
| – Strength Index Reading (3 Year Range): | Bearish | Bearish | Bullish |
| NET POSITION MOVEMENT INDEX: | |||
| – 6-Week Change in Strength Index: | 17.2 | -9.7 | -9.1 |
Bloomberg Commodity Index Futures:
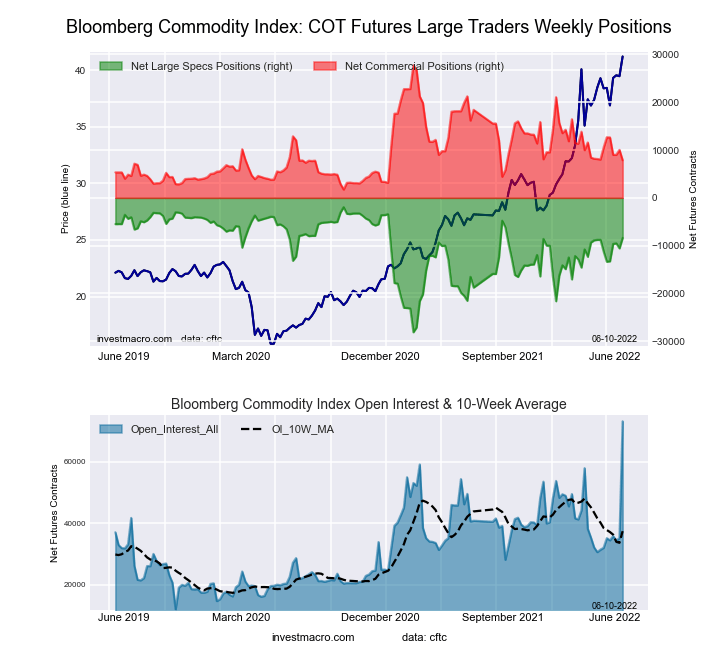 The Bloomberg Commodity Index Futures large speculator standing this week recorded a net position of -8,383 contracts in the data reported through Tuesday. This was a weekly increase of 2,178 contracts from the previous week which had a total of -10,561 net contracts.
This week’s current strength score (the trader positioning range over the past three years, measured from 0 to 100) shows the speculators are currently Bullish with a score of 75.4 percent. The commercials are Bearish with a score of 23.5 percent and the small traders (not shown in chart) are Bearish with a score of 37.9 percent.
| Bloomberg Index Futures Statistics | SPECULATORS | COMMERCIALS | SMALL TRADERS |
| – Percent of Open Interest Longs: | 33.5 | 62.0 | 1.5 |
| – Percent of Open Interest Shorts: | 45.0 | 51.3 | 0.8 |
| – Net Position: | -8,383 | 7,865 | 518 |
| – Gross Longs: | 24,512 | 45,368 | 1,126 |
| – Gross Shorts: | 32,895 | 37,503 | 608 |
| – Long to Short Ratio: | 0.7 to 1 | 1.2 to 1 | 1.9 to 1 |
| NET POSITION TREND: | |||
| – Strength Index Score (3 Year Range Pct): | 75.4 | 23.5 | 37.9 |
| – Strength Index Reading (3 Year Range): | Bullish | Bearish | Bearish |
| NET POSITION MOVEMENT INDEX: | |||
| – 6-Week Change in Strength Index: | 10.8 | -10.2 | -6.8 |
Article By InvestMacro – Receive our weekly COT Reports by Email
*COT Report: The COT data, released weekly to the public each Friday, is updated through the most recent Tuesday (data is 3 days old) and shows a quick view of how large speculators or non-commercials (for-profit traders) were positioned in the futures markets.
The CFTC categorizes trader positions according to commercial hedgers (traders who use futures contracts for hedging as part of the business), non-commercials (large traders who speculate to realize trading profits) and nonreportable traders (usually small traders/speculators) as well as their open interest (contracts open in the market at time of reporting).See CFTC criteria here.

- COT Metals Charts: Weekly Speculator Bets led by Copper & Steel Jul 18, 2026
- COT Bonds Charts: Weekly Speculator Bets led by 2-Year, SOFR 3M & 5-Year Bonds Jul 18, 2026
- COT Energy Charts: Weekly Speculator Bets led by Brent Oil & Heating Oil Jul 18, 2026
- COT Soft Commodities Charts: Weekly Speculator Bets led by Wheat, Corn & Soybean Meal Jul 18, 2026
- The Bank of Canada kept its interest rate unchanged. Platinum prices reached a three‑week high Jul 16, 2026
- Stock indices rose after the release of US inflation data. China’s GDP slowed sharply Jul 15, 2026
- GBP/USD Awaits Political News: What Will Happen Next Jul 15, 2026
- USD/JPY Holds at Highs: Pressure Lingers on Yen Jul 14, 2026
- Oil prices jumped 4% amid a new wave of escalation between the US and Iran Jul 13, 2026
- EUR/USD: US Inflation Will Determine Everything Jul 13, 2026