
By InvestMacro | COT | Data Tables | COT Leaders | Downloads | COT Newsletter
Here are the latest charts and statistics for the Commitment of Traders (COT) data published by the Commodities Futures Trading Commission (CFTC).
The latest COT data is updated through Tuesday July 12th and shows a quick view of how large traders (for-profit speculators and commercial entities) were positioned in the futures markets.
Weekly Speculator Changes
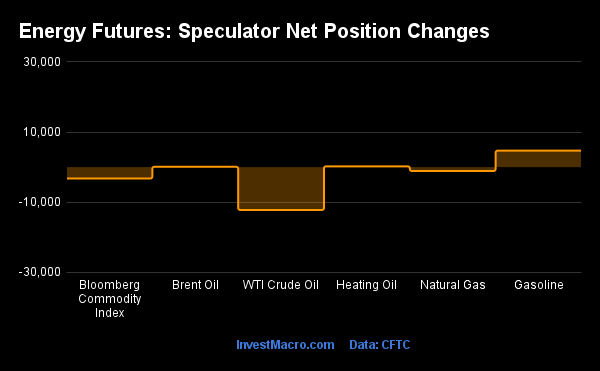
COT energy market speculator bets were mixed this week as three out of the six energy markets we cover had higher positioning while the other three markets saw decreasing net positions for the week.
Leading the gains for energy markets was Gasoline (4,721 contracts) with Heating Oil (242 contracts) and Brent Crude Oil (126 contracts) also showing very small positive weeks. Meanwhile, leading the declines in speculator bets this week were WTI Crude Oil (-12,195 contracts) and the Bloomberg Commodity Index (-3,229 contracts) with Natural Gas (-1,084 contracts) also registering lower bets on the week.
| Jul-12-2022 | OI | OI-Index | Spec-Net | Spec-Index | Com-Net | COM-Index | Smalls-Net | Smalls-Index |
|---|---|---|---|---|---|---|---|---|
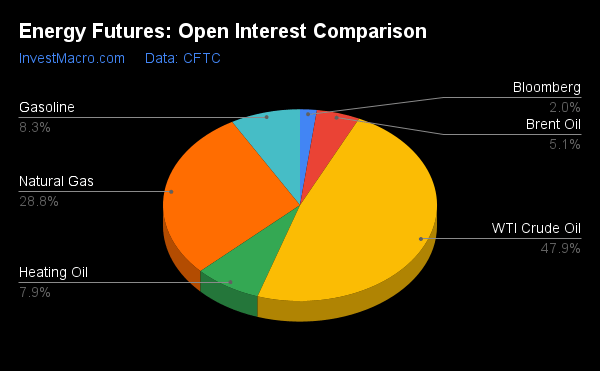
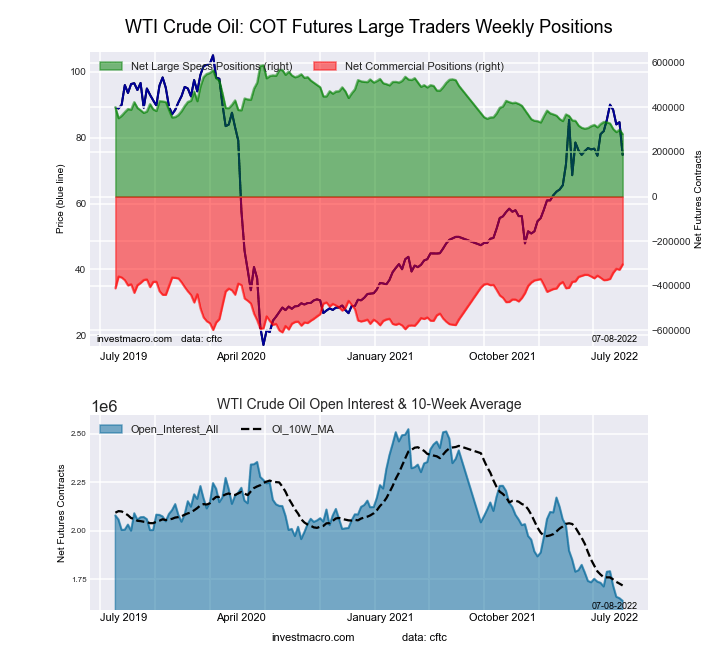
| WTI Crude | 1,612,803 | 0 | 268,328 | 0 | -294,526 | 100 | 26,198 | 52 |
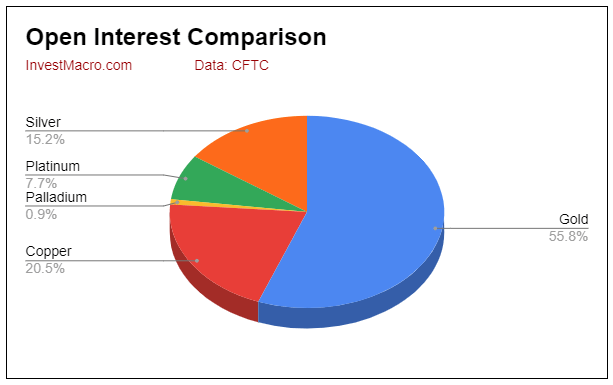
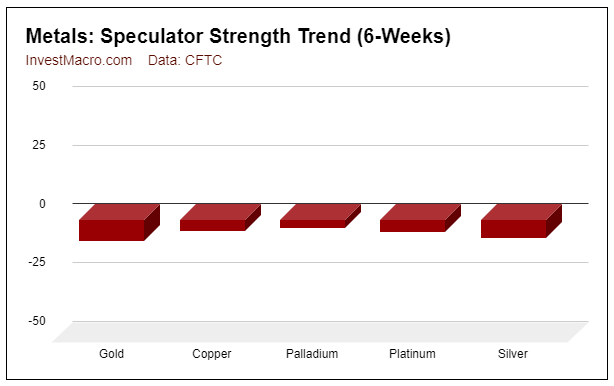
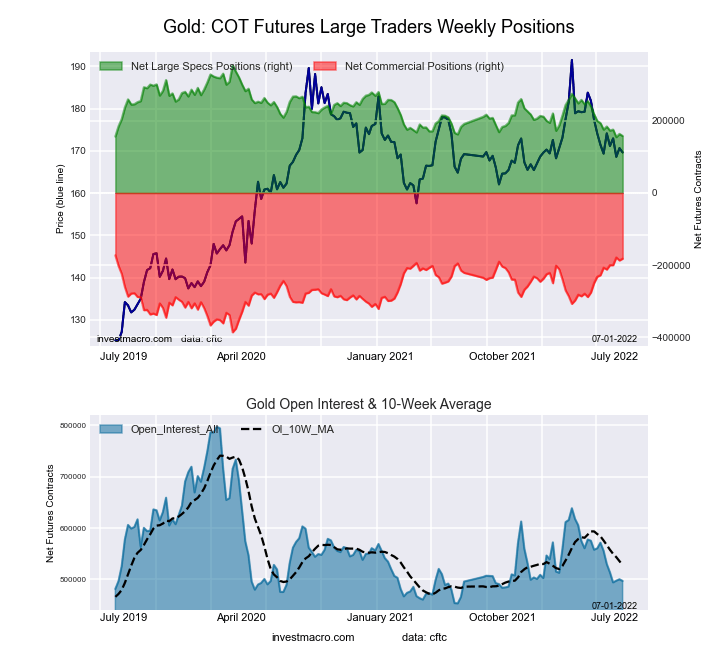
| Gold | 542,493 | 26 | 118,121 | 0 | -137,788 | 100 | 19,667 | 0 |
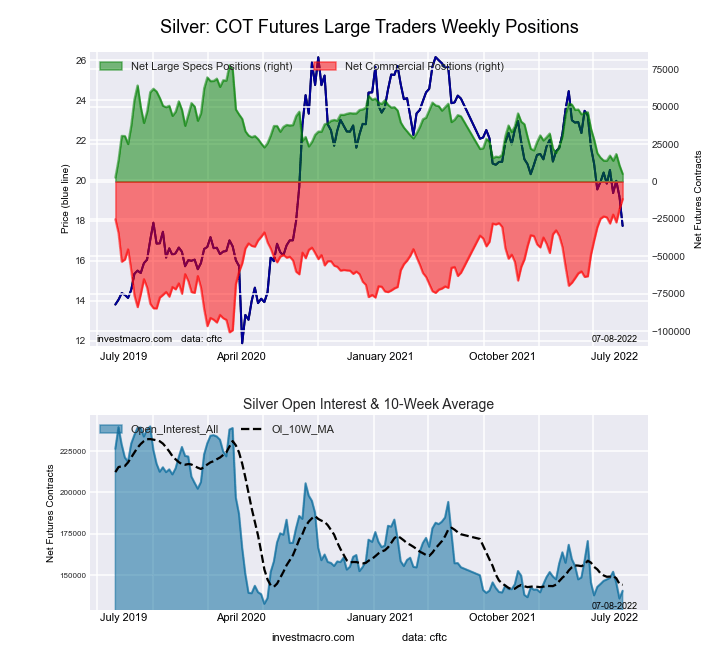
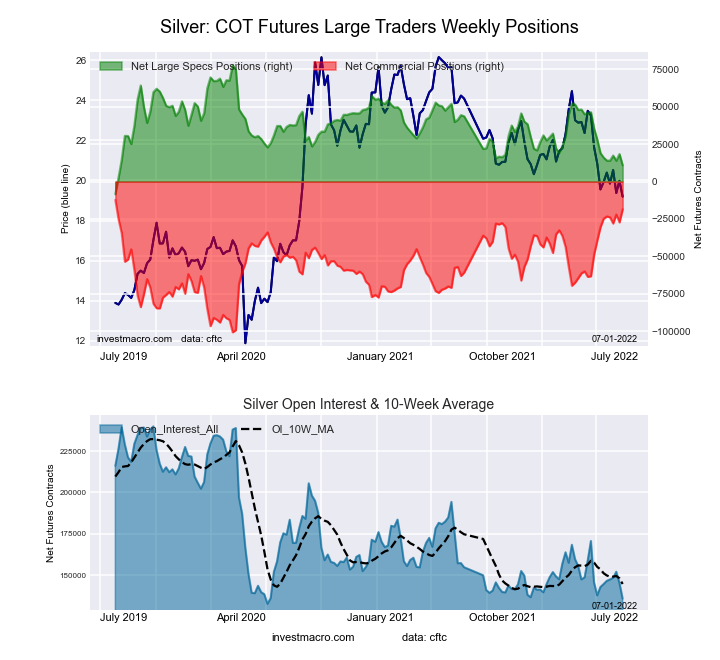
| Silver | 142,259 | 9 | 3,204 | 0 | -9,612 | 100 | 6,408 | 0 |
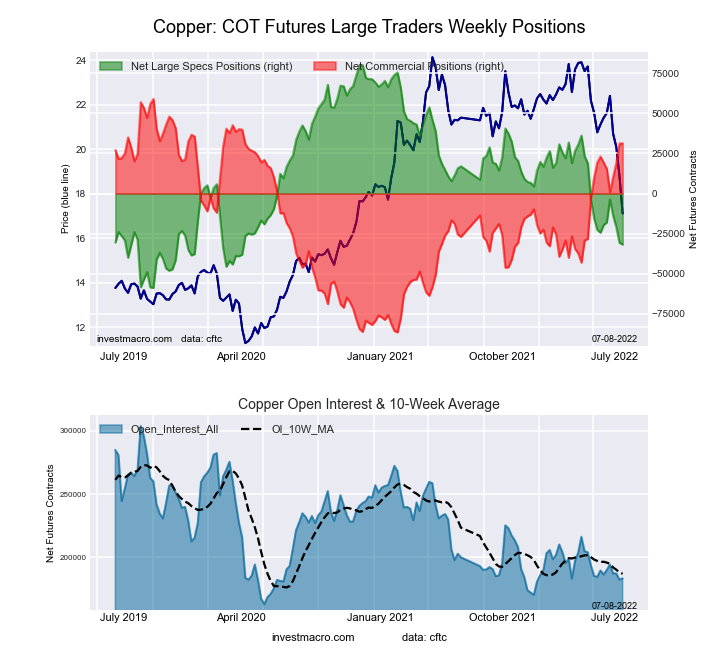
| Copper | 172,037 | 6 | -26,295 | 23 | 27,061 | 78 | -766 | 21 |
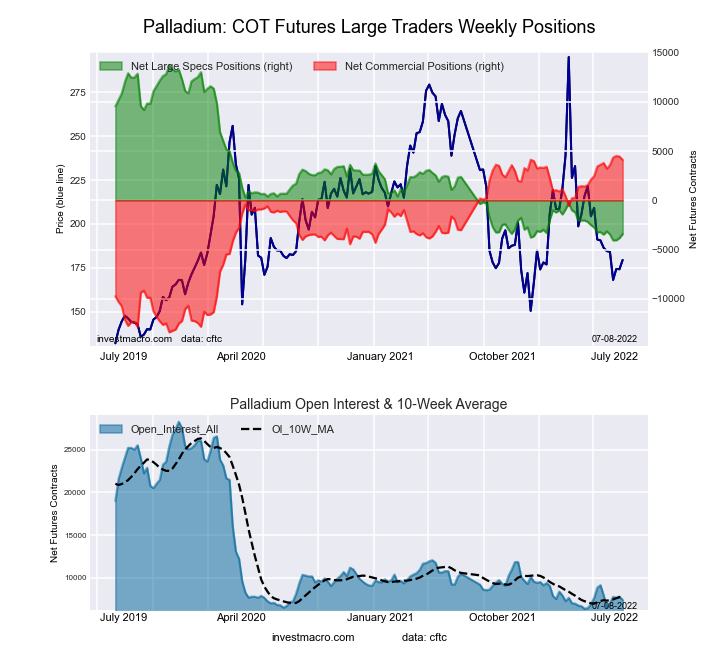
| Palladium | 6,474 | 1 | -2,802 | 7 | 3,252 | 93 | -450 | 18 |
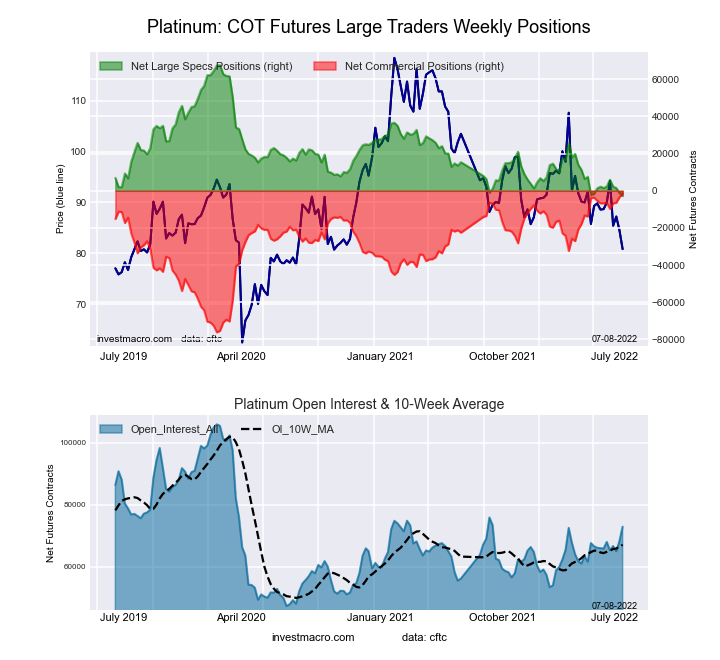
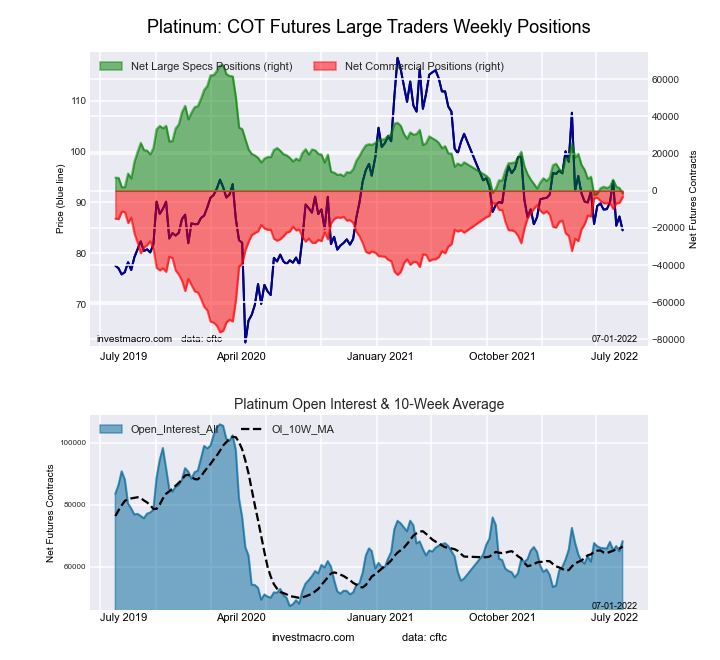
| Platinum | 75,615 | 48 | -5,911 | 0 | 1,235 | 100 | 4,676 | 27 |
| Natural Gas | 969,204 | 0 | -131,603 | 39 | 94,195 | 61 | 37,408 | 69 |
| Brent | 171,950 | 17 | -38,388 | 47 | 36,619 | 54 | 1,769 | 33 |
| Heating Oil | 266,330 | 22 | 6,728 | 52 | -22,853 | 47 | 16,125 | 54 |
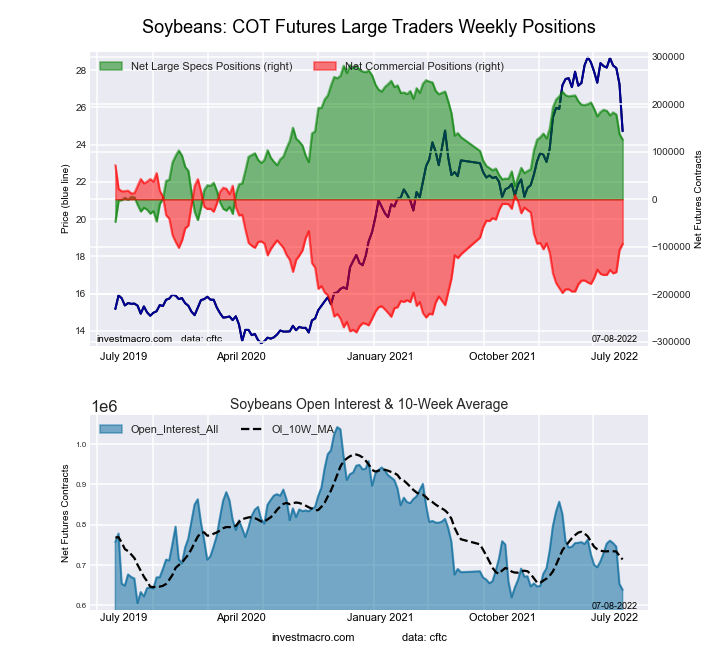
| Soybeans | 611,751 | 1 | 115,119 | 49 | -87,284 | 57 | -27,835 | 24 |
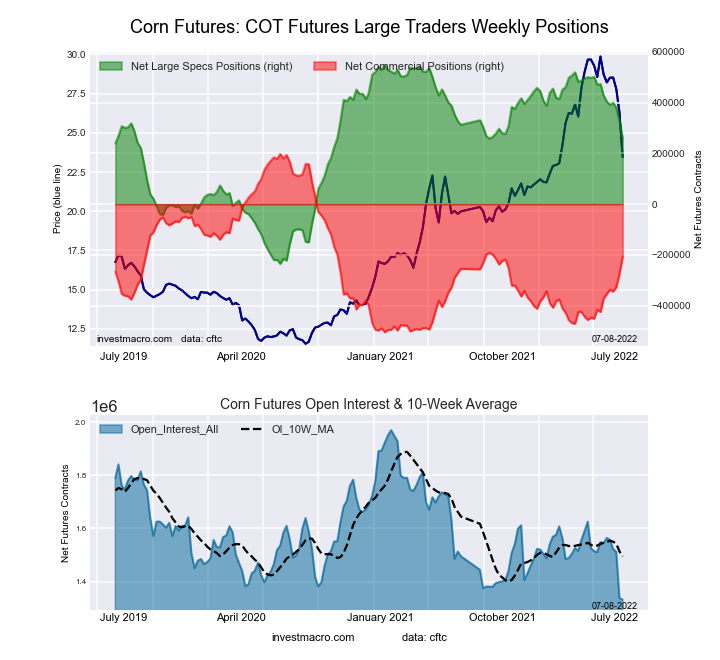
| Corn | 1,333,199 | 0 | 247,156 | 62 | -196,533 | 44 | -50,623 | 14 |
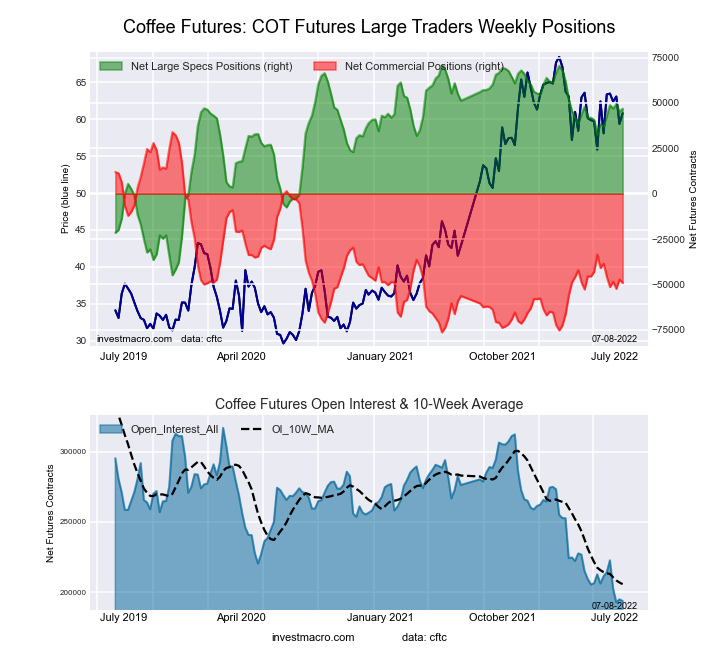
| Coffee | 195,810 | 2 | 34,308 | 68 | -35,166 | 37 | 858 | 0 |
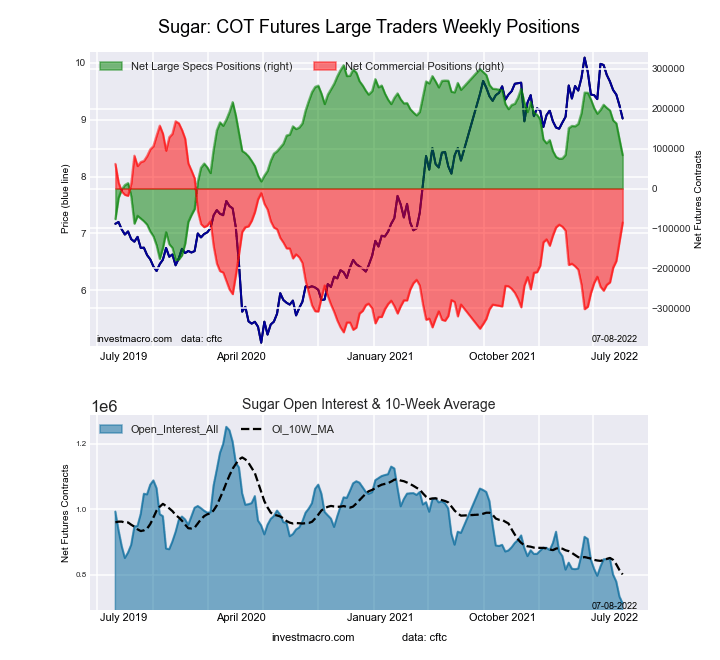
| Sugar | 701,144 | 0 | 105,869 | 58 | -115,779 | 46 | 9,910 | 20 |
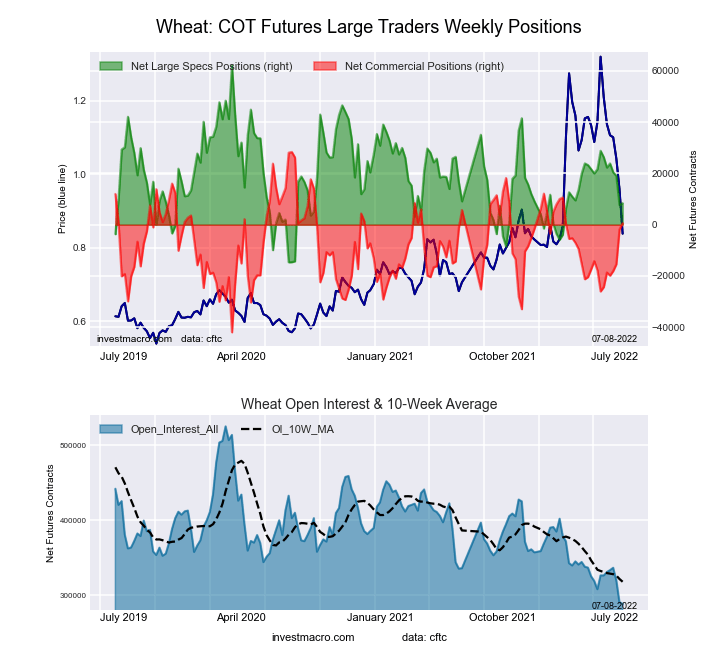
| Wheat | 288,182 | 0 | 4,639 | 25 | 5,041 | 67 | -9,680 | 60 |
Strength Scores
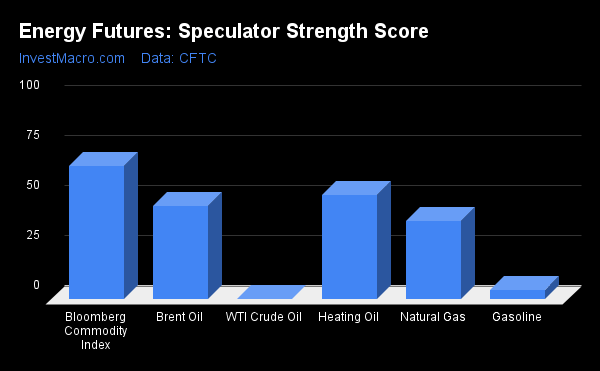
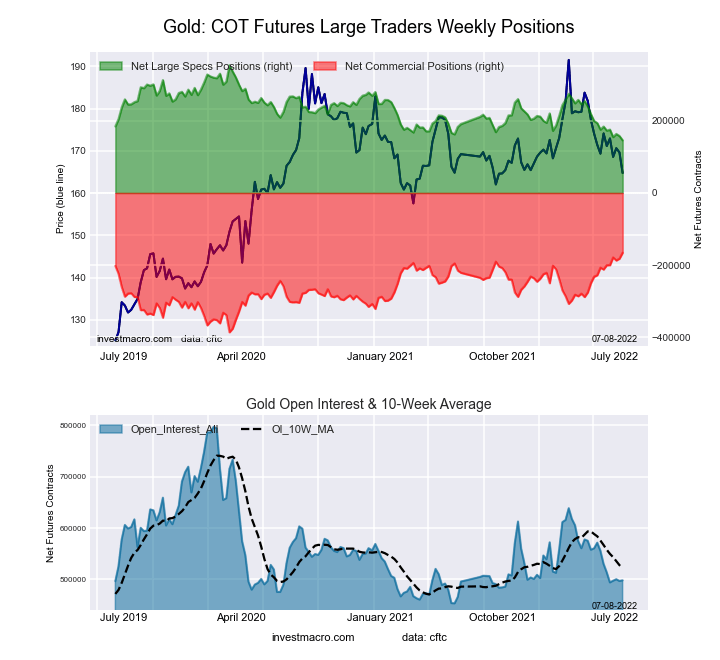
Strength Scores (a normalized measure of Speculator positions over a 3-Year range, from 0 to 100 where above 80 is extreme bullish and below 20 is extreme bearish) show that the Bloomberg Commodity Index (66.5 percent) and Heating Oil (52.3 percent) lead the energy markets this week. The Bloomberg Commodity Index has been the strongest strength score in the past few weeks but came down from a 78.8 percent score last week showing a weakening strength compared to the 3-year range. On the downside, WTI Crude Oil (0.0 percent) and Gasoline (4.7 percent) come in as the lowest strength scores currently and are both in bearish extreme levels (near the bottom of their 3-year ranges).
Strength Statistics:
WTI Crude Oil (0.0 percent) vs WTI Crude Oil previous week (3.8 percent)
Brent Crude Oil (46.8 percent) vs Brent Crude Oil previous week (46.5 percent)
Natural Gas (39.1 percent) vs Natural Gas previous week (39.4 percent)
Gasoline (4.7 percent) vs Gasoline previous week (0.0 percent)
Heating Oil (52.3 percent) vs Heating Oil previous week (52.0 percent)
Bloomberg Commodity Index (66.5 percent) vs Bloomberg Commodity Index previous week (78.8 percent)
Strength Trends
Strength Score Trends (or move index, calculates the 6-week changes in strength scores) show that Heating Oil (9.7 percent) leads the past six weeks trends for energy this week. Brent Crude Oil (4.2 percent) is the only positive mover in the latest trends data. WTI Crude Oil (-20.1 percent) leads the downside trend scores currently while the next market with lower trend scores was Natural Gas (-6.4 percent) followed by Gasoline (-1.0 percent).

Strength Trend Statistics:
WTI Crude Oil (-20.1 percent) vs WTI Crude Oil previous week (-16.9 percent)
Brent Crude Oil (4.2 percent) vs Brent Crude Oil previous week (1.3 percent)
Natural Gas (-6.4 percent) vs Natural Gas previous week (-5.7 percent)
Gasoline (-1.0 percent) vs Gasoline previous week (-4.4 percent)
Heating Oil (9.7 percent) vs Heating Oil previous week (18.7 percent)
Bloomberg Commodity Index (-0.6 percent) vs Bloomberg Commodity Index previous week (7.8 percent)
Individual Markets:
WTI Crude Oil Futures:
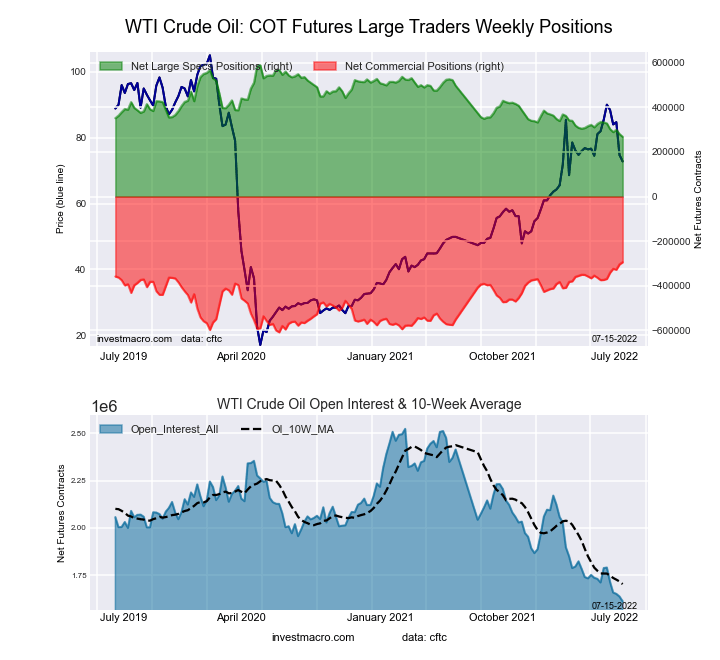 The WTI Crude Oil Futures large speculator standing this week resulted in a net position of 268,328 contracts in the data reported through Tuesday. This was a weekly fall of -12,195 contracts from the previous week which had a total of 280,523 net contracts.
This week’s current strength score (the trader positioning range over the past three years, measured from 0 to 100) shows the speculators are currently Bearish-Extreme with a score of 0.0 percent. The commercials are Bullish-Extreme with a score of 100.0 percent and the small traders (not shown in chart) are Bullish with a score of 51.9 percent.
| WTI Crude Oil Futures Statistics | SPECULATORS | COMMERCIALS | SMALL TRADERS |
| – Percent of Open Interest Longs: | 23.3 | 36.6 | 5.1 |
| – Percent of Open Interest Shorts: | 6.6 | 54.9 | 3.5 |
| – Net Position: | 268,328 | -294,526 | 26,198 |
| – Gross Longs: | 375,155 | 590,438 | 82,523 |
| – Gross Shorts: | 106,827 | 884,964 | 56,325 |
| – Long to Short Ratio: | 3.5 to 1 | 0.7 to 1 | 1.5 to 1 |
| NET POSITION TREND: | |||
| – Strength Index Score (3 Year Range Pct): | 0.0 | 100.0 | 51.9 |
| – Strength Index Reading (3 Year Range): | Bearish-Extreme | Bullish-Extreme | Bullish |
| NET POSITION MOVEMENT INDEX: | |||
| – 6-Week Change in Strength Index: | -20.1 | 25.2 | -20.6 |
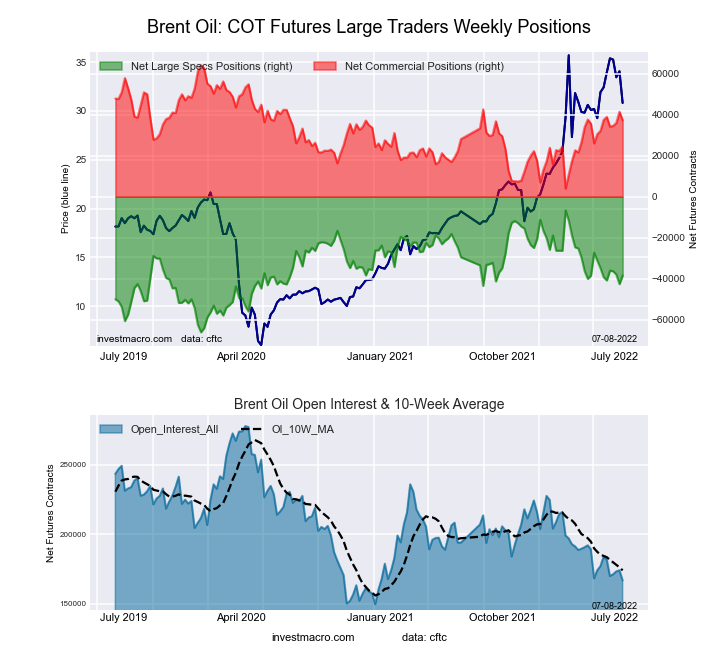
Brent Crude Oil Futures:
 The Brent Crude Oil Futures large speculator standing this week resulted in a net position of -38,388 contracts in the data reported through Tuesday. This was a weekly rise of 126 contracts from the previous week which had a total of -38,514 net contracts.
This week’s current strength score (the trader positioning range over the past three years, measured from 0 to 100) shows the speculators are currently Bearish with a score of 46.8 percent. The commercials are Bullish with a score of 54.2 percent and the small traders (not shown in chart) are Bearish with a score of 33.1 percent.
| Brent Crude Oil Futures Statistics | SPECULATORS | COMMERCIALS | SMALL TRADERS |
| – Percent of Open Interest Longs: | 15.6 | 52.2 | 4.1 |
| – Percent of Open Interest Shorts: | 38.0 | 30.9 | 3.1 |
| – Net Position: | -38,388 | 36,619 | 1,769 |
| – Gross Longs: | 26,868 | 89,831 | 7,060 |
| – Gross Shorts: | 65,256 | 53,212 | 5,291 |
| – Long to Short Ratio: | 0.4 to 1 | 1.7 to 1 | 1.3 to 1 |
| NET POSITION TREND: | |||
| – Strength Index Score (3 Year Range Pct): | 46.8 | 54.2 | 33.1 |
| – Strength Index Reading (3 Year Range): | Bearish | Bullish | Bearish |
| NET POSITION MOVEMENT INDEX: | |||
| – 6-Week Change in Strength Index: | 4.2 | -3.9 | -2.2 |
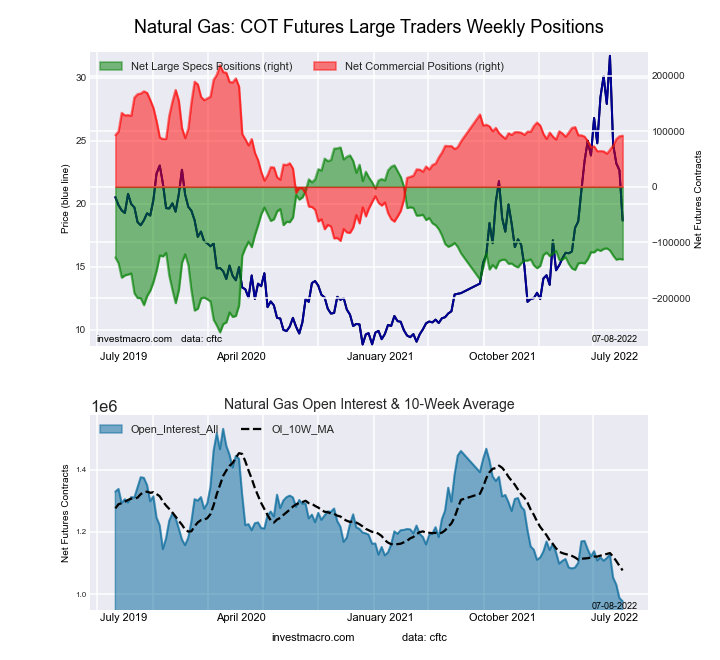
Natural Gas Futures:
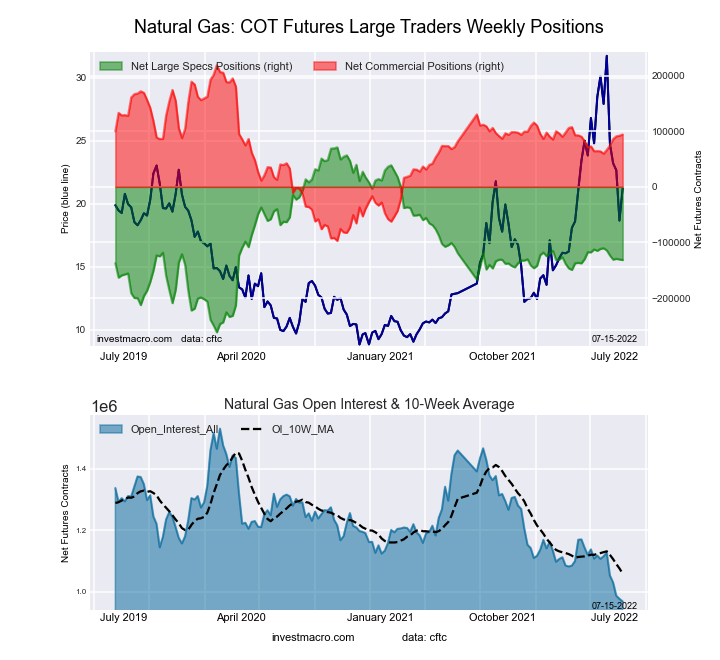 The Natural Gas Futures large speculator standing this week resulted in a net position of -131,603 contracts in the data reported through Tuesday. This was a weekly lowering of -1,084 contracts from the previous week which had a total of -130,519 net contracts.
This week’s current strength score (the trader positioning range over the past three years, measured from 0 to 100) shows the speculators are currently Bearish with a score of 39.1 percent. The commercials are Bullish with a score of 60.6 percent and the small traders (not shown in chart) are Bullish with a score of 68.7 percent.
| Natural Gas Futures Statistics | SPECULATORS | COMMERCIALS | SMALL TRADERS |
| – Percent of Open Interest Longs: | 18.9 | 41.2 | 6.8 |
| – Percent of Open Interest Shorts: | 32.5 | 31.4 | 2.9 |
| – Net Position: | -131,603 | 94,195 | 37,408 |
| – Gross Longs: | 183,194 | 398,833 | 65,940 |
| – Gross Shorts: | 314,797 | 304,638 | 28,532 |
| – Long to Short Ratio: | 0.6 to 1 | 1.3 to 1 | 2.3 to 1 |
| NET POSITION TREND: | |||
| – Strength Index Score (3 Year Range Pct): | 39.1 | 60.6 | 68.7 |
| – Strength Index Reading (3 Year Range): | Bearish | Bullish | Bullish |
| NET POSITION MOVEMENT INDEX: | |||
| – 6-Week Change in Strength Index: | -6.4 | 10.9 | -31.3 |
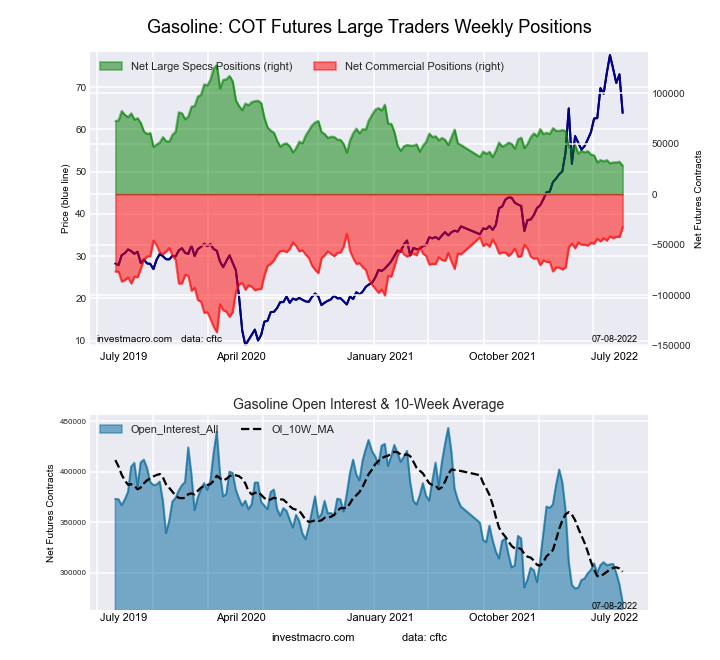
Gasoline Blendstock Futures:
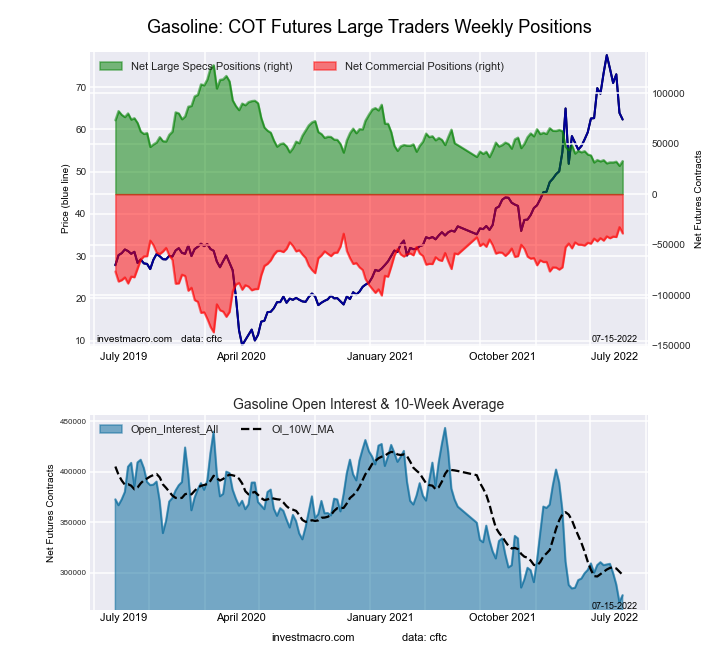 The Gasoline Blendstock Futures large speculator standing this week resulted in a net position of 32,742 contracts in the data reported through Tuesday. This was a weekly increase of 4,721 contracts from the previous week which had a total of 28,021 net contracts.
This week’s current strength score (the trader positioning range over the past three years, measured from 0 to 100) shows the speculators are currently Bearish-Extreme with a score of 4.7 percent. The commercials are Bullish-Extreme with a score of 94.0 percent and the small traders (not shown in chart) are Bullish with a score of 54.1 percent.
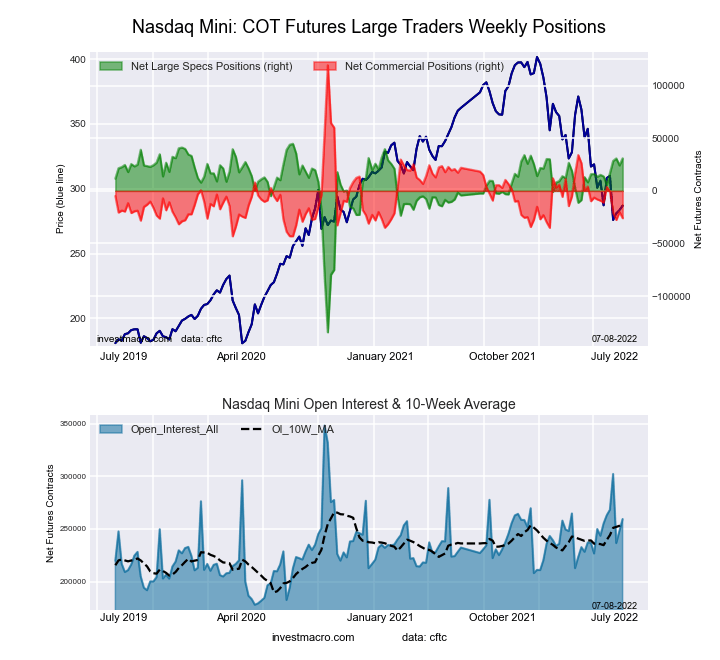
| Nasdaq Mini Futures Statistics | SPECULATORS | COMMERCIALS | SMALL TRADERS |
| – Percent of Open Interest Longs: | 25.1 | 55.1 | 7.3 |
| – Percent of Open Interest Shorts: | 13.4 | 69.2 | 5.1 |
| – Net Position: | 32,742 | -38,954 | 6,212 |
| – Gross Longs: | 69,876 | 153,217 | 20,335 |
| – Gross Shorts: | 37,134 | 192,171 | 14,123 |
| – Long to Short Ratio: | 1.9 to 1 | 0.8 to 1 | 1.4 to 1 |
| NET POSITION TREND: | |||
| – Strength Index Score (3 Year Range Pct): | 4.7 | 94.0 | 54.1 |
| – Strength Index Reading (3 Year Range): | Bearish-Extreme | Bullish-Extreme | Bullish |
| NET POSITION MOVEMENT INDEX: | |||
| – 6-Week Change in Strength Index: | -1.0 | 6.8 | -40.8 |
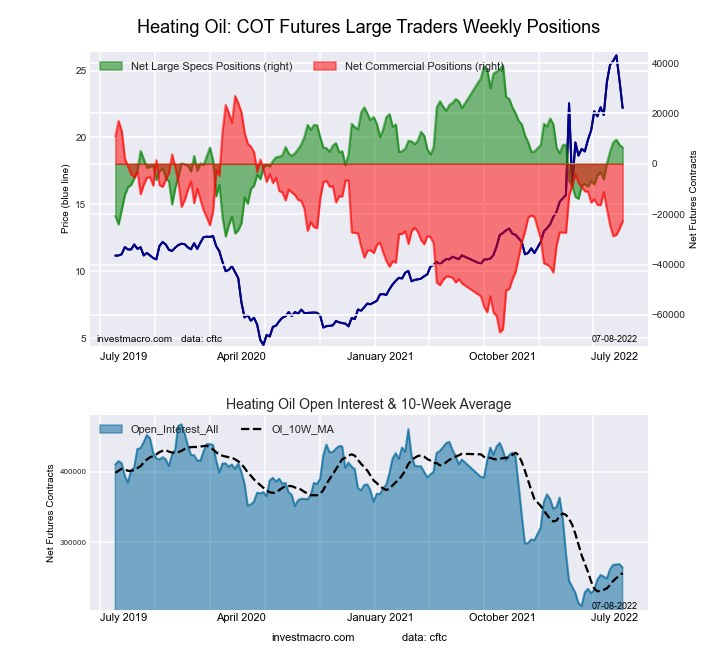
#2 Heating Oil NY-Harbor Futures:
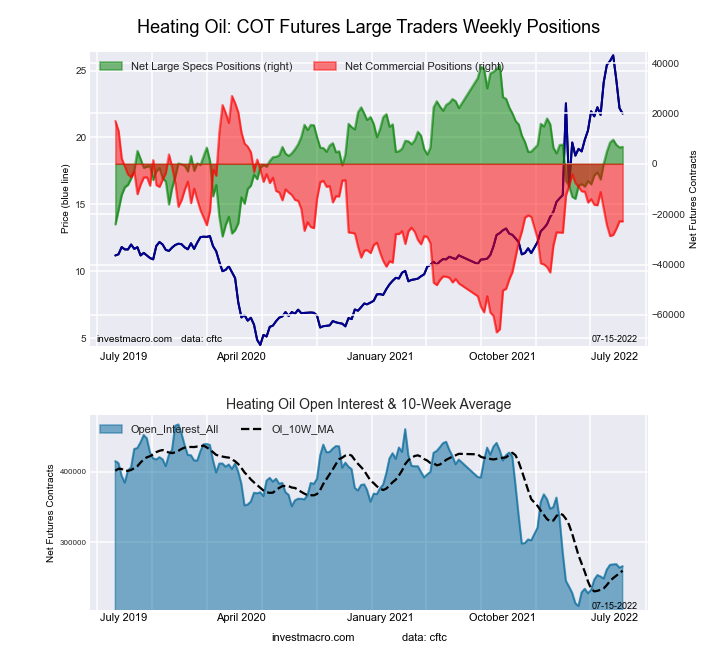 The #2 Heating Oil NY-Harbor Futures large speculator standing this week resulted in a net position of 6,728 contracts in the data reported through Tuesday. This was a weekly increase of 242 contracts from the previous week which had a total of 6,486 net contracts.
This week’s current strength score (the trader positioning range over the past three years, measured from 0 to 100) shows the speculators are currently Bullish with a score of 52.3 percent. The commercials are Bearish with a score of 46.9 percent and the small traders (not shown in chart) are Bullish with a score of 54.2 percent.
| Heating Oil Futures Statistics | SPECULATORS | COMMERCIALS | SMALL TRADERS |
| – Percent of Open Interest Longs: | 13.8 | 52.7 | 16.1 |
| – Percent of Open Interest Shorts: | 11.3 | 61.3 | 10.1 |
| – Net Position: | 6,728 | -22,853 | 16,125 |
| – Gross Longs: | 36,724 | 140,444 | 43,002 |
| – Gross Shorts: | 29,996 | 163,297 | 26,877 |
| – Long to Short Ratio: | 1.2 to 1 | 0.9 to 1 | 1.6 to 1 |
| NET POSITION TREND: | |||
| – Strength Index Score (3 Year Range Pct): | 52.3 | 46.9 | 54.2 |
| – Strength Index Reading (3 Year Range): | Bullish | Bearish | Bullish |
| NET POSITION MOVEMENT INDEX: | |||
| – 6-Week Change in Strength Index: | 9.7 | -5.2 | -6.0 |
Bloomberg Commodity Index Futures:
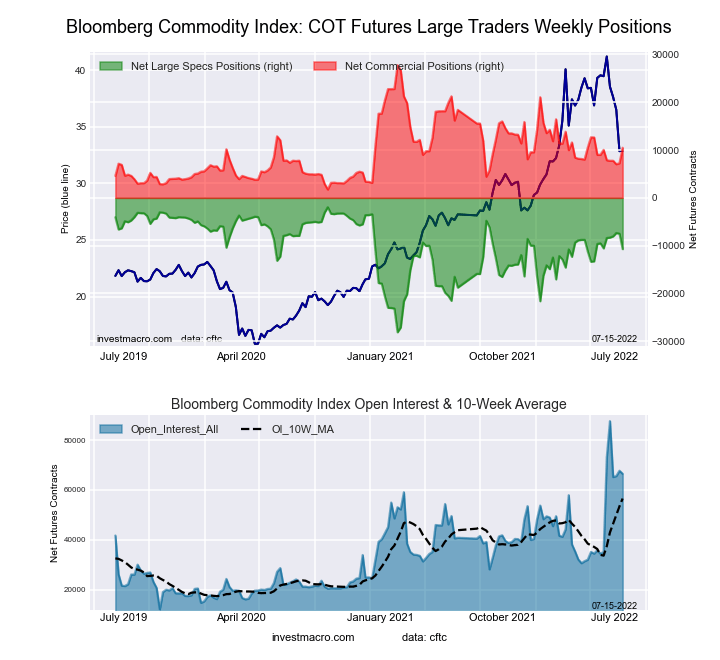 The Bloomberg Commodity Index Futures large speculator standing this week resulted in a net position of -10,715 contracts in the data reported through Tuesday. This was a weekly lowering of -3,229 contracts from the previous week which had a total of -7,486 net contracts.
This week’s current strength score (the trader positioning range over the past three years, measured from 0 to 100) shows the speculators are currently Bullish with a score of 66.5 percent. The commercials are Bearish with a score of 33.6 percent and the small traders (not shown in chart) are Bearish-Extreme with a score of 18.7 percent.
| Bloomberg Index Futures Statistics | SPECULATORS | COMMERCIALS | SMALL TRADERS |
| – Percent of Open Interest Longs: | 23.4 | 72.9 | 0.5 |
| – Percent of Open Interest Shorts: | 39.5 | 57.1 | 0.2 |
| – Net Position: | -10,715 | 10,480 | 235 |
| – Gross Longs: | 15,577 | 48,468 | 360 |
| – Gross Shorts: | 26,292 | 37,988 | 125 |
| – Long to Short Ratio: | 0.6 to 1 | 1.3 to 1 | 2.9 to 1 |
| NET POSITION TREND: | |||
| – Strength Index Score (3 Year Range Pct): | 66.5 | 33.6 | 18.7 |
| – Strength Index Reading (3 Year Range): | Bullish | Bearish | Bearish-Extreme |
| NET POSITION MOVEMENT INDEX: | |||
| – 6-Week Change in Strength Index: | -0.6 | 1.7 | -12.0 |
Article By InvestMacro – Receive our weekly COT Reports by Email
*COT Report: The COT data, released weekly to the public each Friday, is updated through the most recent Tuesday (data is 3 days old) and shows a quick view of how large speculators or non-commercials (for-profit traders) were positioned in the futures markets.
The CFTC categorizes trader positions according to commercial hedgers (traders who use futures contracts for hedging as part of the business), non-commercials (large traders who speculate to realize trading profits) and nonreportable traders (usually small traders/speculators) as well as their open interest (contracts open in the market at time of reporting).See CFTC criteria here.


