
By InvestMacro | COT | Data Tables | COT Leaders | Downloads | COT Newsletter
Here are the latest charts and statistics for the Commitment of Traders (COT) data published by the Commodities Futures Trading Commission (CFTC).
The latest COT data is updated through Tuesday June 28th and shows a quick view of how large traders (for-profit speculators and commercial entities) were positioned in the futures markets.
The COT metals market speculator bets were overall lower this week as just one out of the six metals markets we cover had higher positioning this week while five markets had lower contracts.
The only precious metals market with higher speculator bets was Palladium with a net gain of just 221 contracts on the week.
Free Reports:
 Get our Weekly Commitment of Traders Reports - See where the biggest traders (Hedge Funds and Commercial Hedgers) are positioned in the futures markets on a weekly basis.
 Sign Up for Our Stock Market Newsletter – Get updated on News, Charts & Rankings of Public Companies when you join our Stocks Newsletter
Leading the declines in speculator bets this week were Copper (-9,758 contracts) and Silver (-7,528 contracts) with Gold (-5,594 contracts) and Platinum (-2,797 contracts) also registering lower bets on the week.
 Strength scores (measuring the 3-Year range of Speculator positions, from 0 to 100 where above 80 is extreme bullish and below 20 is extreme bearish) show that all of the metals are in bearish extreme levels at the moment. Copper (20 percent) is at the highest level of all but still right at the cusp of the bearish extreme level while all the other metals are at just 2 percent or under, signifying that these are right at the bottom of their 3-year speculator sentiment range.
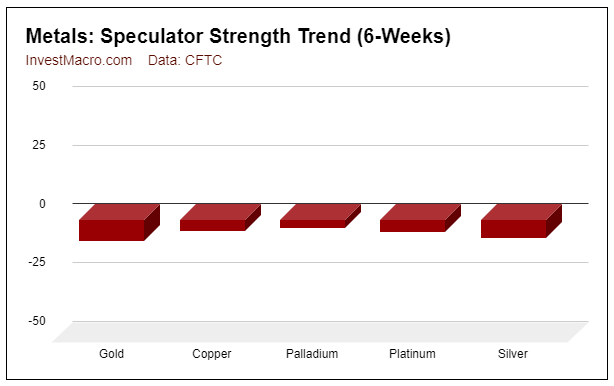 Strength score trends (or move index, that calculate 6-week changes in strength scores) show a similar picture as well with all the metals seeing downtrends for the past six weeks. Gold at -9 percent is leading the trends lower followed by Silver at -8 percent with the other metals all at -5 percent or lower.
| Jun-28-2022 | OI | OI-Index | Spec-Net | Spec-Index | Com-Net | COM-Index | Smalls-Net | Smalls-Index |
|---|---|---|---|---|---|---|---|---|
| WTI Crude | 1,651,566 | 0 | 299,692 | 3 | -327,938 | 99 | 28,246 | 55 |
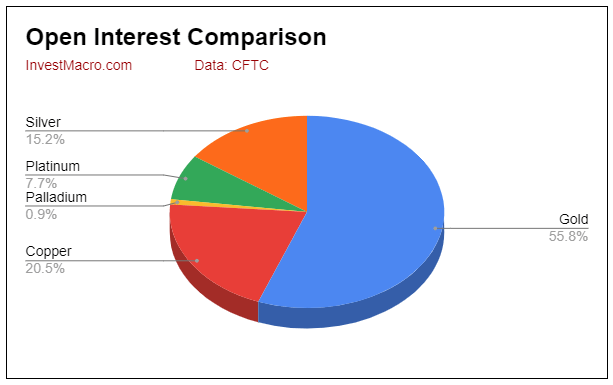
| Gold | 497,005 | 13 | 157,693 | 2 | -182,007 | 98 | 24,314 | 16 |
| Silver | 135,775 | 3 | 10,891 | 0 | -18,485 | 100 | 7,594 | 0 |
| Copper | 182,352 | 14 | -30,696 | 20 | 31,197 | 81 | -501 | 22 |
| Palladium | 7,765 | 6 | -3,825 | 1 | 4,441 | 100 | -616 | 8 |
| Platinum | 68,232 | 36 | -1,306 | 2 | -3,381 | 100 | 4,687 | 27 |
| Natural Gas | 987,740 | 0 | -129,419 | 40 | 90,840 | 60 | 38,579 | 71 |
| Brent | 173,920 | 19 | -42,677 | 40 | 41,434 | 62 | 1,243 | 26 |
| Heating Oil | 269,168 | 23 | 7,508 | 53 | -25,743 | 44 | 18,235 | 62 |
| Soybeans | 653,337 | 11 | 137,193 | 56 | -106,705 | 52 | -30,488 | 20 |
| Corn | 1,338,054 | 0 | 328,102 | 72 | -274,110 | 33 | -53,992 | 12 |
| Coffee | 194,896 | 2 | 45,200 | 78 | -47,147 | 26 | 1,947 | 9 |
| Sugar | 734,324 | 0 | 122,709 | 62 | -132,877 | 43 | 10,168 | 20 |
| Wheat | 291,041 | 0 | 7,679 | 29 | -1,871 | 57 | -5,808 | 80 |
Gold Comex Futures:
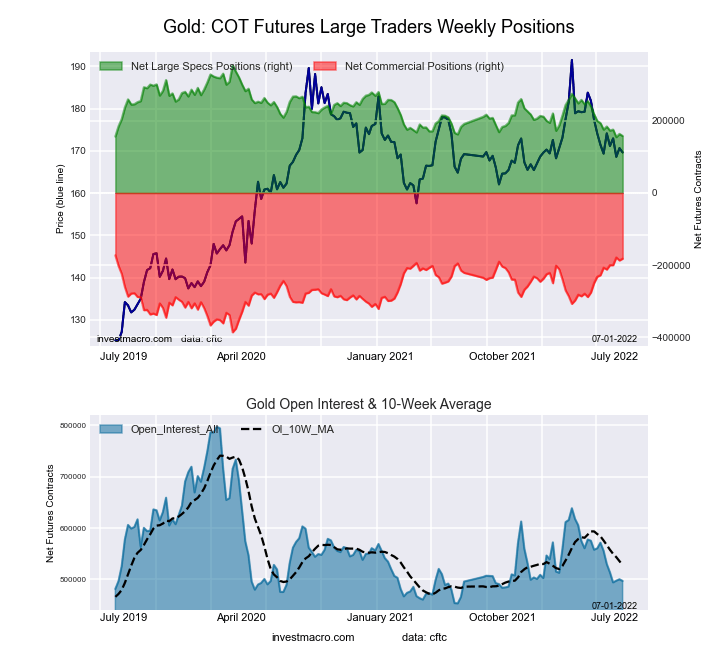 The Gold Comex Futures large speculator standing this week recorded a net position of 157,693 contracts in the data reported through Tuesday. This was a weekly fall of -5,594 contracts from the previous week which had a total of 163,287 net contracts.
This week’s current strength score (the trader positioning range over the past three years, measured from 0 to 100) shows the speculators are currently Bearish-Extreme with a score of 1.6 percent. The commercials are Bullish-Extreme with a score of 98.3 percent and the small traders (not shown in chart) are Bearish-Extreme with a score of 16.1 percent.
| Gold Futures Statistics | SPECULATORS | COMMERCIALS | SMALL TRADERS |
| – Percent of Open Interest Longs: | 54.1 | 23.5 | 9.0 |
| – Percent of Open Interest Shorts: | 22.3 | 60.2 | 4.1 |
| – Net Position: | 157,693 | -182,007 | 24,314 |
| – Gross Longs: | 268,712 | 117,038 | 44,823 |
| – Gross Shorts: | 111,019 | 299,045 | 20,509 |
| – Long to Short Ratio: | 2.4 to 1 | 0.4 to 1 | 2.2 to 1 |
| NET POSITION TREND: | |||
| – Strength Index Score (3 Year Range Pct): | 1.6 | 98.3 | 16.1 |
| – Strength Index Reading (3 Year Range): | Bearish-Extreme | Bullish-Extreme | Bearish-Extreme |
| NET POSITION MOVEMENT INDEX: | |||
| – 6-Week Change in Strength Index: | -8.9 | 12.0 | -25.7 |
Silver Comex Futures:
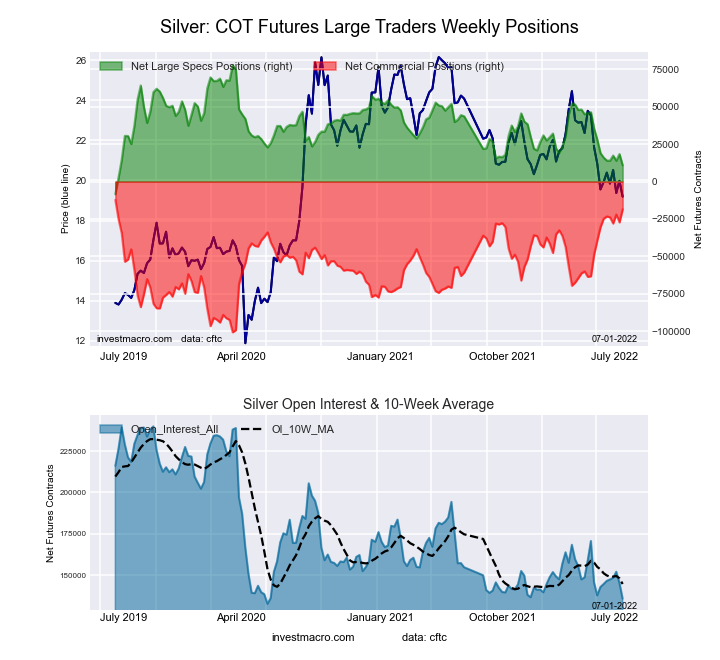 The Silver Comex Futures large speculator standing this week recorded a net position of 10,891 contracts in the data reported through Tuesday. This was a weekly decrease of -7,528 contracts from the previous week which had a total of 18,419 net contracts.
This week’s current strength score (the trader positioning range over the past three years, measured from 0 to 100) shows the speculators are currently Bearish-Extreme with a score of 0.0 percent. The commercials are Bullish-Extreme with a score of 100.0 percent and the small traders (not shown in chart) are Bearish-Extreme with a score of 0.0 percent.
| Silver Futures Statistics | SPECULATORS | COMMERCIALS | SMALL TRADERS |
| – Percent of Open Interest Longs: | 39.0 | 40.8 | 16.7 |
| – Percent of Open Interest Shorts: | 31.0 | 54.4 | 11.1 |
| – Net Position: | 10,891 | -18,485 | 7,594 |
| – Gross Longs: | 52,932 | 55,406 | 22,724 |
| – Gross Shorts: | 42,041 | 73,891 | 15,130 |
| – Long to Short Ratio: | 1.3 to 1 | 0.7 to 1 | 1.5 to 1 |
| NET POSITION TREND: | |||
| – Strength Index Score (3 Year Range Pct): | 0.0 | 100.0 | 0.0 |
| – Strength Index Reading (3 Year Range): | Bearish-Extreme | Bullish-Extreme | Bearish-Extreme |
| NET POSITION MOVEMENT INDEX: | |||
| – 6-Week Change in Strength Index: | -7.8 | 7.7 | -5.8 |
Copper Grade #1 Futures:
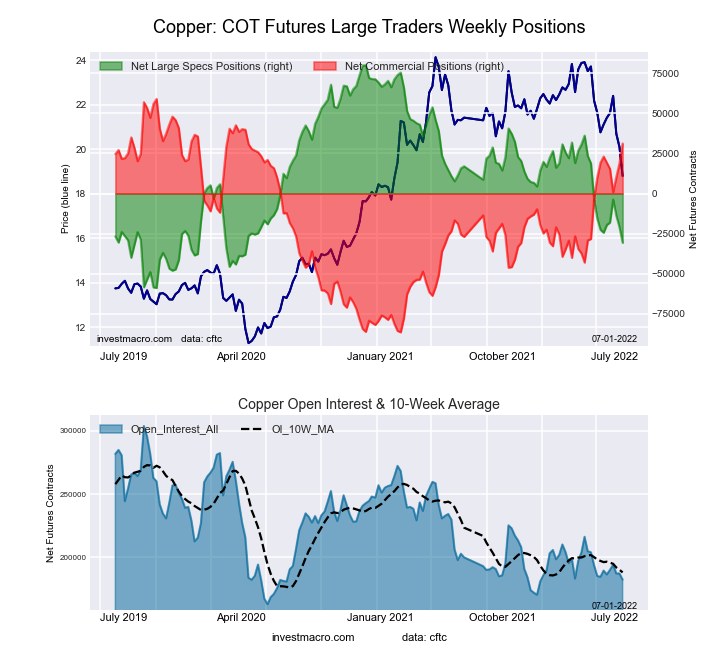 The Copper Grade #1 Futures large speculator standing this week recorded a net position of -30,696 contracts in the data reported through Tuesday. This was a weekly decrease of -9,758 contracts from the previous week which had a total of -20,938 net contracts.
This week’s current strength score (the trader positioning range over the past three years, measured from 0 to 100) shows the speculators are currently Bearish with a score of 20.3 percent. The commercials are Bullish-Extreme with a score of 80.9 percent and the small traders (not shown in chart) are Bearish with a score of 22.4 percent.
| Copper Futures Statistics | SPECULATORS | COMMERCIALS | SMALL TRADERS |
| – Percent of Open Interest Longs: | 26.2 | 56.8 | 8.0 |
| – Percent of Open Interest Shorts: | 43.0 | 39.7 | 8.2 |
| – Net Position: | -30,696 | 31,197 | -501 |
| – Gross Longs: | 47,782 | 103,666 | 14,516 |
| – Gross Shorts: | 78,478 | 72,469 | 15,017 |
| – Long to Short Ratio: | 0.6 to 1 | 1.4 to 1 | 1.0 to 1 |
| NET POSITION TREND: | |||
| – Strength Index Score (3 Year Range Pct): | 20.3 | 80.9 | 22.4 |
| – Strength Index Reading (3 Year Range): | Bearish | Bullish-Extreme | Bearish |
| NET POSITION MOVEMENT INDEX: | |||
| – 6-Week Change in Strength Index: | -4.5 | 5.6 | -10.7 |
Platinum Futures:
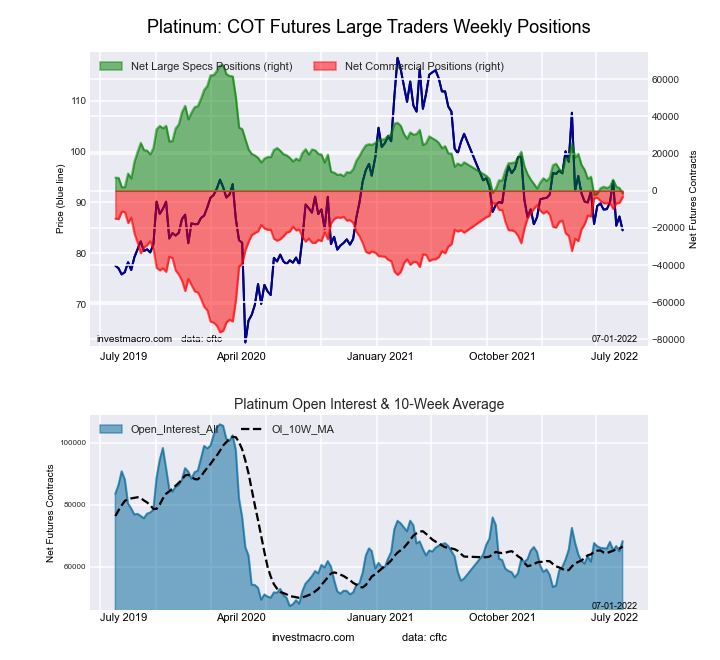 The Platinum Futures large speculator standing this week recorded a net position of -1,306 contracts in the data reported through Tuesday. This was a weekly decrease of -2,797 contracts from the previous week which had a total of 1,491 net contracts.
This week’s current strength score (the trader positioning range over the past three years, measured from 0 to 100) shows the speculators are currently Bearish-Extreme with a score of 1.5 percent. The commercials are Bullish-Extreme with a score of 100.0 percent and the small traders (not shown in chart) are Bearish with a score of 27.4 percent.
| Platinum Futures Statistics | SPECULATORS | COMMERCIALS | SMALL TRADERS |
| – Percent of Open Interest Longs: | 41.7 | 41.6 | 12.5 |
| – Percent of Open Interest Shorts: | 43.6 | 46.6 | 5.6 |
| – Net Position: | -1,306 | -3,381 | 4,687 |
| – Gross Longs: | 28,451 | 28,413 | 8,503 |
| – Gross Shorts: | 29,757 | 31,794 | 3,816 |
| – Long to Short Ratio: | 1.0 to 1 | 0.9 to 1 | 2.2 to 1 |
| NET POSITION TREND: | |||
| – Strength Index Score (3 Year Range Pct): | 1.5 | 100.0 | 27.4 |
| – Strength Index Reading (3 Year Range): | Bearish-Extreme | Bullish-Extreme | Bearish |
| NET POSITION MOVEMENT INDEX: | |||
| – 6-Week Change in Strength Index: | -5.0 | 4.6 | 2.7 |
Palladium Futures:
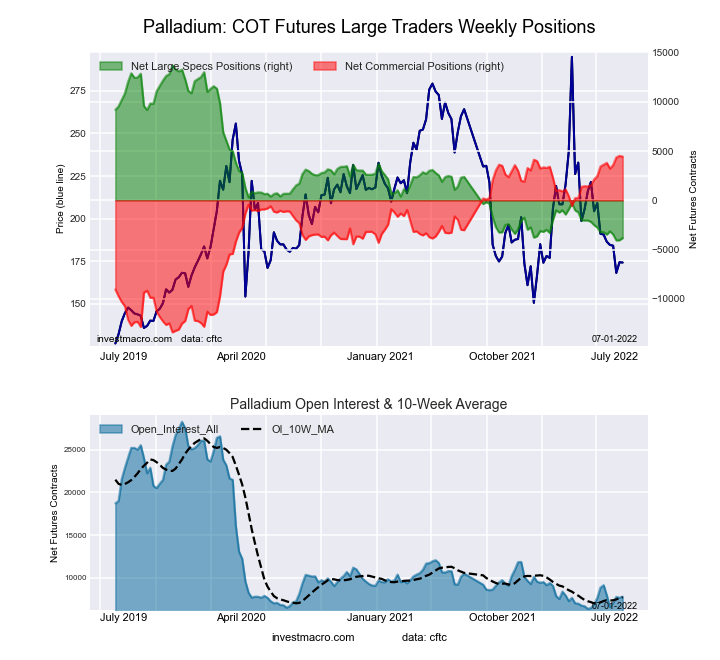 The Palladium Futures large speculator standing this week recorded a net position of -3,825 contracts in the data reported through Tuesday. This was a weekly rise of 221 contracts from the previous week which had a total of -4,046 net contracts.
This week’s current strength score (the trader positioning range over the past three years, measured from 0 to 100) shows the speculators are currently Bearish-Extreme with a score of 1.3 percent. The commercials are Bullish-Extreme with a score of 99.6 percent and the small traders (not shown in chart) are Bearish-Extreme with a score of 8.2 percent.
| Palladium Futures Statistics | SPECULATORS | COMMERCIALS | SMALL TRADERS |
| – Percent of Open Interest Longs: | 14.8 | 73.1 | 11.5 |
| – Percent of Open Interest Shorts: | 64.0 | 15.9 | 19.4 |
| – Net Position: | -3,825 | 4,441 | -616 |
| – Gross Longs: | 1,146 | 5,674 | 893 |
| – Gross Shorts: | 4,971 | 1,233 | 1,509 |
| – Long to Short Ratio: | 0.2 to 1 | 4.6 to 1 | 0.6 to 1 |
| NET POSITION TREND: | |||
| – Strength Index Score (3 Year Range Pct): | 1.3 | 99.6 | 8.2 |
| – Strength Index Reading (3 Year Range): | Bearish-Extreme | Bullish-Extreme | Bearish-Extreme |
| NET POSITION MOVEMENT INDEX: | |||
| – 6-Week Change in Strength Index: | -3.4 | 4.6 | -12.2 |
Article By InvestMacro – Receive our weekly COT Reports by Email
*COT Report: The COT data, released weekly to the public each Friday, is updated through the most recent Tuesday (data is 3 days old) and shows a quick view of how large speculators or non-commercials (for-profit traders) were positioned in the futures markets.
The CFTC categorizes trader positions according to commercial hedgers (traders who use futures contracts for hedging as part of the business), non-commercials (large traders who speculate to realize trading profits) and nonreportable traders (usually small traders/speculators) as well as their open interest (contracts open in the market at time of reporting).See CFTC criteria here.

- COT Metals Charts: Weekly Speculator Bets led by Copper & Steel Jul 18, 2026
- COT Bonds Charts: Weekly Speculator Bets led by 2-Year, SOFR 3M & 5-Year Bonds Jul 18, 2026
- COT Energy Charts: Weekly Speculator Bets led by Brent Oil & Heating Oil Jul 18, 2026
- COT Soft Commodities Charts: Weekly Speculator Bets led by Wheat, Corn & Soybean Meal Jul 18, 2026
- The Bank of Canada kept its interest rate unchanged. Platinum prices reached a three‑week high Jul 16, 2026
- Stock indices rose after the release of US inflation data. China’s GDP slowed sharply Jul 15, 2026
- GBP/USD Awaits Political News: What Will Happen Next Jul 15, 2026
- USD/JPY Holds at Highs: Pressure Lingers on Yen Jul 14, 2026
- Oil prices jumped 4% amid a new wave of escalation between the US and Iran Jul 13, 2026
- EUR/USD: US Inflation Will Determine Everything Jul 13, 2026